This article will explain how to profile and monitor Quarkus native executables using JDK Flight Recorder (JFR). It will provide a step-by-step guide through building, running, and inspecting a Quarkus-native executable with JFR. You will also learn about the current features available, depending on your GraalVM/Mandrel version and how you can start using them.
Prerequisites
This article is meant for those already somewhat familiar with Quarkus native executables and who want to know the extent of JFR support in native mode and how to enable it.
To get the most out of this article, you should already be familiar with building Quarkus native applications. If you're just getting started, you can learn how to build Quarkus Java applications and Quarkus native applications. This article will walk you through everything from scratch. But we recommend reading the previous two articles, Improvements to Native Image JFR support in GraalVM for JDK 20 and Implementing JDK Flight Recorder support for GraalVM Native Image.
It is also good to have some experience using JFR and inspecting recordings using Java Mission Control (JMC). Again, this is not strictly necessary because all the steps will be covered here, but it is good background knowledge to have.
GraalVM version
For features such as stack traces, allocation events, container events, some thread events, and event streaming, you need GraalVM for JDK 17/JDK 20 or Mandrel 23. If you are using the Red Hat build of Quarkus, Mandrel 22.3 is the version that is officially supported. That version of Native Image does not include some of the features available in the latest GraalVM / Mandrel release, but custom JFR events and some useful built-in VM inspection events are still available. Please refer to the table at the end of this article for a summary of features included for each version.
You can download GraalVM and Mandrel versions.
How to build, run, and inspect with JFR
Use the -Dquarkus.native.monitoring=jfr option when building your native executable. Then, use -XX:+FlightRecorder -XX:StartFlightRecording=filename=recording.jfr when running your native executable.
For example, if using the hibernate-orm-quickstart, follow these steps:
1. Specify what version of GraalVM/Mandrel to use.
export GRAALVM_HOME=<Path to Mandrel or GraalVM>
2. Build the native executable.
./mvnw package -Dnative -Dquarkus.native.monitoring=jfr
Notice that here we use -Dquarkus.native.monitoring to specify we want to add JFR features to the image build.
3. Start up the database that the Quarkus app will use. This step is exactly the same as in the quick start tutorial.
docker run --rm=true --name quarkus_test -e POSTGRES_USER=quarkus_test -e POSTGRES_PASSWORD=quarkus_test -e POSTGRES_DB=quarkus_test -p 5432:5432 postgres:13.3
4. Run the binary which is generated in the /target directory.
./target/hibernate-orm-quickstart-1.0.0-SNAPSHOT-runner -XX:+FlightRecorder -XX:StartFlightRecording=filename=recording.jfr
You can also pass other Flight Recorder settings, such as providing a duration or specifying a configuration file:
-XX:StartFlightRecording=settings=Path/To/YourSettings.jfc,duration=60s,filename=recording.jfr
5. Interact with the application at http://0.0.0.0:8080/. Once you are done, use Ctrl+C to stop the Quarkus application.
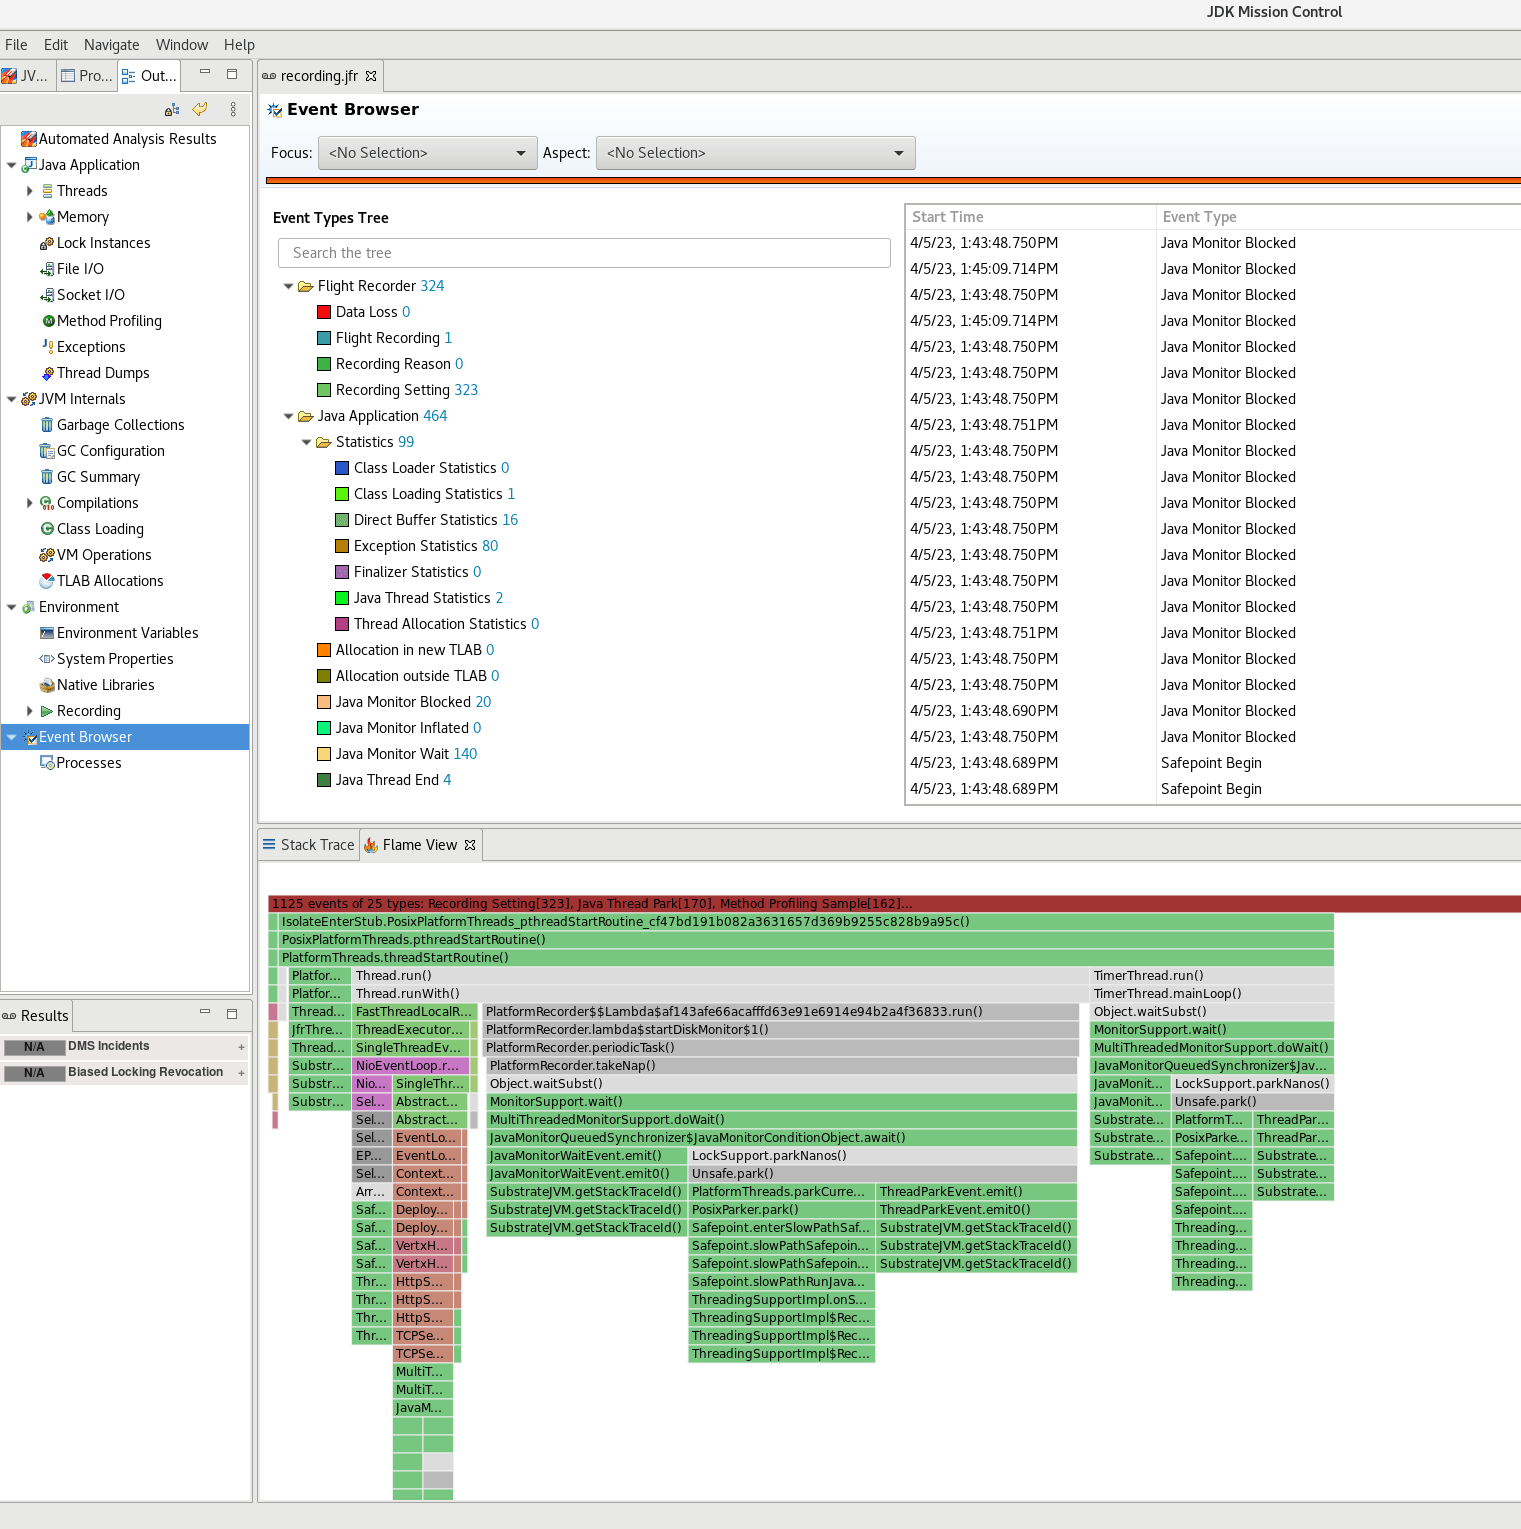
6. A JFR snapshot file named recording.jfr should have been generated in the current working directory. Let's open it with Java mission control (JMC), as shown in Figure 1.
Example use case: Profiling object allocations
In Hotspot, there are two JFR events used to determine where your application is doing most of its allocations as well as their sizes: jdk.ObjectAllocationInNewTLAB and jdk.ObjectAllocationOutsideTLAB. However, in SubstrateVM (the runtime environment that Native Image uses) new allocations that won't fit in the current thread local allocation buffer (TLAB) are always allocated in a new TLAB (at the time of GraalVM for JDK 17/20). For this reason, only jdk.ObjectAllocationInNewTLAB exists in Native Image.
Similarly to Hotspot, this event does not account for every single allocation. Instead, as the name suggests, it's only emitted when the allocation slow path is taken and a new TLAB is required. This effective sampling greatly reduces the overhead of using this event. However, there is still large and indeterministic overhead to enabling this event, which is why it is disabled by default (similar to Hotspot). It is only meant for profiling/debugging purposes, not for continuous monitoring. To enable this event, you should provide a settings configuration (.jfc file) when running your executable with JFR. You must enable the event in the configuration file as follows:
  <event name="jdk.ObjectAllocationInNewTLAB">
    <setting name="enabled" control="gc-enabled-high">true</setting>
    <setting name="stackTrace">true</setting>
  </event>
Alternatively, you can use the preset settings file profile.jfc, which already has the event enabled.
Running your application will now look like this:
./target/hibernate-orm-quickstart-1.0.0-SNAPSHOT-runner -XX:+FlightRecorder -XX:StartFlightRecording=settings=<Path/To/your.jfc>,filename=recording.jfr
After running the executable and opening the JFR file in JMC, you should be able to see information in the Memory tab (Figure 2).

Current JFR features
The following sections describe the new JFR support in GraalVM for JDK 17/JDK 20 and Mandrel 23. Refer to the table at the end of this article for a summary of features in the latest GraalVM release versus Mandrel 22.3.
Events
Implemented events are as close to the versions available in OpenJDK as possible, providing the expected event fields, thread info, and stack trace data. There are events available in OpenJDK that are not applicable to ahead-of-time compiled native executables and have been purposefully excluded. Such examples include events related to compilation and class loading. Events that instrument the VM (i.e., thread, monitor, and safe point events) have been recreated in the SubstrateVM internal code to replicate the same behavior as in HotSpot. Events that are implemented in OpenJDK through bytecode instrumentation are not yet available in Native Image (i.e., file, exception, and socket events).
You can find the most up-to-date list on GitHub. You can also refer to a useful list of OpenJDK JFR events.
Method profiling
Similar to OpenJDK, profiling is done via a sampling-based approach with the jdk.ExecutionSample event. There are 2 sampling methods that can be toggled with command line arguments. If the argument -H:+SignalHandlerBasedExecutionSampler is provided at image build time, the SIGPROF based sampler will be used. Otherwise, the recurring callback sampler will be used. If using the SIGPROF sampler, your build command will look like this:
./mvnw package -Dnative -Dquarkus.native.monitoring=jfr -Dquarkus.native.additional-build-args=-H:+SignalHandlerBasedExecutionSampler
Method sampling can help you determine where your application is spending most of its time, identifying hot methods (Figure 3).

Event streaming
Event streaming was introduced to JFR in JDK 14. As of GraalVM for JDK 17/JDK 20, it is experimentally supported in Native Image. It allows an application to subscribe to a stream of its events while a recording is still in progress. Previously, to access JFR data, a recording file had to be dumped, then parsed. Similar to OpenJDK, event streaming in Native Image has two main components, the consumer code that parses JFR disk repository chunks and performs call backs, and the producer code that periodically updates the disk repository. The consumer code is reused from OpenJDK, while the producer code had to be re-implemented to work in SubstrateVM.
This re-implemented producer component allows for the flushing of active JFR chunk data to the JFR disk repository. Flushing in-progress data before the chunk is complete is the key component that allows for more frequent updates. The following example illustrates the setting up of a stream and registering a callback, triggered when a monitor wait event is emitted. The callback prints the monitor's class, and current thread does not block when the asynchronous stream starts.
var rs = new RecordingStream();
rs.enable("jdk.JavaMonitorWait");
rs.onEvent("jdk.JavaMonitorWait", event -> {
    System.out.println(event.<RecordedClass>getValue("monitorClass").getName());
});
rs.startAsync();
Summary of features by version
|
Feature |
GraalVM for JDK17 and JDK 20, and Mandrel 23 |
Mandrel 22.3 |
| Event streaming | Supported (experimental) | Not supported |
| Stack traces | Supported | Not supported |
| Method Profiling | Supported | Not supported |
| Custom Events | Supported | Supported |
| Control recordings via recording API | Supported | Supported |
|
ActiveRecording ActiveSetting DataLoss ExecuteVMOperation GarbageCollection GCPhasePause InitialEnvironmentVariable InitialSystemProperty JavaMonitorEnter JavaMonitorWait JavaThreadStatistics JVMInformation OSInformation PhysicalMemory SafepointBegin SafepointEnd ThreadEnd ThreadSleep ThreadStart |
Supported | Supported |
|
ContainerCPUThrottling ContainerCPUUsage ContainerConfiguration ContainerIOUsage ContainerMemoryUsage ExecutionSample JavaMonitorInflate ObjectAllocationInNewTLAB ThreadPark |
Supported | Not supported |
Using JFR for Quarkus-native executables
This article explained how to profile and monitor Quarkus-native executables using JDK Flight Recorder (JFR). We hope you were able to easily follow the steps for building, running, and inspecting Quarkus native executables with JFR. Now, you can utilize the current features, depending on your GraalVM/Mandrel version. Comment below if you have questions. We welcome your feedback.
Last updated: September 19, 2023