JDK Mission Control is now the newest member of the Red Hat Software Collections (RHSCL). JDK Mission Control is a powerful profiler for HotSpot Java virtual machines (JVMs) and has an advanced set of tools that enable efficient and detailed analysis of the extensive data collected by JDK Flight Recorder. The toolchain enables developers and administrators to collect and analyze data from Java applications running locally or deployed in production environments using OpenJDK 11.
In this article, I will go through a primary example of setting up JDK Mission Control. For Linux, JDK Mission Control is part of the RHSCL and, for Windows, it is available as part of the OpenJDK zip distribution on the Red Hat Customer Portal. For Linux, these instructions assume that Red Hat Build of OpenJDK 11 is already installed. I will show how to set up the system to install software from RHSCL, which provides the latest development technologies for Red Hat Enterprise Linux. Then, I will install the JDK Mission Control and run a simple sample application. The whole tutorial should take fewer than 10 minutes to complete.
Installing Mission Control
For Microsoft Windows
For Microsoft Windows, the OpenJDK zip available via the Red Hat Customer Portal now contains JDK Mission Control and JDK Flight Recorder. Once un-archived, the JMC binary can be found in the bin directory.
For Red Hat Enterprise Linux
You can add or remove software repositories from the command line using the subscription-manager tool as the root user. Use the --list option to view the available software repositories and verify that you have access to RHSCL:
$ su -
# subscription-manager repos --list | egrep rhscl
Depending which variant is used (e.g., server or workstation), you can enable the repo with the following command:
# subscription-manager repos --enable rhel-variant-rhscl-7-rpms
Install JMC with the following command:
$ yum install rh-jmc
We have now installed JMC. You can launch it by typing JMC or heading off to the applications menu.
If you are running multiple versions of Java, as I do, and want to launch JMC from the command line, use the following options to launch JMC with the path to the Red Hat Build of OpenJDK.
$ scl enable rh-jmc bash
$ jmc -vm /usr/lib/jvm/java-11-openjdk-11.0.2.7-0.el7_6.i386/bin
Real-time Monitoring
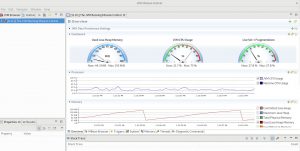
JMC allows you to perform real-time monitoring of JVMs. To do this, create a new connection from the File Menu, choose your JVM, and start JMX console. The result should give you an overview page with Processors, Memory consumption, Java heap use, JVM CPU usage, etc.

Now that we have JMC set up, let's try to run an example and see how it works.
The following is a simple example of reading a couple of files. Indeed, there can be issues that we have not taken into consideration. In the example below, I have two files: a simple HTML file and a text file, which is about 1 GB.
import java.io.BufferedReader;
import java.io.File;
import java.io.FileReader;
import java.io.IOException;


public class TextFileReader {

private File textFilePath = null;


public TextFileReader(String textFilePath) {
    if (textFilePath == null)
        throw new IllegalArgumentException();
    this.textFilePath = new File(textFilePath);
}

public void readFile() throws IOException {
    FileReader fileReader = new FileReader(textFilePath);
    BufferedReader bufferedreader = new BufferedReader(fileReader);
    StringBuffer sb = new StringBuffer();
    String strLine;
    while ((strLine = bufferedreader.readLine()) != null) {
        sb.append(strLine);
        sb.append("\n");
    }

    fileReader.close();
    System.out.println(sb.toString());
}

public static void main(String[] args) throws IOException{

    new TextFileReader("index.html").readFile();
    new TextFileReader("test.txt").readFile();

}

}
Let’s execute the following commands to compile and run this example.
$ javac TextFileReader.java

$ java -XX:+FlightRecorder -XX:StartFlightRecording=dumponexit=true,filename=filereader.jfr TextFileReader
In the above Java command, the parameter -XX:StartFlightRecording will dump the results into filereader.jfr.
Let's look at the results by opening this file in JMC.

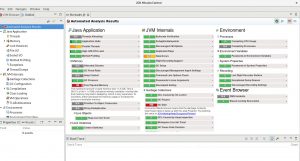
JMC reports in-depth details on the entire run; for example, JVM internals shows that GC is Stalling. Moreover, with a large file with not much memory, that is a problem, so we can fix the issue either by lowering the value of -XX:InitiatingHeapOccupancyPercent and even more so ensuring that there is enough memory (e.g., Xms1024m -Xmx4096m).
Another great example can be found here by Jie Kang, Software Engineer at Red Hat, where he shows how the method profiling works, aiding in optimization of the original code.
JMC is very useful for understanding application behavior such as memory leaks, deadlock, and much more. Give it a try with the Red Hat Build of OpenJDK 11
Last updated: November 1, 2023