This article describes the improvements to the Native Image JFR support in GraalVM JDK 20. This is a follow up to a previous article's section, Implementing JDK Flight Recorder support for GraalVM Native Image. JDK Flight Recorder (JFR) is a powerful tool that assists the profiling, debugging, and monitoring of Java applications. We will discuss the new developments available in GraalVM for JDK 17 and JDK 20.
3 steps to build a native image with JFR
These steps illustrate the simplest way to use JFR with Native Image. You can also start a JFR recording over a JMX connection as described in the sections that follow, or by using the jdk.jfr.Recording API from within your application code.
- Compile your application to byte code as follows:
$JAVA_HOME/bin/javac YourApplication.java - Use the
--enable-monitoringoption to build a native image with JFR support:native-image --enable-monitoring=jfr YourApplication - Run with Flight Recorder.
./yourapplication -XX:StartFlightRecording=duration=60s,filename=recording.jfr
New supported features
This section will provide a brief rundown of the new major JFR features available in Native Image.
Stack traces
The first big improvement to JFR in Native Image is support for event stack traces. This also allows for method profiling which can provide insight into where your application is spending the most time, as shown in Figure 1. Events now carry stack traces so you can easily see where they are getting emitted.

Remote JMX connection
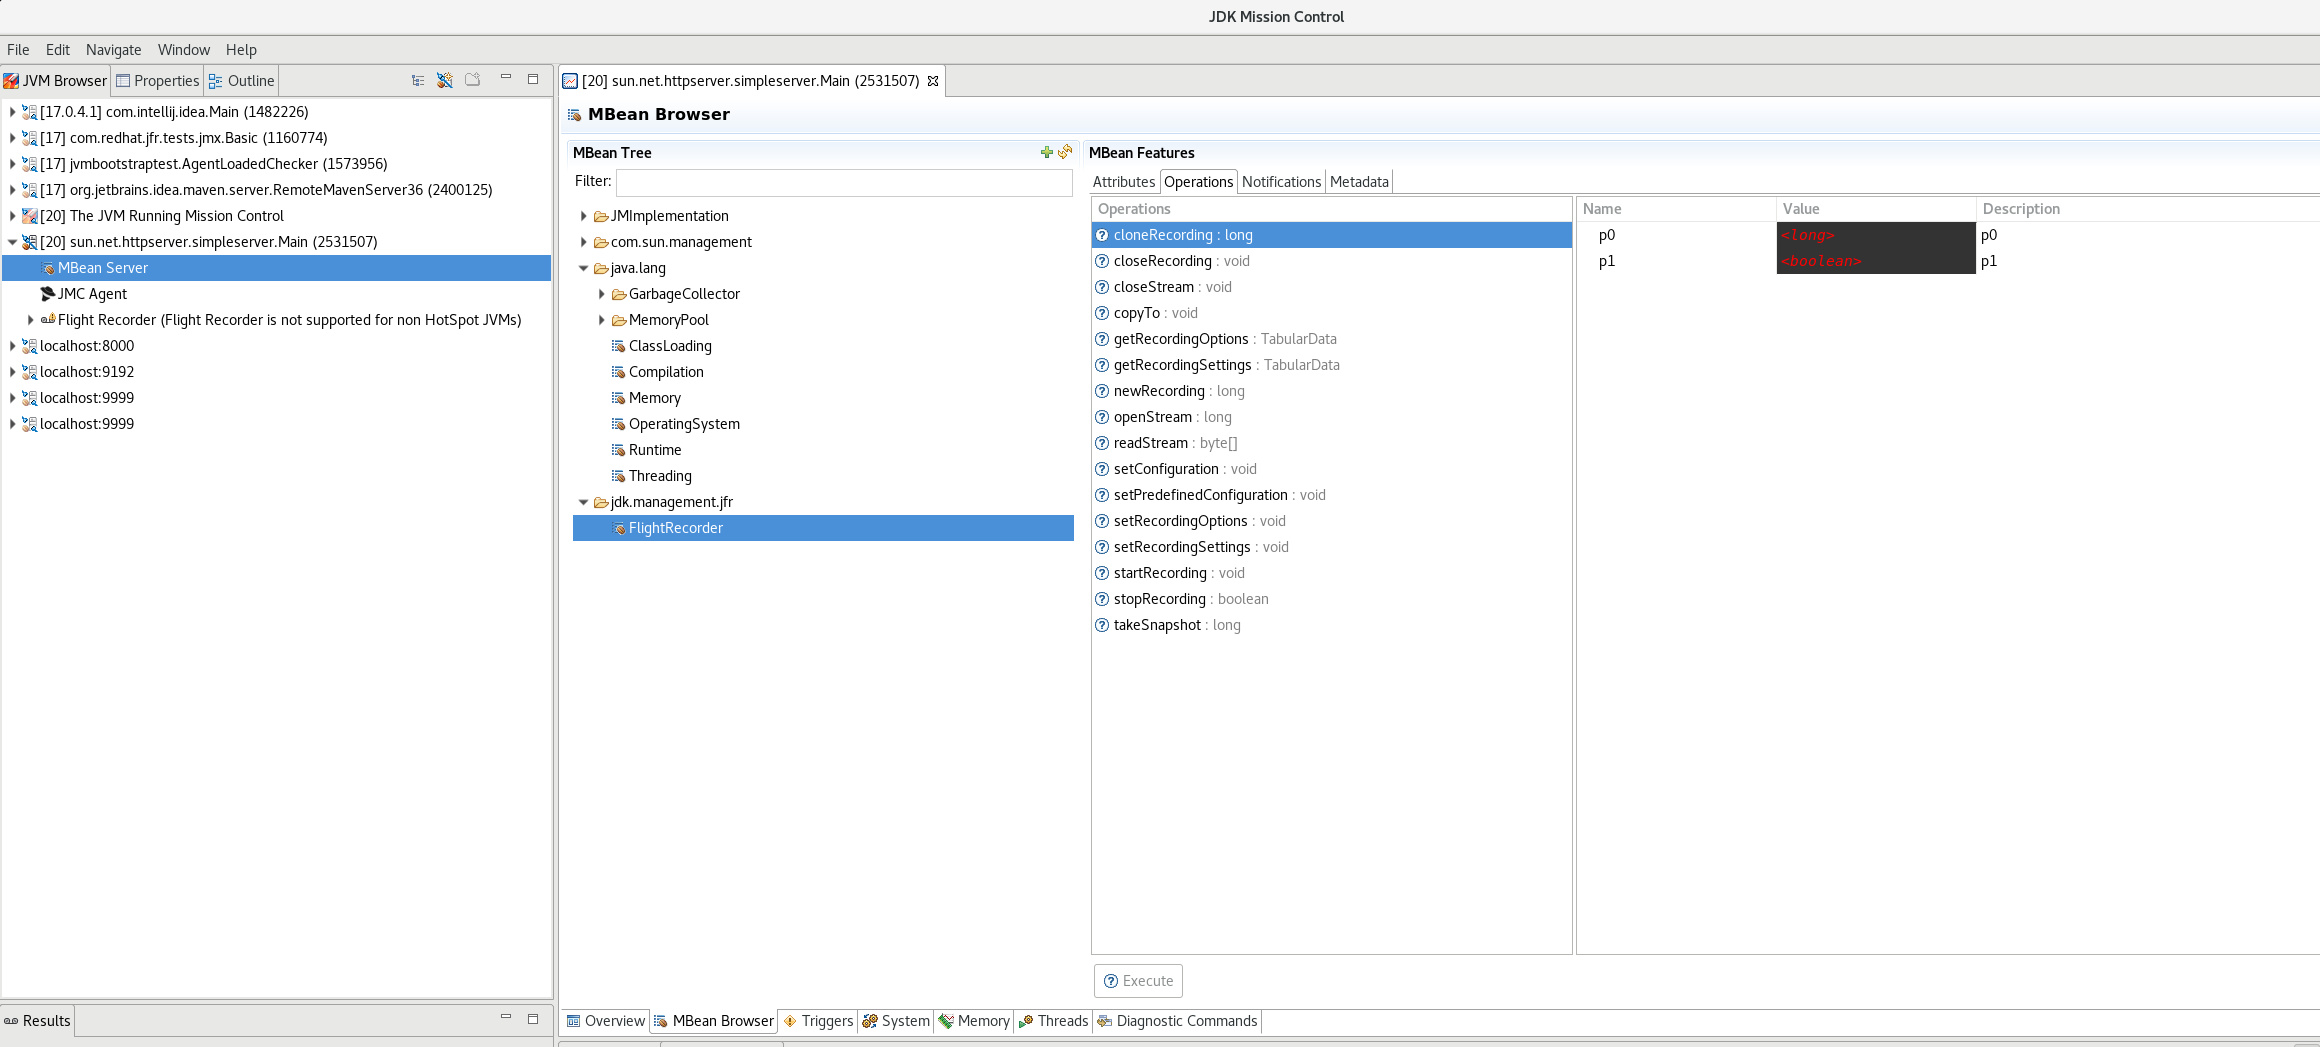
Remote connection via JMX is also possible, the jdk.management.jfr.FlightRecorderMXBean. This means that JFR recordings can be started remotely from out of process (from either another JVM or native image). Unfortunately, the Flight Recorder wizard in JMC does not recognize non-hotspot JVMs, which means you must interact with FlightRecorderMXBean from the MBean Browser tab, as shown in Figure 2.
Remote JMX support in Native Image is still experimental, so you can expect more changes in this area in the future. Currently, PlatformMXBeans (i.e., ThreadMXBean) are only partially supported because the underlying implementations in SubstrateVM do not exist yet. The amount of reflection, dynamic proxy, and serialization metadata configuration required to support remote JMX is large because it is unknown ahead of time what MBeans and operations will be used. This means that JMX support results in an image size increase of a little over 20 MB. Please see the GraalVM website for more information on remote JMX and its limitations.
How to create a JFR Recording using JMC over JMX
1. Build your native image with: --enable-monitoring=all or --enable-monitoring=jvmstat,jfr,jmxclient,jmxserver
native-image --enable-monitoring=all -m jdk.httpserver
The jvmstat option makes your application discoverable. The jfr option adds JDK Flight Recorder Support. The jmxclient/jmxserver options add support for outgoing/incoming JMX connections.
2. Start your native image executable with JMX options. Disclaimer: these options disable SSL and password authentication (both of which are supported, but aren’t included here for convenience of the demo).
./jdk.httpserver -Dcom.sun.management.jmxremote.authenticate=false \
-Djava.rmi.server.hostname=localhost \
-Dcom.sun.management.jmxremote.port=9996 \
-Dcom.sun.management.jmxremote.ssl=false \
-Dcom.sun.management.jmxremote.local.only=false
3. Open JMC and select your application in the JVM browser (there's no JVM but it'll show up there because you built with jvmstat).
4. Navigate to the MBean Browser tab and select FlightRecorderMXBean.
5. Select the Operations tab and execute the newRecording operation. Make note of the returned recording ID.
6. Execute setPredefinedConfiguration operation, providing the recording ID from the previous step as well as profile as the second argument.
7. Execute the startRecording operation, providing the recording ID from the previous step.
8. When you're ready to dump the recording, execute the copyTo operation, providing the recording ID as well as a filename (MyRecording.jfr).
Event streaming
Now event streaming has experimental support in Native Image. JFR event streaming was introduced in OpenJDK 14 and allows for streaming of events from an ongoing recording. Previously, recording had to be dumped to a JFR snapshot before the event data could be read. However, now an application can subscribe to a stream of its own event data (or even that of another process) and register callbacks triggered by specific events. A current limitation of event streaming in Native Image is that stack traces are not available for streamed events. This is actively being worked on and does not affect stack traces available in a snapshot file.
New supported events
This section highlights the new support for events grouped by category.
Monitor and thread events
There is now support for monitor and thread-related events. These events can provide insight into where and why threads are often stopped or waiting.
- jdk.ThreadSleep
- jdk.ThreadPark
- jdk.JavaMonitorEnter
- jdk.JavaMonitorWait
- jdkJavaMonitorInflate
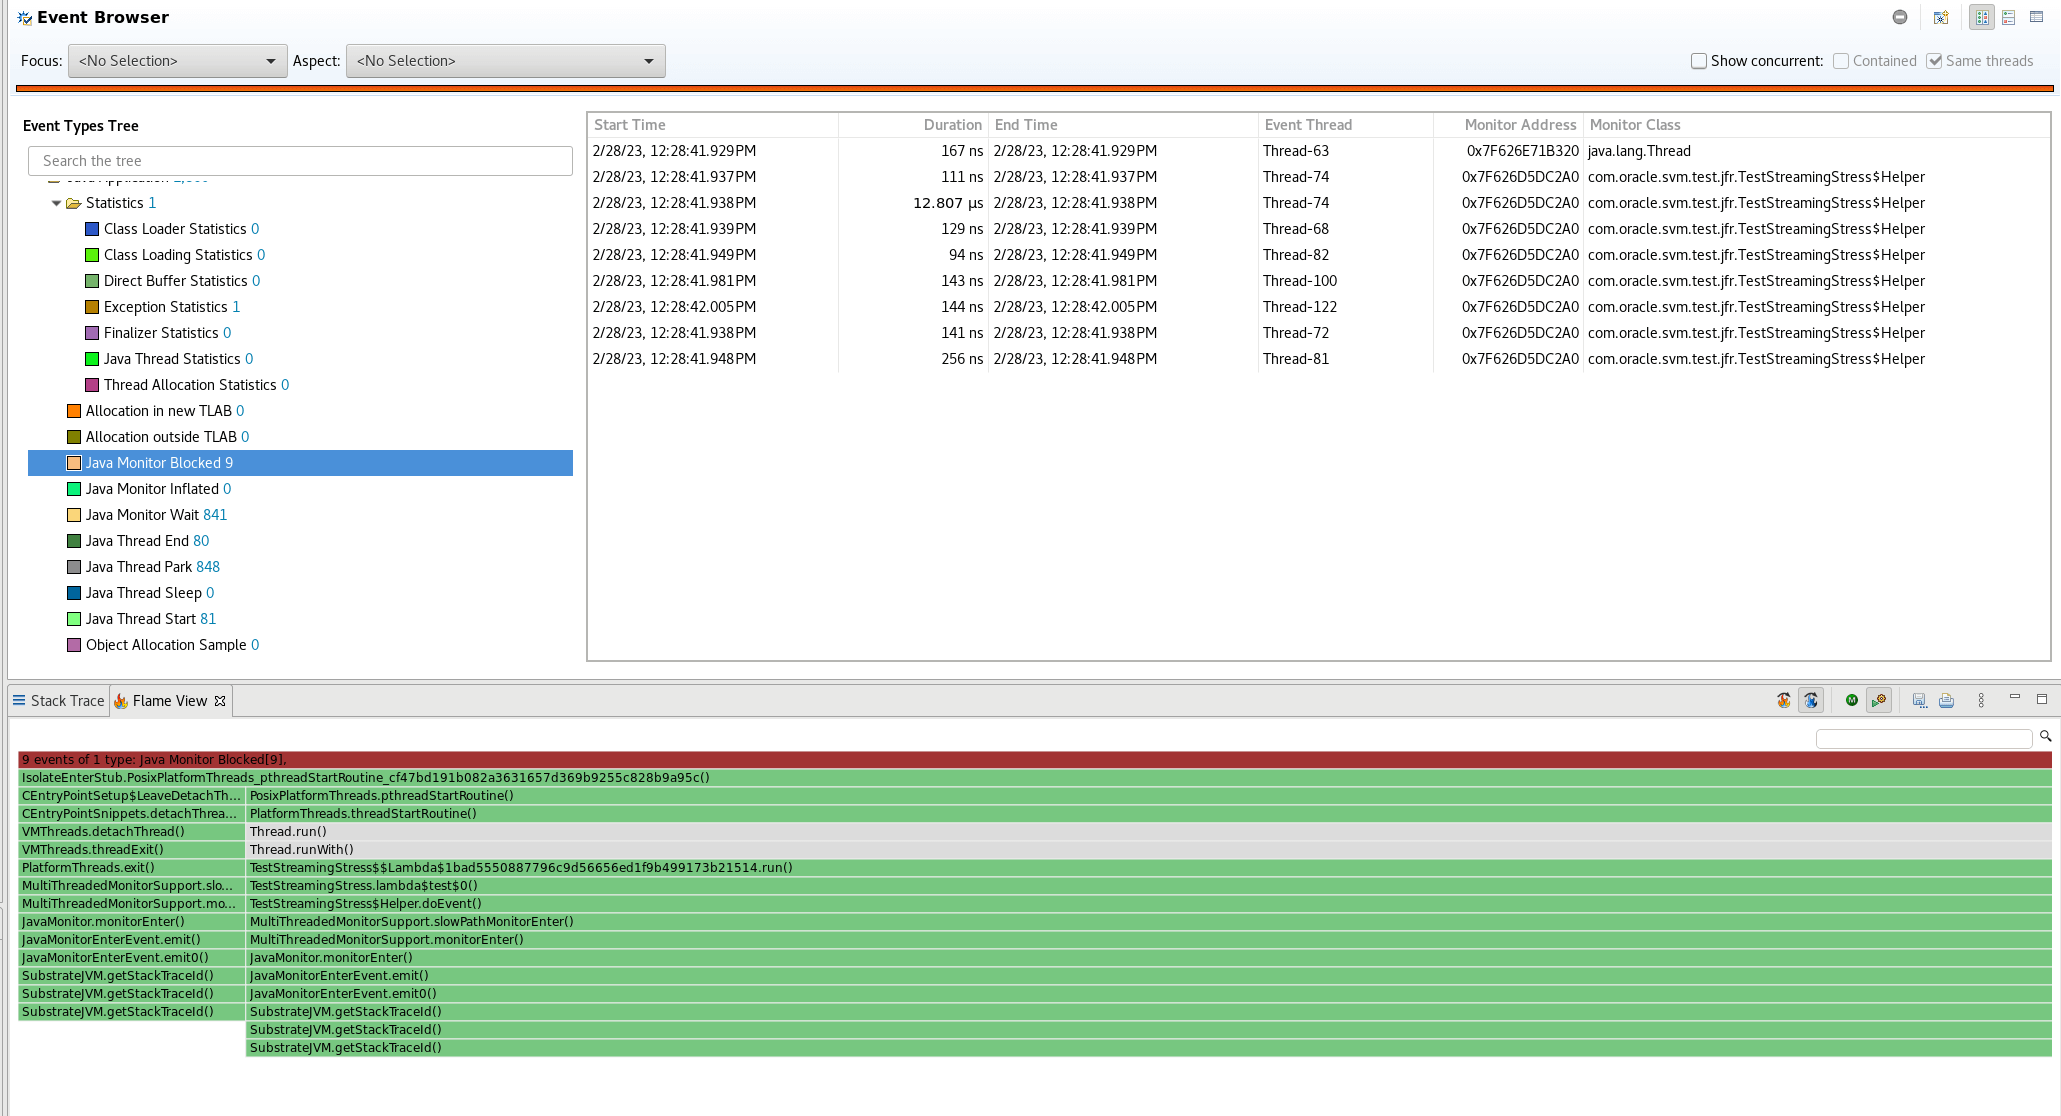
Figure 3 shows how these new events can be used in combination with newly supported stack traces to generate flame graphs identifying where threads are blocked.
Allocation events
The following allocation event is now supported. This event is useful for discerning the places where your application does most of its allocations. Since this event generates a lot of data/overhead, it is disabled by default (similar to OpenJDK). You can use it by providing a custom settings file with the event set to enabled (-XX:StartFlightRecording=settings=/path/to/settings.jfc).
- jdk.ObjectAllocationInNewTLAB
Container events
The following events related to containers are now supported:
- jdk.ContainerCPUThrottling
- jdk.ContainerCPUUsage
- jdk.ContainerConfiguration
- jdk.ContainerIOUsage
- jdk.ContainerMemoryUsage
What's next?
Support for leak detection via the jdk.OldObjectSample event is in progress. This is a sampling based approach that tracks large long-lived objects to provide insights into potential memory leaks. Support for allocation profiling is also in development via the jdk.ObjectAllocation event and emission throttling. Throttling is important to control the overhead associated with instrumenting object allocations. Support for other built-in events available in OpenJDK/Hotspot continues.
Other features such as in memory chunk rotation are not yet being worked on. Other features are unsupported because they are not applicable to Native Image. Specifically, events related to compilation, dynamic bytecode instrumentation, and class loading are not applicable. Control of JFR via jcmd is also not possible because jcmd is unsupported in Native Image.
Please visit this GitHub issue for the most up-to-date list of supported JFR events in Native Image. In addition to these built-in events, the JFR custom events API is also supported. Users can create and emit their own custom application level events by extending jdk.jfr.Event class.