Are you building microservices? Do you struggle with observability and with capturing telemetry data between distributed services? This article shows how to quickly and easily introduce OpenTelemetry into a distributed system built on Java with Quarkus. This combination allows you to visualize the interactions between all the microservices within an overall system.
The article introduces the official Quarkus sample application, Quarkus Superheroes, deploys it on the free Developer Sandbox for Red Hat OpenShift, and demonstrates how to collect and visualize telemetry data in order to observe microservices' behavior.
What is OpenTelemetry?
The OpenTelemetry website states that "OpenTelemetry is a collection of tools, APIs, and SDKs. Use it to instrument, generate, collect, and export telemetry data (metrics, logs, and traces) to help you analyze your software's performance and behavior."
OpenTelemetry was created by merging the popular OpenTracing and OpenCensus projects. It is a standard that integrates with many open source and commercial products written in many programming languages. Implementations of OpenTelemetry are in varying stages of maturity.
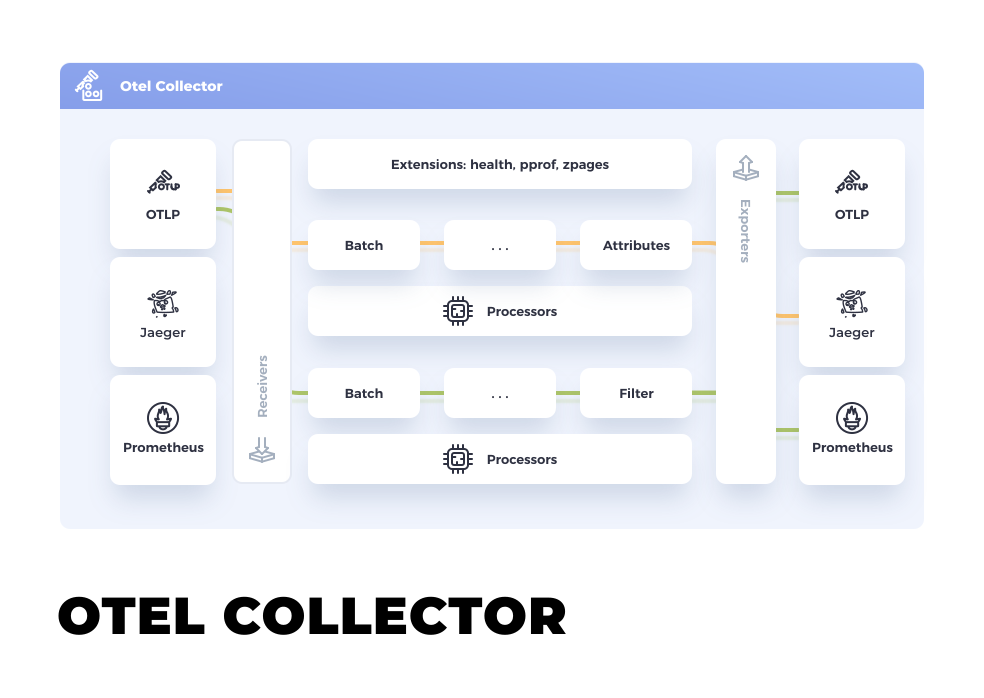
At its core, OpenTelemetry contains the Collector, a vendor-agnostic way to receive, process, and export telemetry data. Figure 1 displays the Collector's high-level architecture.
For more information about observability and OpenTelemetry, check out the excellent article, Observability in 2022: Why it matters and how OpenTelemetry can help by Ben Evans. In addition, Daniel Oh's article about integrating OpenTelemetry into Quarkus applications running on Knative is a great read.
Now let's discuss how OpenTelemetry can help you observe the Quarkus Superheroes application.
Prerequisites for the Quarkus Superheroes application
You can easily deploy the Quarkus Superheroes application on any Kubernetes instance. Here we deploy the application on the Developer Sandbox for Red Hat OpenShift because it is easy to obtain a free account and the environment requires minimal setup. But you can adapt the instructions in this article to other Kubernetes environments.
To follow along on your own with the steps in this demonstration, you will need:
- A free Red Hat account to access the Developer Sandbox. Signing up does not require a credit card.
- The Red Hat OpenShift
occommand-line interface (CLI). - A Java development environment. In this article, we will use the Java 17 version of the application, but any of the other three versions (natively-compiled Java 11, JVM Java 11, or natively-compiled Java 17) would work the same.
The Quarkus Superheroes sample application
The Quarkus Superheroes application consists of several microservices which co-exist to form an extensive system. Some microservices communicate synchronously via REST. Others are event-driven, producing and consuming events to and from Apache Kafka. Some microservices are reactive, whereas others are traditional. All the microservices produce metrics consumed by Prometheus and export tracing information to OpenTelemetry. The source code for the application is on GitHub under an Apache 2.0 license.
Figure 2 shows the overall architecture of this application.

Detailed information about the application and its architecture can be found on the quarkus.io blog. One of the main requirements when building the application was that it should be simple to deploy on Kubernetes.
A Prometheus instance scrapes metrics from all of the application services. Additionally, all of the services export telemetry data to the OpenTelemetry Collector. The Collector, in turn, exports telemetry data to a Jaeger instance, where the data can be analyzed and visualized. The gRPC protocol is used for communication between the applications and the OpenTelemetry Collector and between the OpenTelemetry Collector and Jaeger.
Deploying the application on the OpenShift Sandbox
The OpenShift Sandbox provides a private OpenShift environment free for 30 days. It is in a shared, multi-tenant OpenShift cluster preconfigured with a set of developer tools. This private environment includes two projects (namespaces) and a resource quota of 7GB RAM and 15GB storage. The application's development and stage phases can be emulated using the two namespaces. All your Pods automatically scale to 0 after 12 hours.
The following subsections set you up to use the Sandbox.
Logging into the Sandbox
You can access your Developer Sandbox with your Red Hat account. Follow these instructions to log in. Don't worry if you haven't created a Red Hat account yet. The instructions will guide you through creating and verifying a new account.
NOTE: Follow only the six steps in the "Get access to the Developer Sandbox" section of the instructions.
Connecting your local machine to the Sandbox
Follow these instructions to download the OpenShift CLI and run oc login with the token from your sandbox. Then your terminal should be in the <your-username>-dev project.
NOTE: If you already have a Developer Sandbox account and have existing workloads in your project, you might need to delete those before deploying the Quarkus Superheroes application. The Developer Sandbox limits the resources deployed at a single time for each user.
Deploying the Quarkus Superheroes application
The deploy/k8s directory in the root of the application's GitHub repository contains Kubernetes descriptors for each of the four versions of the application: JVM 11, JVM 17, natively compiled with Java 11, and natively compiled with Java 17.
If you'd like, run git clone to download the code from the Quarkus Superheroes GitHub repository. However, cloning is not necessary because you can apply Kubernetes resources directly from remote locations.
Perform the following steps in your terminal to deploy the Java 17 version of the application container images and all the backing services. Wait for each step to complete before proceeding to the next one.
- Deploy the applications by executing:
oc apply -f https://raw.githubusercontent.com/quarkusio/quarkus-super-heroes/main/deploy/k8s/java17-openshift.yml - Deploy the monitoring stack by executing:
oc apply -f https://raw.githubusercontent.com/quarkusio/quarkus-super-heroes/main/deploy/k8s/monitoring-openshift.yml
That's it! Deploying the Superheroes is super simple! Once everything deploys, your browser should look something like Figure 3.

The system as deployed is not considered production-ready. The deployed resources (databases, Prometheus instance, OpenTelemetry Collector instance, Jaeger instance, Kafka broker, and schema registry) are not highly available and do not use Kubernetes operators for management or monitoring. They also use ephemeral storage.
Interacting with the application
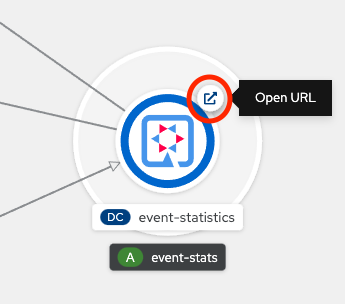
Open the event statistics user interface (UI) by clicking the icon in the upper right corner of the event-statistics application, shown in Figure 4.
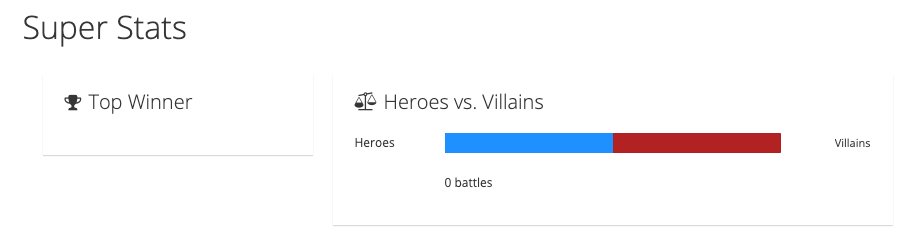
Once open, you should see the event statistics UI shown in Figure 5.
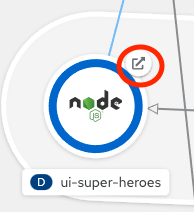
Similarly, open the Superheroes UI by clicking the icon in the upper right corner of the ui-super-heroes application, shown in Figure 6.
Once open, you should see the Superheroes UI, shown in Figure 7. The following are clickable areas highlighted in green in Figure 7 :
- Expand or collapse the list of a Hero's or Villain's powers
- Randomly select a new Hero and Villain for battle
- Perform a battle

Now you can perform a few battles with the same Hero and Villain and with different Heroes and Villains. Once you have completed a few battles, the table below the fighters displays a list of battles.
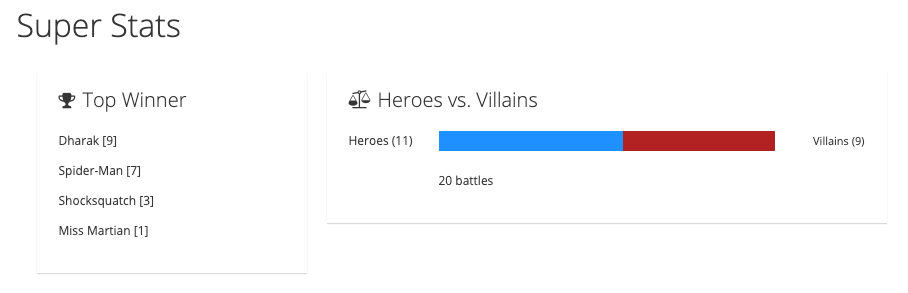
If you switch back to the event statistics UI, the slider should have moved or stayed in the middle if there were equal wins. There is also a list of the top ten winners and the number of wins for each team (see the example in Figure 8).
Analyzing telemetry data
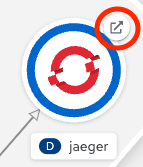
After performing a few battles, let's analyze the telemetry data. Open the Jaeger UI by clicking the icon in the upper right corner of the jaeger application, shown in Figure 9. Once open, you should see the Jaeger UI.
Analyzing requests for new fighters
First, let's analyze the traces generated when you requested new fighters. After you click the New Fighters button in the Superheroes UI, the browser makes an HTTP request to the /api/fights/randomfighters endpoint within the rest-fights application. These services and operations should already be available in the Jaeger UI.
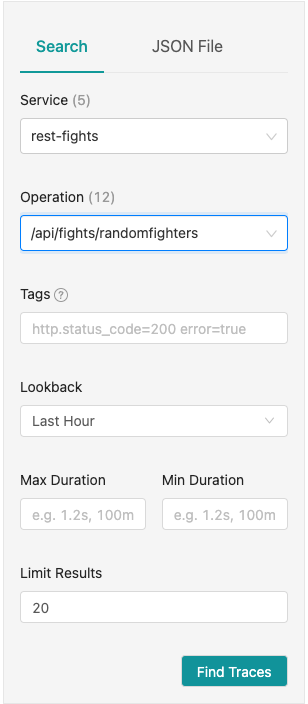
Next, in the Jaeger UI, select rest-fights for the Service and /api/fights/randomfighters for the Operation (see Figure 10).
Then click Find Traces.
A list of traces should appear on the right-hand side of the Jaeger UI, as shown in Figure 11.
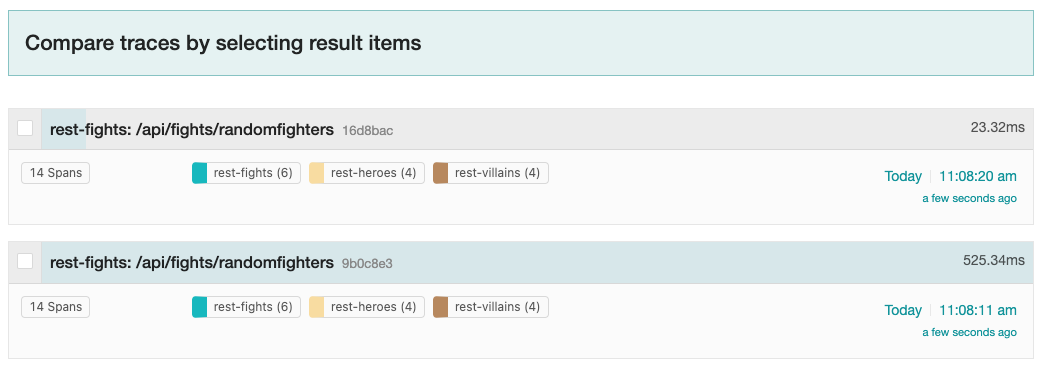
A trace consists of a series of spans. Each span is a time interval representing a unit of work. Spans can have parent/child relationships and form a hierarchy. Spans can also indicate the parallelization of work running concurrently.
The bottom of Figure 11 shows that each trace contains 14 total spans: 6 spans in the rest-fights application, 4 spans in the rest-heroes application, and 4 spans in the rest-villains application. Each trace also provides the total round-trip time of the request into the /api/fights/randomfighters endpoint within the rest-fights application and the total time spent within each unit of work.
Clicking on one of the traces will bring you to the trace timeline screen in Figure 12.
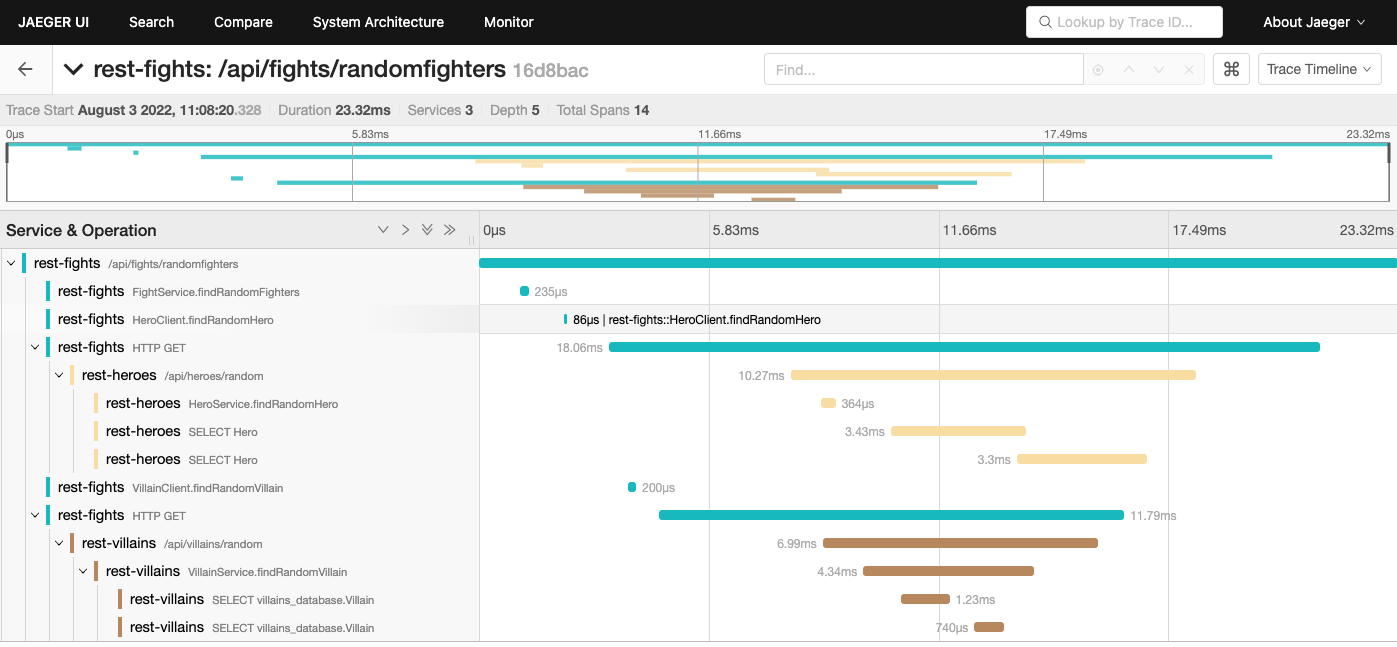
The trace timeline shows the hierarchy of requests, starting with the initial incoming request into the rest-fights application. The next few spans in rest-fights are operations within the rest-fights application. You can click on each span to get more information about the span, including any incoming method arguments or environment information at the time of the span.
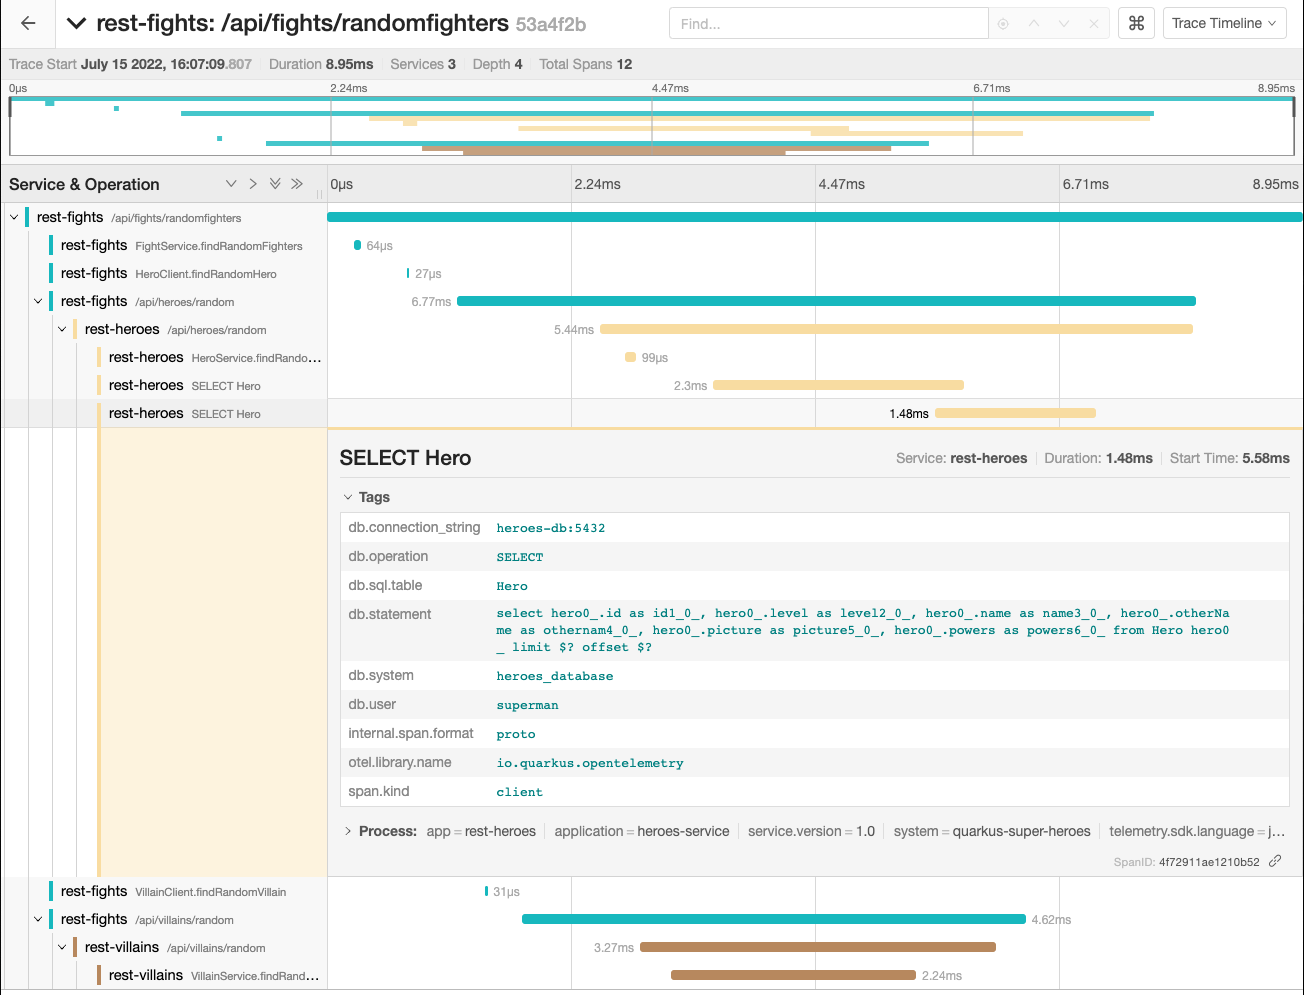
After that, the display shows outgoing HTTP calls from the rest-fights application to the rest-heroes and rest-villains applications called in parallel. The rest-heroes and rest-villains timelines even trace down to the database. For example, you can display the executed database query by clicking the second rest-heroes SELECT Hero or rest-villains SELECT villains_database.Villain span and expanding the tags (as shown in Figure 13).
Each application in the system manages its own sets of traces and spans. The rest-fights application sends trace context information on the HTTP request so that the rest-heroes and rest-villains applications can read it. This way, the complete trace information can be accurately correlated when the rest-fights, rest-heroes, and rest-villains applications export telemetry data to the OpenTelemetry Collector. The Collector then correlates and aggregates all the trace and span information and sends everything to Jaeger.
The Quarkus OpenTelemetry extension (integrated into all the applications in the system) handles the heavy lifting to make it work.
Analyzing fights
Next, let's analyze the traces when performing a fight:
- When you click the Fight button in the Superheroes UI, the browser makes an HTTP request to the
/api/fightsendpoint within therest-fightsapplication. These services and operations should already be available in the Jaeger UI. - Return to the main Jaeger UI by clicking JAEGER UI in the header at the top of the page.
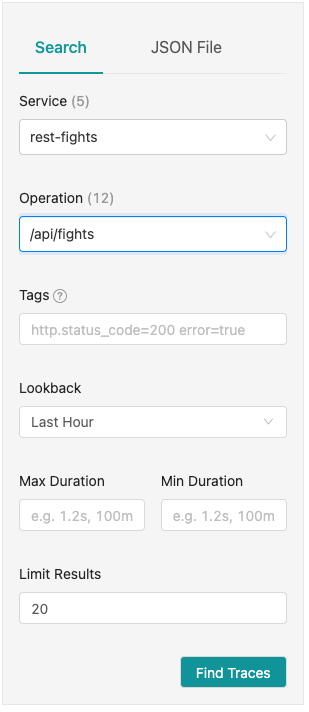
- Once you're back in the main Jaeger UI, select
rest-fightsfor the Service and/api/fightsfor the Operation (see Figure 14). - Then click Find Traces.
As before, a list of traces should appear on the right-hand side of the Jaeger UI as shown in Figure 15.
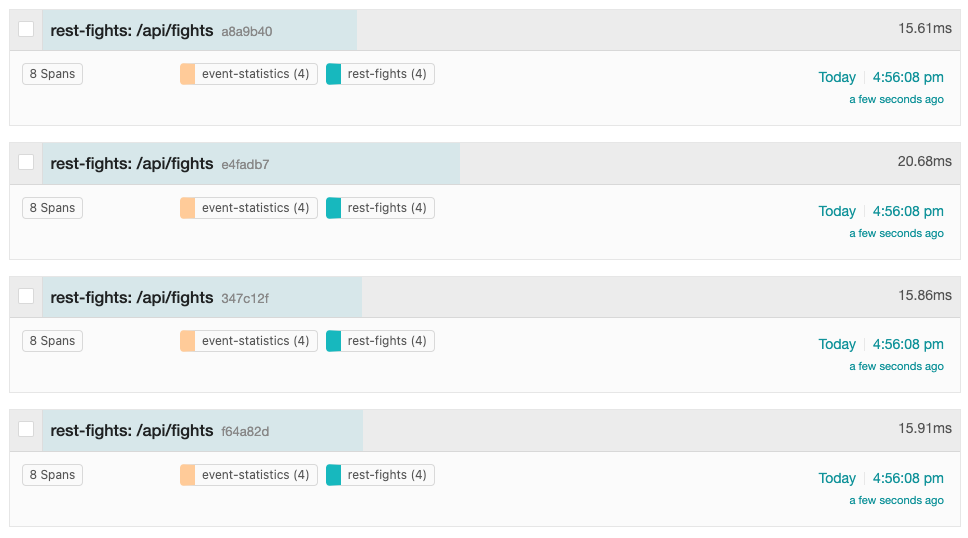
The display shows that each trace contains 8 total spans: 4 spans in the rest-fights application and 4 spans in the event-statistics application. Each trace provides the total round-trip time of the request into the /api/fights endpoint within the rest-fights application and the total time spent within each unit of work.
Clicking on one of the traces takes you to the trace timeline screen displayed in Figure 16.
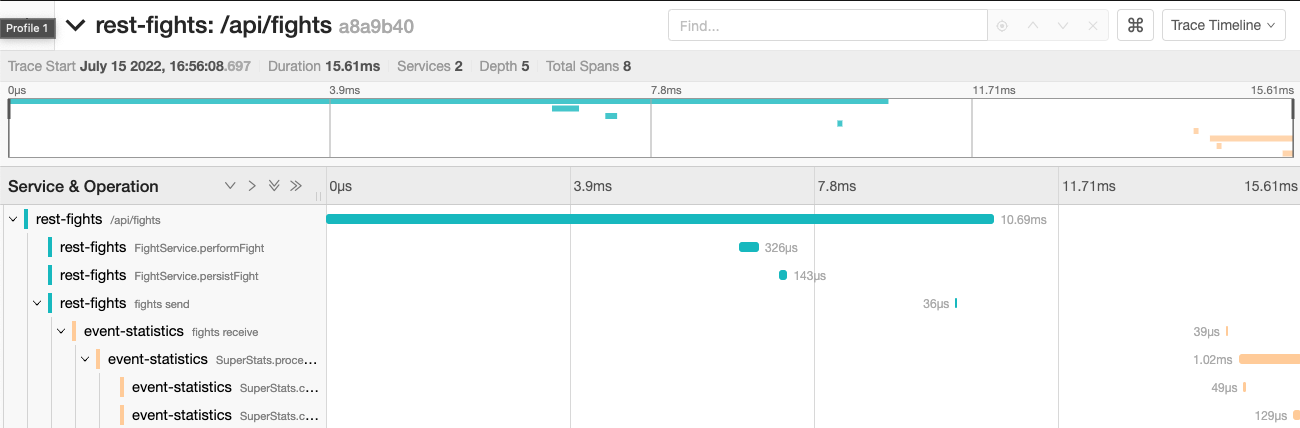
This trace timeline shows the hierarchy of requests, starting with the initial incoming request into the rest-fights application. The next few spans in rest-fights are operations within the rest-fights application. You can click on each span to get more information about the span, including any incoming method arguments or environment information at the time of the span.
After that, the display shows the rest-fights fights send span and the event-statistics fights receive child span. These spans are where the rest-fights application places a message on an Apache Kafka topic, and where the the events-statistics application consumes the message.
Trace context information is sent along with the message on the Kafka topic from the rest-fights application and subsequently read by the event-statistics application when it consumes the message. This way, OpenTelemetry accurately correlates the trace context information when the rest-fights and event-statistics applications export telemetry data to the OpenTelemetry Collector. The Collector then correlates and aggregates all the trace and span information and sends everything to Jaeger.
Similar to the previous section, if you click on a span and expand the tags, you can see additional information about each span.
Again, the Quarkus OpenTelemetry extension (integrated into all the applications in the system) handles the heavy lifting to make it work.
Quarkus and OpenTelemetry take you deep inside microservices
Applications today are becoming more and more complex. Typically, multiple applications work together in a distributed fashion to form a usable system. What happens when things don't quite work? What if the system slows down? How do you perform root cause analysis across distributed applications to determine what's going on?
Observability is paramount in these types of systems. It is an invaluable ability to look at distributed trace information to correlate traces and spans, log data, and metrics. This article demonstrated valuable telemetry data and tools to collect it.
Want to learn more about the Quarkus Superheroes? Check out these awesome resources:
- Quarkus Superheroes to the Rescue!
- Quarkus Superheroes GitHub repository
- Quarkus Superheroes: Managed services save the day
Want to know more about observability and OpenTelemetry? Check out these great articles:
- Observability in 2022: Why it matters and how OpenTelemetry can help
- Distributed tracing with OpenTelemetry, Knative, and Quarkus
- Quarkus OpenTelemetry guide
Finally, if you're new to Quarkus, take a look at some of these resources:
Last updated: September 19, 2023