Page
View performance information using the OpenShift web console
In this lesson, you will learn how to access and understand the available performance information within the Developer Sandbox.
What you need to know
In order to get full benefit from this lesson, you need to:
- Understand how Kubernetes is the foundational technology for OpenShift and the Developer Sandbox.
- Understand what a Kubernetes pod is at the architectural and operational levels.
- Know how to access the Developer Sandbox via a browser.
- Know how to use the Topology view within the web console to inspect applications and components running in the Developer Sandbox.
What you will learn
In this lesson, you will:
- Install a custom application from the command line that exerts pressure on different resources within the Developer Sandbox.
- Access a variety of metrics and graphs that describe performance information within the Developer Sandbox that's relevant to your application.
Being able to quantitatively observe an application running in OpenShift's performance behavior is important for both system administration and developers. An application that hogs resources can significantly affect the end-user experience.
Fortunately, the OpenShift web console publishes a good deal of performance statistics that are available right out of the box. All you need to do to access the information is to know where to look within the user interface (UI). The objective of this lesson is to show you one way to get to that information within the UI.
First, you will use the web console to install a demonstration application that hogs OpenShift resources. Then you will learn how to view information about the application’s performance using basic OpenShift reporting features.
Access the OpenShift web console
The following steps will show you how to access the OpenShift web console in the Developer Sandbox. You will do the work of installing the resource pressurizer application using the web console:
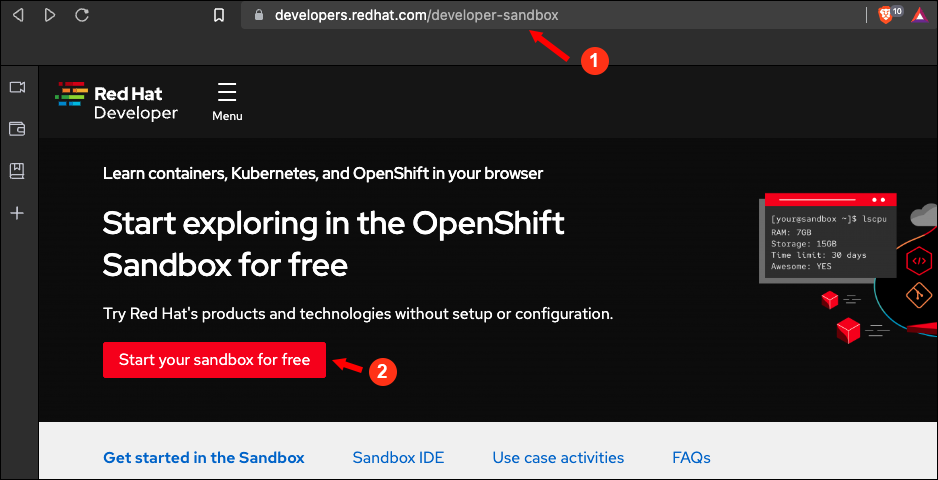
In your web browser, navigate here and select Start your sandbox for free (Figure 1).

Figure 1: The entry point for access to the Developer Sandbox for Red Hat OpenShift. Figure 1: The entry point for access to the Developer Sandbox. Provide the username and password for your Red Hat account (Figure 2).
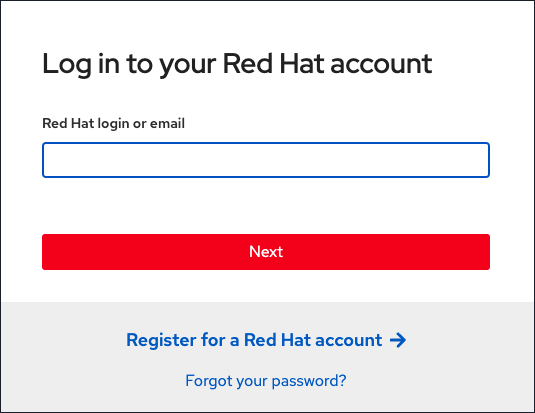
Figure 2: Log into the OpenShift web console with the username and password associated with your account on Red Hat.

Install the demonstration application
The following steps will show you how to install the Node.js demonstration application into the Developer Sandbox. You will install from the command line, using the web console’s Web Terminal feature.
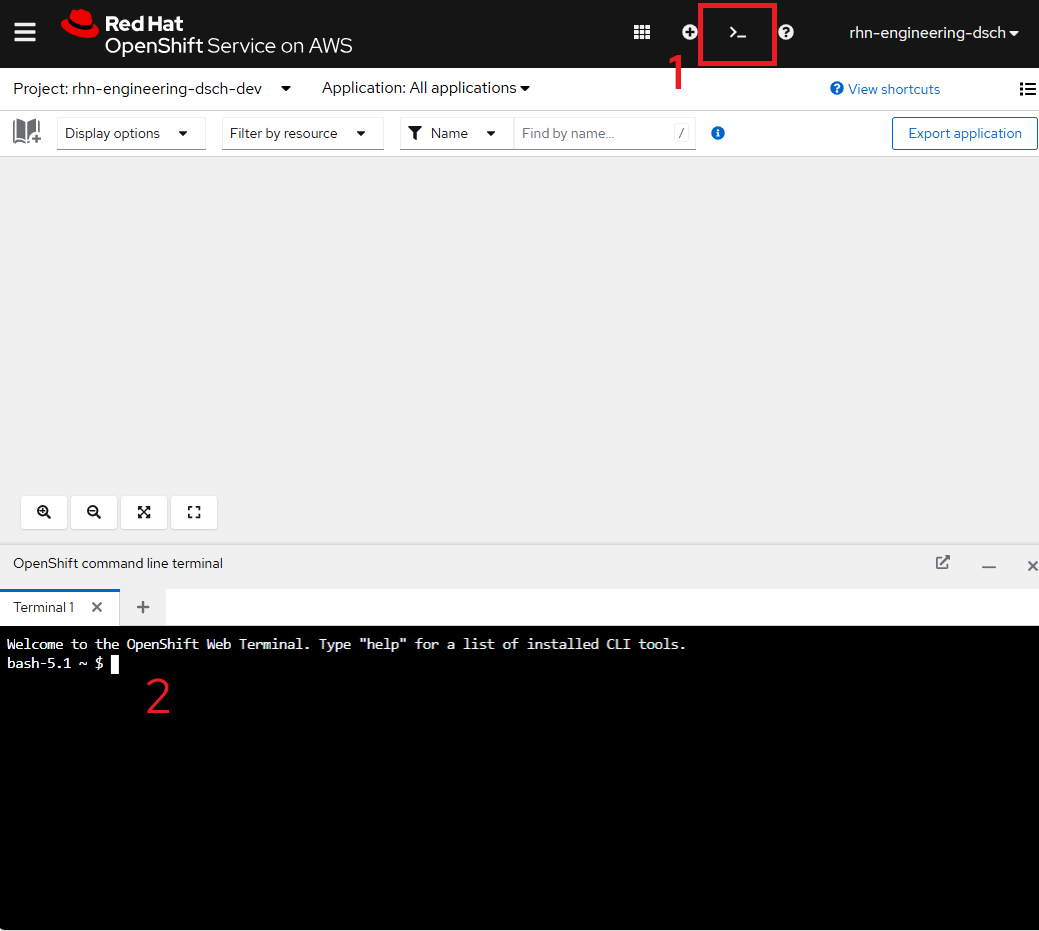
Click the Web Terminal icon in the upper right part of the web console (Figure 3, Callout 1). The web terminal will open in the bottom part of the screen (Figure 3, Callout 2).
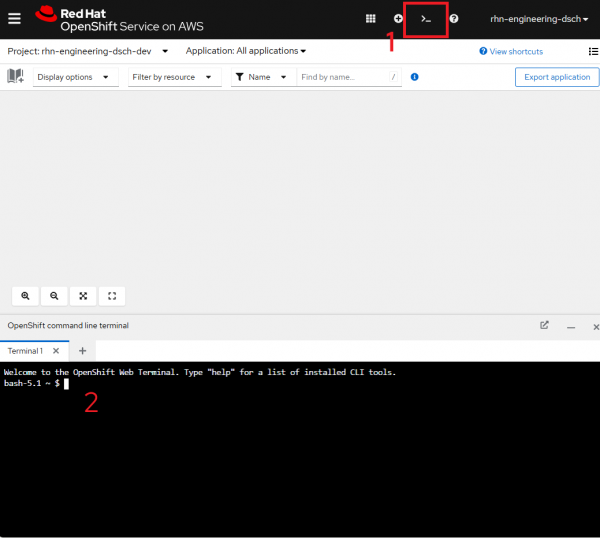
Figure 3: Open the web terminal. Type the following command at the command prompt, then press Enter:
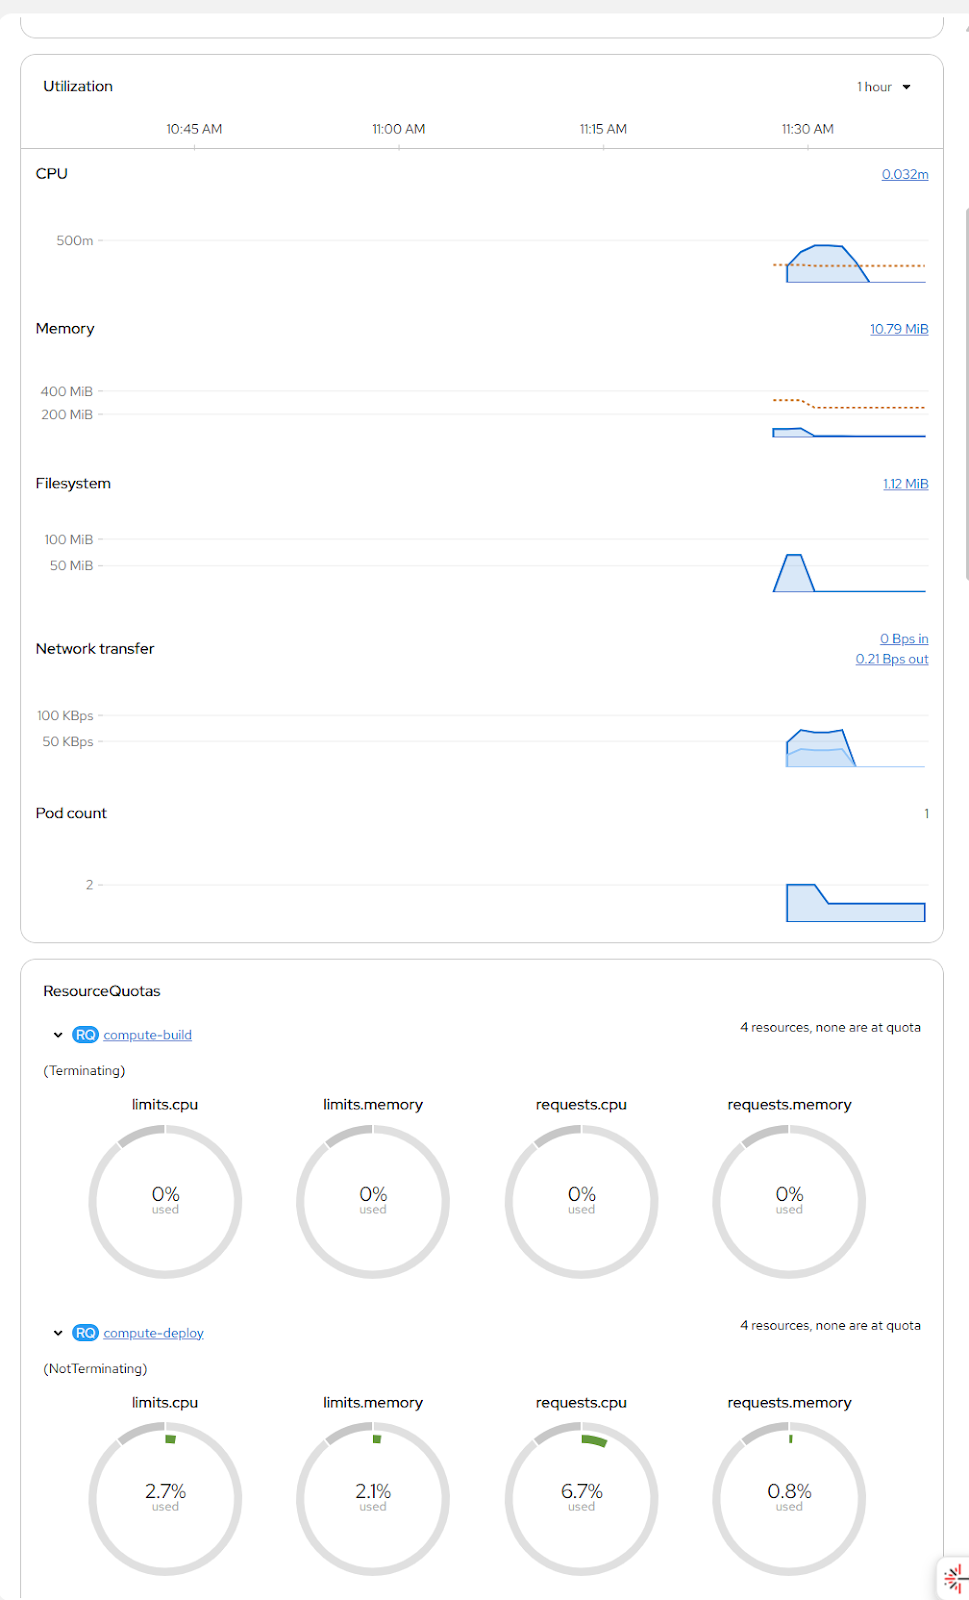
oc create -f https://raw.githubusercontent.com/redhat-developer-demos/resource_pressurizer/refs/heads/main/rpjob.yamlThis will launch a Kubernetes job in your cluster. We're using a job because after it's finished, it stops running. If you simply launch an application that self-terminates, Kubernetes will see that the pod has stopped and will replace it with a new, running, pod. We want to be good citizens of Developer Sandbox and limit our Resource Pressurizer application, so a job is used. The job will spend 90 seconds using both network and CPU resources. After 90 seconds, the network traffic will stop, but the CPU (and file system) usage will continue for another 90 seconds.
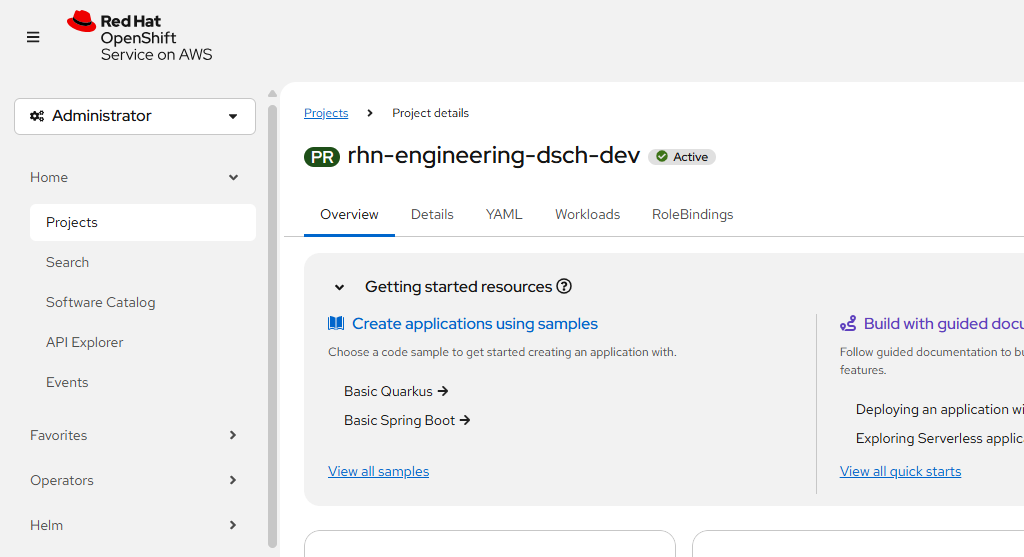
To continue, choose the Projects option from the menu on the left, then click on the project name to view the project details. (Figure 4).
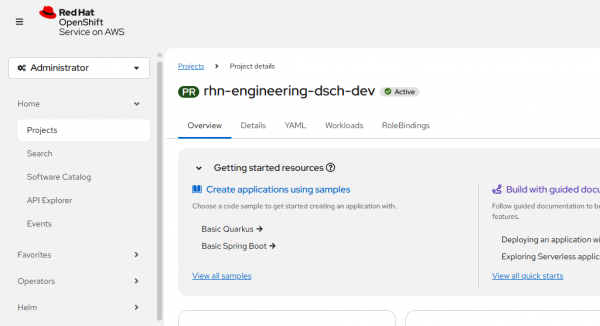
Figure 4: Observe your cluster from the web console. Next, simply scroll down the project details to see performance data. (Figure 5).
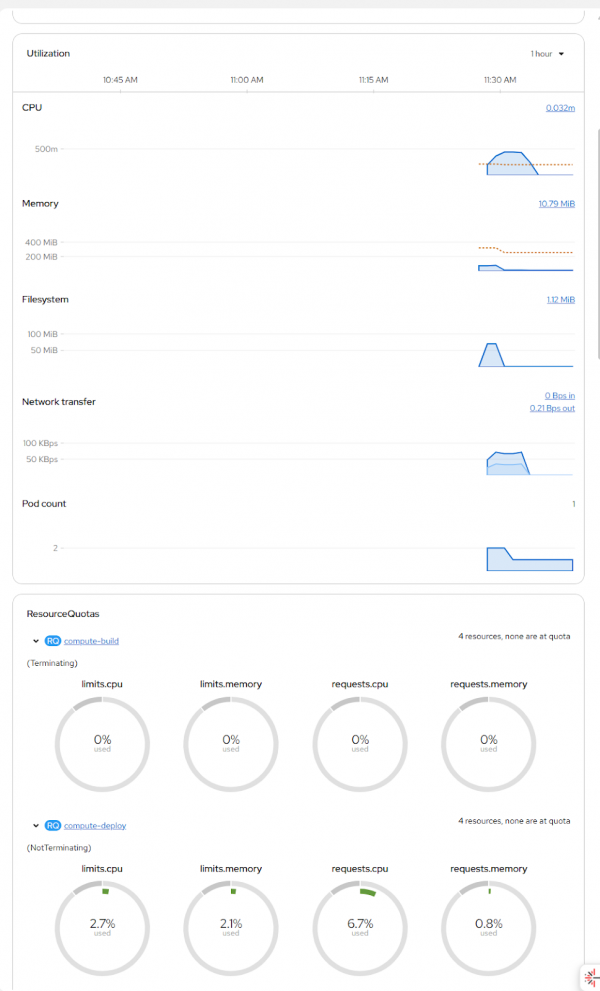
Figure 5: Select what you want to observe.
Summary
In this lesson, you learned how to use the web console to access the graphs and tables that display the performance metrics for a custom application.
Once in the details page, you then learned how to see the graphs and tables associated with the performance metrics available in the web console.
Next
This is the last of the lessons in the Foundation of OpenShift series. But there’s still more to learn. Try out our other Developer Sandbox activities, and our other learning paths to build more OpenShift skills!
You can also use OpenShift in the public cloud. To learn how to use Red Hat OpenShift Service on AWS, visit our Red Hat OpenShift Service on AWS (ROSA) learning hub.