In this in-depth article, you're going to learn how to build an end-to-end reactive stream processing application using Apache Kafka as an event streaming platform, Quarkus for your backend, and a frontend written in Angular. In the end, you'll deploy all three containerized applications on the Developer Sandbox for Red Hat OpenShift.
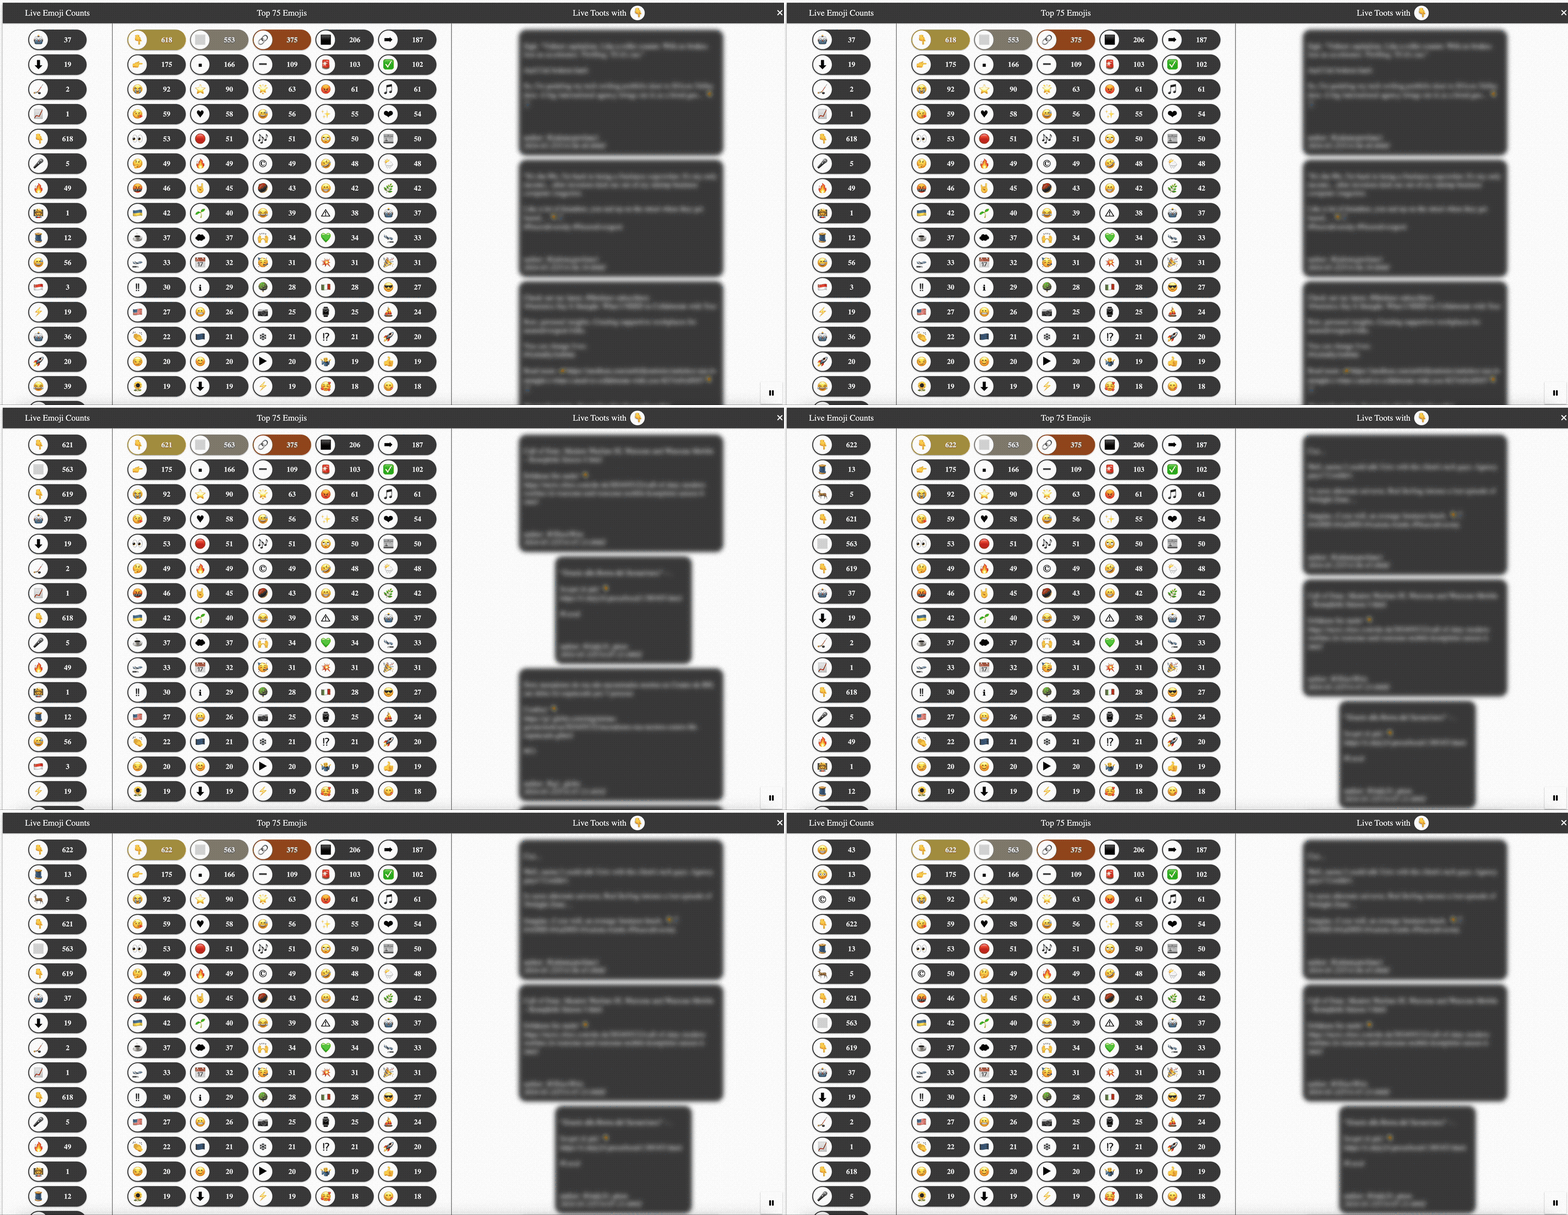
A first look at the final result—a colorful live dashboard tracking the usage of emojis in public 🐘 Mastodon 🐘 posts (a.k.a., toots)—should give you a rough idea of what you may expect throughout this article. See Figure 1.

Let's dive right in.
Developer Sandbox for Red Hat OpenShift
All applications which are part of the complete demo scenario are supposed to get deployed as containers on Red Hat OpenShift. Thus, as preparation, the next step is to make sure you have access to a Red Hat OpenShift cluster.
You can conveniently start by provisioning a Developer Sandbox for Red Hat OpenShift which is a freely available shared cluster for development purposes. By default, it is active over a period of 30 days, and it provides many pre-configured tools and services which go well beyond of what's needed in the context of this article.
- Get started here.
- On that page, click the red button labeled Start your sandbox for free.
- Next, you will be redirected to the log in page where you can either use your existing Red Hat account credentials or create a new account.
- For new accounts, you are asked to verify the specified email address.
- After the email address verification you are ready to log in.
- Once you are logged in, you are redirected to the Red Hat Hybrid Cloud Console and should find yourself on the landing page for the Developer Sandbox where you can continue by clicking the blue Get started button.
- A few moments later you should see a pop-up informing you about the successful sandbox activation.
- The next page now shows three available services and to start your sandbox, click the blue Launch button for Red Hat OpenShift which is the first (i.e,. left-most) tile in the UI.
- Finally, you should end up directly in the web console of your OpenShift cluster (Figure 2).

Applications of the demo scenario
With your Developer Sandbox development cluster up and running, let's briefly visit the three custom applications which will be deployed as part of this end-to-end reactive demo scenario:
- Toots Harvester: a Quarkus-based Java application which is used to fetch and store a live stream of publicly available toots from the Mastodon API.
- Emoji Tracker: another Quarkus application using the built-in extension for Kafka Streams to define a stream processing topology needed to extract and continuously count emojis within Mastodon toots. Also it provides a reactive WebAPI to perform so-called interactive queries against the RocksDB-backed state store managed by Kafka Streams.
- Emoji Dashboard: a single-page application (SPA) written in Angular which shows a live dashboard of the main data processing that is happening in the Emoji Tracker application. The SPA consumes point-in-time data as well as live data feeds over server-sent events from the Emoji Tracker's WebAPI.
The GitHub repository hosting all the source code as well as the Kubernetes deployment manifests can be found here.
At the heart of this demo scenario lies Apache Kafka, which is used as an event streaming platform to store all necessary data (i.e., Mastodon toots) into Kafka topics. In addition to the raw and transformed data, any state resulting from the stateful stream processing application is also kept in dedicated Kafka topics for reasons of fault tolerance.
In case this TL;DR version of the featured applications is enough for you to know, feel free to directly jump to the OpenShift-based deployment of the whole demo scenario. Otherwise, read on to dig a little bit deeper into selected parts of each of the three applications.
Toots harvester
This Quarkus application acts as a websocket client towards the Mastodon API and consumes a stream of publicly available toots. The application uses SmallRye Reactive Messaging for Kafka to write JSON serialized representations of these Mastodon posts into a Kafka topic named live-toots.
Here is a source listing of the TootsProducer class which produces all collected toots from the Mastodon API straight into the configured Kafka topic:
@ApplicationScoped
public class TootsProducer {

 private static final Jsonb JSONB = JsonbBuilder.create();

 @ConfigProperty(name="kafka.bootstrap.servers")
 String kafkaBootstrapServers;

 @ConfigProperty(name="tootsharvester.toots.topic.name")
 String topicName;

 @ConfigProperty(name="tootsharvester.toots.topic.partitions")
 int topicPartitions;

 @PostConstruct
 void kafkaTopicInit() {
   /* ... */
 }

 @Inject
 @Channel("live-toots")
 Emitter<Record<Long,String>> emitter;

 public void sendToot(Toot toot) {
   if(toot != null) {
     emitter.send(Record.of(toot.id(),JSONB.toJson(toot)));
   }
 }

}
Each of the Mastodon toots is represented by the corresponding Toot record:
public record Toot(
   long id,
   String created_at,
   String language,
   String content,
   String url,
   Account account
) {}
Note that the field names and data types are chosen purposefully in this way to directly match a relevant subset of the actual JSON representation of a real toot as given by the official Mastodon API.
This is what an exemplary fake toot might look like:
{
 "id": 8868861362651800917,
 "content": "lorem ipsum dolor ⛱ sit amet consetetur 💖 sadipscing elitr sed diam nonumy eirmod tempor invidunt ut labore et dolore 🎅🎅 magna aliquyam erat sed diam voluptua at vero eos et accusam et justo duo dolores et ea 🔋 rebum stet clita kasd gubergren no sea 🔋 takimata sanctus 🔋 est lorem ipsum dolor sit amet",
 "created_at": "2024-05-22T15:02:05.900+02:00",
 "url": "https://...",
 "account": {
   "bot": false,
   "followers_count": 0,
   "following_count": 0,
   "id": 2583029651755834998,
   "statuses_count": 0,
   "url": "https://...",
   "username": "some-username"
 }
}
Emojis tracker
The second Quarkus application of the demo scenario consumes records from the live-toots Kafka topic. Its main purpose is to define a Kafka Streams processing topology to perform both, stateless as well as stateful computations over consumed records.
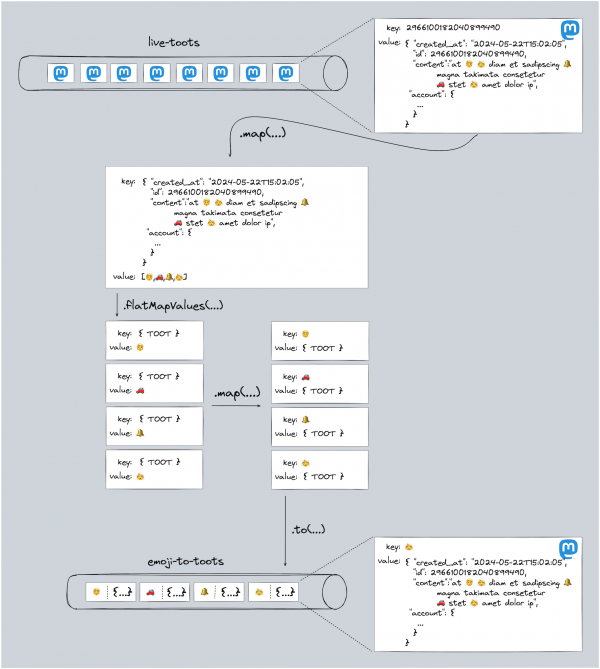
Let's start with the stateless processing first, during which for each unique emoji that occurs in a toot, a new record—composed of the emoji as key and the toot itself as value—gets written into a separate KafKa topic named emoji-to-toots.
The code for this part of the application based on the KStreams DSL and its fluent API might look as follows:
toots.map((id,toot) -> KeyValue.pair(toot,new LinkedHashSet<>(EmojiUtils.extractEmojisAsString(toot.content()))))
       .flatMapValues(uniqueEmojis -> uniqueEmojis)
       .map((toot,emoji) -> KeyValue.pair(emoji, JsonbBuilder.create().toJson(toot)))
       .to(topicNameEmojiToToots, Produced.with(Serdes.String(),Serdes.String()));
Figure 3 shows what's happening here.

Next, let's discuss the core functionality of this topology. It's about stateful counting of all emojis which occur in the toots. For that purpose, the topology:
- Extracts from the record's value a list of contained emojis found in the toot's text.
- Flatmaps the record value holding this list of emojis.
- Maps records such that they contain the corresponding emoji as the records' key.
- Groups and counts records per key, thus per contained emoji.
Like before, the KStreams DSL is very convenient to define this part of the processing topology. The code snippet below is one way to write this:
KTable<String, Long> emojiCounts = toots
       .map((id,toot) -> KeyValue.pair(id,EmojiUtils.extractEmojisAsString(toot.content())))
       .flatMapValues(emojis -> emojis)
       .map((id,emoji) -> KeyValue.pair(emoji,""))
       .groupByKey(Grouped.with(Serdes.String(), Serdes.String()))
       .count(Materialized.as(stateStoreSupplier(stateStoreType, stateStoreNameEmojiCounts)));
Figure 4 depicts how a single Kafka record is processed and what happens during each of the above mentioned steps.

The result of this is a so-called KTable. For each unique key, this KTable stores a row with the most recently seen or computed value. Every time there is a new value for an existing key, the corresponding row in the KTable is updated, while for records with previously unseen keys new rows are inserted. In the context of our demo application this means for each unique emoji which was processed so far, the KTable stores the most up-to-date number of occurrences resulting from the group and count operation. In other words, this KTable represents a continuously updated materialized view of the stateful operation—total counting in this case. The state itself is backed by a state store which is local to the processing instance. Additionally, there is a dedicated Kafka topic, a so-called changelog topic, to persist state changes on the brokers for reasons of fault-tolerance. So in case a Kafka Streams application crashes, another instance can be started to first restore the persisted state and then resume with the data processing.
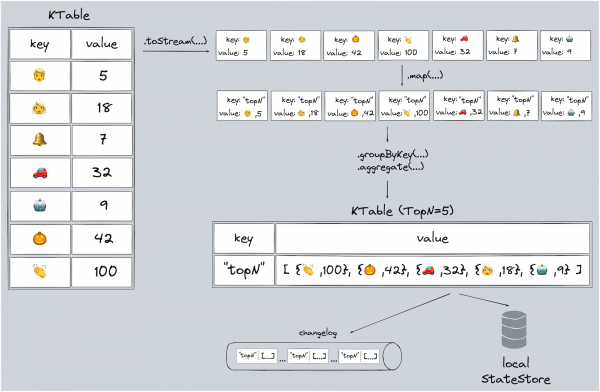
The last part of this KStreams application deals with computing and continuously updating the top N in order to know which emojis have the highest number of occurrence at any given point in time. For that, it's one option to directly build upon a previous part of the stream processing topology, namely the stateful computation of emojis and their respective counts. What's essentially needed is another aggregation across all computed emoji counts. This can be achieved by grouping all entries of the KTable and maintaining a custom aggregate that stores all emojis with their counts in a data structure sorted in descending order. See Figure 5.
KTable<String, TopEmojis> mostFrequent = emojiCounts.toStream()
       .map((e, cnt) -> KeyValue.pair(TOP_N_RECORD_KEY, new EmojiCount(e, cnt)))
       .groupByKey(Grouped.with(Serdes.String(), countSerde))
       .aggregate(
           () -> new TopEmojis(emojiCountTopN),
           (key, emojiCount, topEmojis) -> topEmojis.add(emojiCount),
           Materialized.<String, TopEmojis>as(stateStoreSupplier(stateStoreType, stateStoreNameEmojisTopN))
               .withKeySerde(Serdes.String())
               .withValueSerde(topNSerde)
       );
Furthermore, the Quarkus application offers a reactive web API based on Quarkus REST and SmallRye Mutiny. It exposes a few HTTP endpoints to perform point-in-time requests against the internally managed state of the Kafka Streams application. Additionally, there are two endpoints from which clients can retrieve live data feeds by consuming the respective server-sent events.
 @GET
 @Path("emojis/{code}")
 @Produces(MediaType.APPLICATION_JSON)
 public Uni<EmojiCount> getEmojiCount(@PathParam("code") String code) {
   return service.querySingleEmojiCount(code);
 }

 @GET
 @Path("emojis")
 @Produces(MediaType.APPLICATION_JSON)
 public Multi<EmojiCount> getEmojiCounts() {
   return service.queryAllEmojiCounts();
 }

 @GET
 @Path("local/emojis")
 @Produces(MediaType.APPLICATION_JSON)
 public Multi<EmojiCount> getEmojiCountsLocal() {
   return service.queryLocalEmojiCounts();
 }

 @GET
 @Path("emojis/stats/topN")
 @Produces(MediaType.APPLICATION_JSON)
 public Uni<Set<EmojiCount>> getEmojisTopN() {
   return service.queryEmojisTopN();
 }

 @GET
 @Path("emojis/updates/notify")
 @Produces(MediaType.SERVER_SENT_EVENTS)
 @SseElementType(MediaType.APPLICATION_JSON)
 public Multi<EmojiCount> getEmojiCountsStream() {
   return emojiCountsStream
       .invoke(ec -> Log.debugv("SSE to client {0}",ec.toString()));
 }

 @GET
 @Path("emojis/{code}/toots")
 @Produces(MediaType.SERVER_SENT_EVENTS)
 @SseElementType(MediaType.TEXT_PLAIN)
 public Multi<String> getEmojiTootsStream(@PathParam("code") String code) {
   return emojiTootsStream
       .filter(t2 -> t2.getItem1().equals(code))
       .map(t2 -> JSONB.toJson(t2))
       .invoke(s -> Log.debugv("SSE to client {0}",s));
 }
The EmojisQueryAPI class uses a StateStoreService. This service wraps the interactive query mechanism, thus handling external read access for the internally managed state by Kafka Streams. Since Kafka Streams applications can be scaled out horizontally, the full application state is typically spread across multiple instances. Thus, a client querying a particular part of the state might well hit an instance which isn't in charge of the queried state. Based on the Kafka Streams metadata, the StateStoreService does all the routing to other instances of the application automatically whenever needed.
The following method shows one such example, namely, how the StateStoreService handles an interactive query to read the current count for any specific emoji code:
public Uni<EmojiCount> querySingleEmojiCount(String code) {
   try {
     KeyQueryMetadata metadata = kafkaStreams.queryMetadataForKey(
         stateStoreNameEmojiCounts, code, Serdes.String().serializer());
     LOGGER.debugv("kstreams metadata {0}",metadata.toString());

     if(myself.equals(metadata.activeHost())) {
       ReadOnlyKeyValueStore<String,Long> kvStoreEmojiCounts =
           kafkaStreams.store(StoreQueryParameters.fromNameAndType(
               stateStoreNameEmojiCounts, QueryableStoreTypes.keyValueStore())
           );
       LOGGER.debugv("state store for emoji {0} is locally available",code);
       Long count = kvStoreEmojiCounts.get(code);
       return Uni.createFrom().item(new EmojiCount(code, count != null ? count : 0L));
     }

     var remoteURL = String.format(webApiUrlPattern,
         metadata.activeHost().host(),metadata.activeHost().port(),"emojis/"+URLEncoder.encode(code, StandardCharsets.UTF_8.name()));

     LOGGER.debugv("state store for emoji code NOT locally available thus fetching from other kstreams instance @ {0}",remoteURL);
     return doEmojiApiGetRequest(remoteURL).onItem()
             .transform(response -> response.bodyAsJson(EmojiCount.class));
   } catch (Exception exc) {
     LOGGER.error(exc.getMessage());
     return Uni.createFrom().failure(exc);
   }
 }
First, it derives the metadata for the key-based query using the state store's name and the key (emoji code) in question. Second, the method checks whether or not the active host for this key is the instance which is also processing the request. If so, the current count for the emoji code can be directly read from the local state store of this instance. If not, the remote instance which is in charge of this key is queried instead based on the same web API in order to fetch the count from the remote instance's local state store. The bottom line is, that clients do not need to know—in fact they shouldn't care—about how the application state is partitioned across several instances.
This concludes the discussion of the main parts of the Emoji Tracker. Now, it's time to briefly look at the client side to understand how the web UI interacts with this Quarkus application.
Emoji dashboard
A single-page application (SPA) written in Angular serves as a live dashboard to visualize the main processing within the Quarkus-based Kafka Streams application. For that, it calls different web API endpoints of the Emojis Tracker application. As shown in the animation in Figure 1 further above, the user interface consists of 3 sections:
- On the left, a live changelog reflecting all the counter changes for every extracted and processed emoji is shown. For this, the SPA consumes the
api/emojis/updates/notifySSE endpoint. - In the middle, the top N (e.g., N=75) emojis with the highest occurrences are depicted. This is done by first doing a point-in-time query against the top N emojis state using the
emojis/stats/topNAPI endpoint and then maintaining the counters locally based on the retrieved changelog stream. - On the right, after clicking on any emoji—either in the changelog or from the top N—a stream of toots containing the emoji in question and potentially additional ones is consumed. For this the SPA calls out to the
emojis/{code}/tootsSSE endpoint. The filtering for matching toots happens on the server-side.
OpenShift deployment
Artifacts
There is no need to build the three applications from sources and generate container images for them. For each application Toots Harvester, Emoji Tracker, and Emoji Dashboard, turn-key ready images have been published to Red Hat's Quay Container Registry. All three images are pre-configured in the YAML definitions for the OpenShift deployment.
Kubernetes resources and Kustomize
The deployment definitions describing all Kubernetes resources are written based on Kustomize. This is useful and helps to keep all common parts of the resource definitions (the base) separate from those that have to be modified (the overlays) due to different environment and configuration settings.
All YAML definitions in the base folder aren't supposed to be touched since they represent the invariable parts of the Kubernetes resources. Therefore, any necessary configuration changes for deploying the complete demo scenario are done based on one specific overlay—named demo in this case—which can be found as a separate sub-folder in overlays/demo. The overlay YAML definitions contain only those fragments which select the corresponding Kubernetes resources from the base definitions that need changes together with the actual patches that should get applied by Kustomize.
The configuration for the demo overlay itself is defined in overlays/demo/kustomization.yaml. Within that file, all necessary settings are configured such that Kustomize can successfully patch the YAML definitions found in the base folder with the specific demo overlay settings.
So all that's necessary is to update a single file, namely overlays/demo/kustomization.yaml. In that file you have to set your environment specific values by replacing all literals defined by the configMapGenerator (i.e., MY_NAMESPACE and MY_SANDBOX_ID) as well as the literals defined by the secretGenerator (i.e., access-token). Based on that, Kustomize will generate all YAML which describes the needed Kubernetes manifests for each component of this demo scenario.
Make sure all configuration settings have been correctly updated in the file overlays/demo/kustomization.yaml to meet your individual environment. Finally, to bring up the complete demo scenario on OpenShift, log in to your Developer Sandbox using oc login before running oc apply -k kustomize/overlays/demo. This should result in the creation of all required Kubernetes resources:
configmap/my-demo-config created
secret/mastodon-api created
service/kafka created
service/ng-emoji-dashboard created
service/quarkus-kafka-toots-harvester created
service/quarkus-kstreams-emoji-tracker created
deployment.apps/kafka created
deployment.apps/ng-emoji-dashboard created
deployment.apps/quarkus-kafka-toots-harvester created
statefulset.apps/quarkus-kstreams-emoji-tracker created
route.route.openshift.io/ng-emoji-dashboard created
route.route.openshift.io/quarkus-kstreams-emoji-tracker created
Note:
In case you face issues during Kustomize's YAML pre-processing chances are that the Kustomize bundled with your version of kubectl or oc is too old. If so, you could first upgrade your kubectl or oc version and then try again or you could install a recent standalone version of kustomize to generate the deployment YAML into a separate file upfront and then run it through your existing versions of kubectl or oc.
OpenShift Topology view
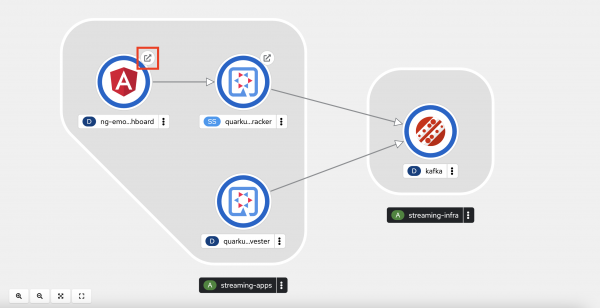
After having successfully created all Kubernetes resources according to the YAML definitions generated by Kustomize, the topology view of the OpenShift web UI should converge after a while and show a running deployment similar to the one in Figure 6.

With that, let's quickly walk through the main resources which have been deployed here.
ConfigMap & Secrets
There is one ConfigMap holding 2 entries (Figure 7).

They are referenced from other YAML manifests in the deployment.
Furthermore, one explicitly defined Secret has been setup storing the Mastodon API access token (Figure 8).

Deployments
There are the following three Kubernetes Deployments representing Kafka, the Toots Harvester, and Emoji Dashboard applications, as shown in Figure 9.

StatefulSet & PersistentVolumeClaim
Since the Emojis Tracker is a stateful Kafka Streams application, it is deployed as StatefulSet which relies on a PersistentVolumeClaim in order not to loose state e.g., in case pods crash and need to be restarted. See Figures 10 and 11.


Services
In total there are four Services, one for each of the three deployments and another one for the stateful set (Figure 12).

All services are of type "cluster IP", hence, they are only accessible within the OpenShift cluster.
Routes
Since all defined Services are internal to the cluster, there are Routes defined which provide public URL-based access for two of the running applications based on their corresponding services (Figure 13).

Accessing the Live Dashboard
To browse the Angular-based Live Dashboard SPA, you can just open the URL location specified in the respective Route. It follows this pattern:
http://ng-emoji-dashboard-<YOUR_NAMESPACE><YOUR_SANDBOX_ID>
In the OpenShift web UI topology view you can simply click the Open URL link symbol to follow the respective Route. See Figure 14.

Summary
In this article you've learned how to deploy and run end-to-end reactive stream processing applications on top of OpenShift. Along the lines, you've been introduced to a few fundamental concepts behind an Apache Kafka-based stateful stream processing application written with Quarkus' built-in support for Kafka Streams. Check out the GitHub repository hosting all the source code as well as the Kubernetes deployment manifests.
As always... happy stream processing 🤓!
