Initial support for native memory tracking (NMT) has recently been added as a feature to GraalVM Native Image. It is currently available in the GraalVM for JDK 23 release. The addition of NMT will allow users of Native Image to better understand how their applications are using off-heap memory.
Background
The terminology “native memory” is sometimes used interchangeably with “off-heap memory” or “unmanaged memory.” When a Java application is run on the JVM, "native memory" refers to any memory not allocated on the Java heap. Since the the JVM is implemented in C++, this includes the memory that the JVM uses under the hood for its internal operations as well as memory requested with Unsafe#allocateMemory(long), or from external libraries.
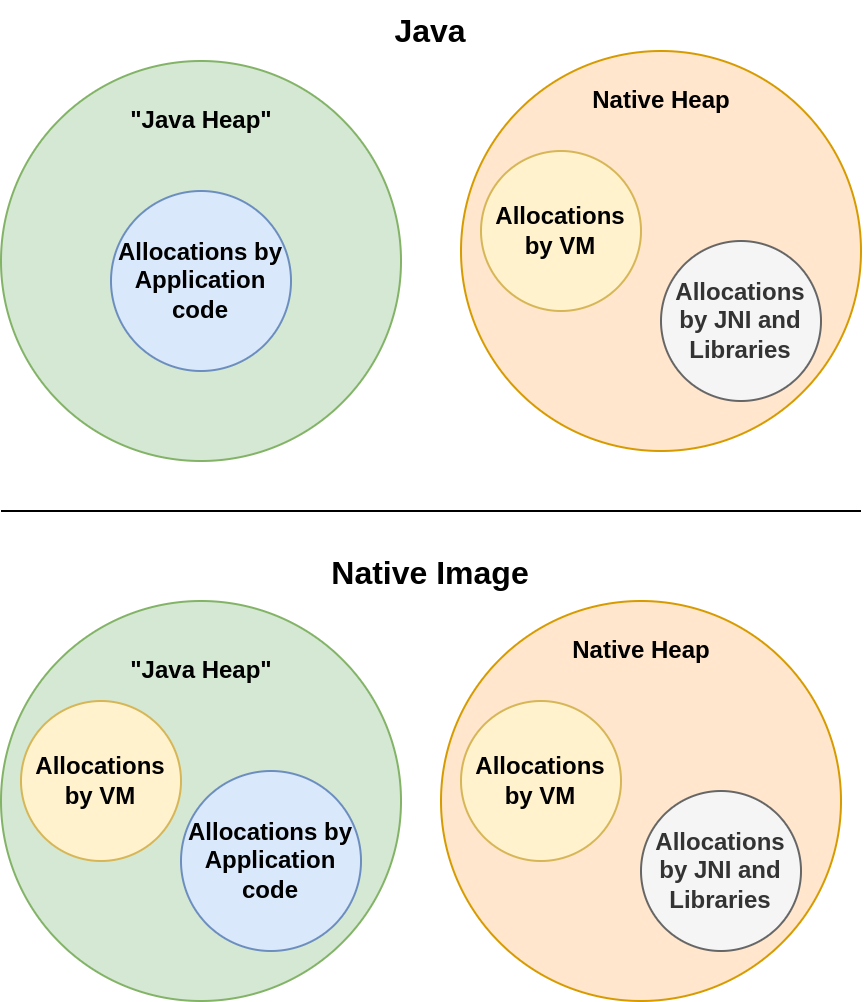
In contrast, when that same application is deployed as a Native Image executable, the VM (SubstrateVM) is implemented in Java, not C++. Unlike Hotspot, this means that much of the memory used internally by the VM is allocated on the “Java heap” alongside memory requested at the application level. There are places in SubstrateVM, however, that use unmanaged memory not on the “Java heap”. It is the goal of NMT in Native Image to track these usages.
Figure 1 depicts a high-level illustration of where allocations are made.

Use case
One major reason that NMT is useful is because it exposes memory information that is invisible to Java heap dumps. For example, imagine that the resident set size (RSS) of your application is far above the expected value. You generate and inspect a heap dump, but do not find anything that could explain the high RSS. This might indicate that native memory is the culprit. But what exactly is causing the unexpected native memory usage? Has a change to your application code done something to influence native memory usage? Or maybe there has been a change to GraalVM’s runtime components in SubstrateVM? Without NMT, it is hard to determine what is happening.
Since Native Image’s runtime components, SubstrateVM, use memory on the “Java heap,” much of the memory usage at the VM level can be exposed through heap dumps. This makes heap dumps in some ways more informative in Native Image than in regular Java. However, as previously mentioned, SubstrateVM still uses unmanaged memory for a significant amount of its operations. Some examples include garbage collection and JDK Flight Recorder.
Comparatively slow Native Image build times cause most developers do the bulk of the development and testing in regular Java. But what if performance is significantly different when switching to native mode? NMT may be especially useful when comparing such differences between running your application in regular Java and Native Image. This is because the underlying VM in Native Image is quite different from Hotspot and may result in very different resource consumption even with identical Java application code. NMT can help you understand what is going on in such situations and so you can optimize your code for native execution.
Getting started with NMT in Native Image
You can use NMT in your Native Image executable by including the feature at build time with --enable-monitoring=nmt. By default NMT is not included in the image build. Once NMT is included at build time, it will always be enabled at runtime.
$ native-image --enable-monitoring=nmt MyAppAdding -XX:+PrintNMTStatistics at runtime will result in receiving an NMT report dumped to standard output upon program shutdown.
$./myapp -XX:+PrintNMTStatisticsThe dumped report looks like this:
Native memory tracking
  Peak total used memory: 13632010 bytes
  Total alive allocations at peak usage: 1414
  Total used memory: 2125896 bytes
  Total alive allocations: 48
  Compiler peak used memory: 0 bytes
  Compiler alive allocations at peak: 0
  Compiler currently used memory: 0 bytes
  Compiler currently alive allocations: 0
  Code peak used memory: 0 bytes
  Code alive allocations at peak: 0
  Code currently used memory: 0 bytes
  Code currently alive allocations: 0
  GC peak used memory: 0 bytes
  GC alive allocations at peak: 0
  GC currently used memory: 0 bytes
  GC currently alive allocations: 0
  Heap Dump peak used memory: 0 bytes
  Heap Dump alive allocations at peak: 0
  Heap Dump currently used memory: 0 bytes
  Heap Dump currently alive allocations: 0
  JFR peak used memory: 11295082 bytes
  JFR alive allocations at peak: 1327
  JFR currently used memory: 24720 bytes
  JFR currently alive allocations: 3
  JNI peak used memory: 80 bytes
  JNI alive allocations at peak: 1
  JNI currently used memory: 80 bytes
  JNI currently alive allocations: 1
  jvmstat peak used memory: 0 bytes
  jvmstat alive allocations at peak: 0
  jvmstat currently used memory: 0 bytes
  jvmstat currently alive allocations: 0
  Native Memory Tracking peak used memory: 23584 bytes
  Native Memory Tracking alive allocations at peak: 1474
  Native Memory Tracking currently used memory: 768 bytes
  Native Memory Tracking currently alive allocations: 48
  PGO peak used memory: 0 bytes
  PGO alive allocations at peak: 0
  PGO currently used memory: 0 bytes
  PGO currently alive allocations: 0
  Threading peak used memory: 3960 bytes
  Threading alive allocations at peak: 30
  Threading currently used memory: 1088 bytes
  Threading currently alive allocations: 8
  Unsafe peak used memory: 2310280 bytes
  Unsafe alive allocations at peak: 57
  Unsafe currently used memory: 2099240 bytes
  Unsafe currently alive allocations: 36
  Internal peak used memory: 1024 bytes
  Internal alive allocations at peak: 1
  Internal currently used memory: 0 bytes
  Internal currently alive allocations: 0
The report shows instantaneous memory usage, instantaneous count, peak usage, and peak count organized by category. The categories are not identical to the categories in Hotspot. This is because there are many categories in Hotspot that are not applicable to SubstrateVM. There are also some categories that are useful in SubstrateVM but do not exist in Hotspot.
This report is a snapshot of a single instant in time so only reflects the native memory usage when it is generated. This is why the recommended way to consume NMT data is through JFR, as described below.
The report has since been changed in new early access builds to look more similar to that of OpenJDK.
NMT JDK Flight Recorder (JFR) events
The OpenJDK JFR events jdk.NativeMemoryUsage and jdk.NativeMemoryUsageTotal are supported in Native Image. jdk.NativeMemoryUsage exposes usage by category while jdk.NativeMemoryUsageTotal exposes usage overall. Both events do not include count information.
There are also two Native Image specific JFR events that you can access: jdk.NativeMemoryUsagePeak and jdk.NativeMemoryUsageTotalPeak. These custom events have been created to expose peak usage data otherwise not exposed through the JFR events ported over from the OpenJDK. In regular Java, users would use jcmd to get peak usage information. However, jcmd is not supported in Native Image.
Enabling JFR and NMT together
In order to gain access to these JFR events exposing NMT data, simply include JFR along with NMT at build time:
$ native-image --enable-monitoring=nmt,jfr MyAppThen enable JFR when you start your application. NMT will be enabled at runtime automatically if included at build time.
$ ./myapp -XX:StartFlightRecording=filename=recording.jfrExamples
Below is an example of what the contents of jdk.NativeMemoryUsage look like viewed with the jfr tool.
$ jfr print --events jdk.NativeMemoryUsage recording.jfr
jdk.NativeMemoryUsage {
  startTime = 15:47:33.392 (2024-04-25)
  type = "JFR"
  reserved = 10.1 MB
  committed = 10.1 MB
}
jdk.NativeMemoryUsage {
  startTime = 15:47:33.392 (2024-04-25)
  type = "Threading"
  reserved = 272 bytes
  committed = 272 bytes
}
...
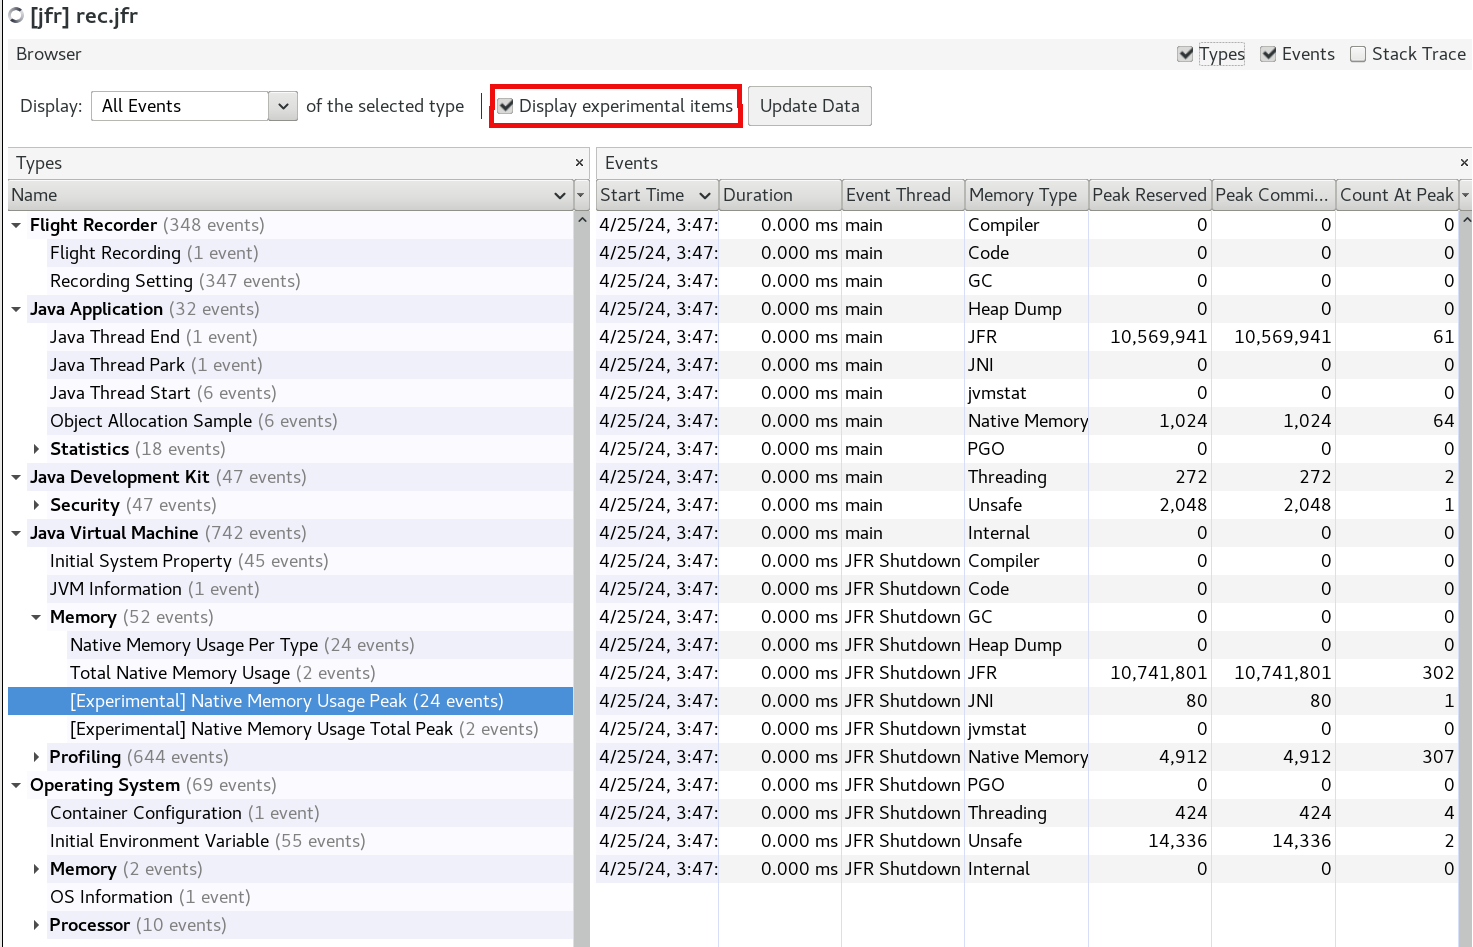
Figure 2 is an example of what the contents of jdk.NativeMemoryUsageTotal look like viewed with the JDK Mission Control.

jdk.NativeMemoryUsageTotal in JMC.Below is an example of what jdk.NativeMemoryUsagePeak looks like viewed with the jfr tool.
$jfr print --events jdk.NativeMemoryUsagePeak recording.jfr
jdk.NativeMemoryUsagePeak {
  startTime = 13:18:50.605 (2024-04-30)
  type = "Threading"
  peakReserved = 424 bytes
  peakCommitted = 424 bytes
  countAtPeak = 4
  eventThread = "JFR Shutdown Hook" (javaThreadId = 63)
}
jdk.NativeMemoryUsagePeak {
  startTime = 13:18:50.605 (2024-04-30)
  type = "Unsafe"
  peakReserved = 14.0 kB
  peakCommitted = 14.0 kB
  countAtPeak = 2
  eventThread = "JFR Shutdown Hook" (javaThreadId = 63)
}
...
Displaying experimental JFR events
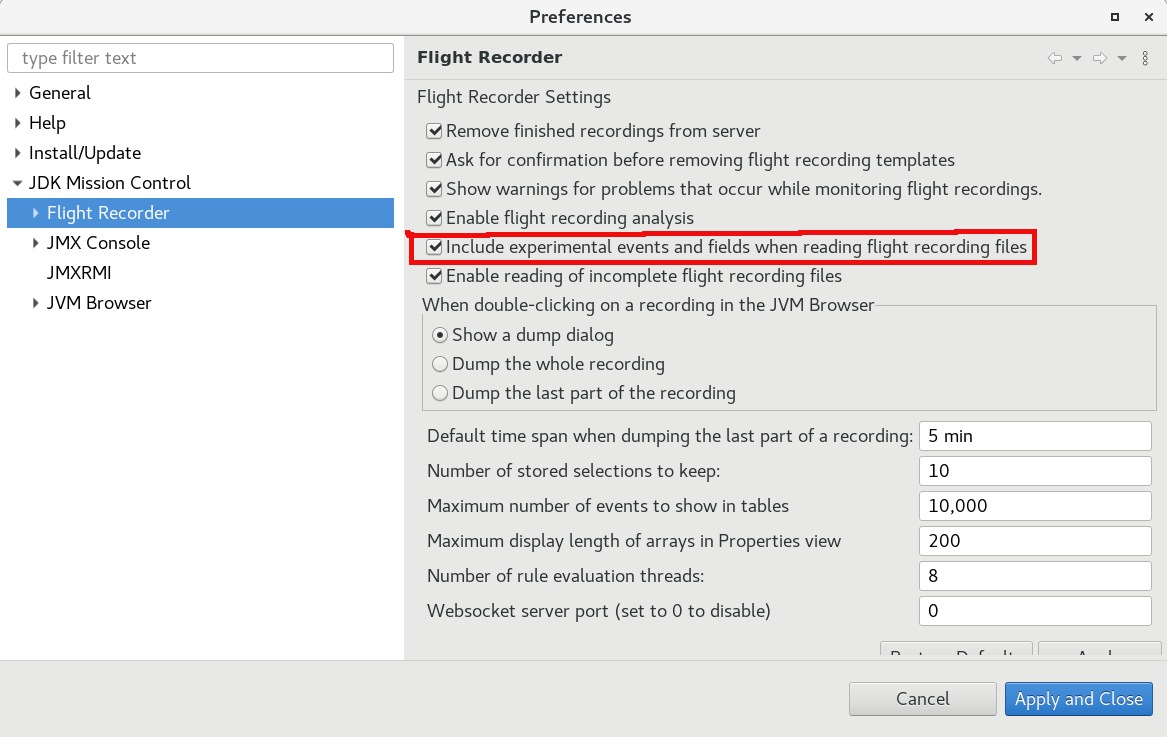
It should be noted that jdk.NativeMemoryUsagePeak and jdk.NativeMemoryUsageTotalPeak are marked as experimental. This means that software like VisualVM and JDK Mission Control will hide them by default.
To display these events in VisualVM, select the Display experimental items checkbox in the Browser tab as shown in Figure 3.

To display these events in JDK Mission Control, go to Preferences > JDK Mission Control > Flight Recorder and select Include experimental events... as shown in Figure 4.

General implementation details
NMT in Native Image works very similarly to its counterpart in Hotspot. Specifically, it works by instrumenting malloc/calloc/realloc call sites as well as mmap call sites. Broadly, this instrumentation is divided into malloc tracking and virtual memory tracking respectively. The virtual memory tracking component is only available in early access releases (read more in the next section). The malloc tracking takes advantage of prepending small headers to each malloc allocation. These headers store metadata about the allocation and allow the NMT system to maintain an accurate understanding of existing native memory blocks. The actual records of memory usage is essentially a series of continuously updated centralized counters. This means that when generating a NMT report, only an instantaneous snapshot of native memory usage is reported.
Performance impact
Similar to running Java apps on a JVM in just-in-time compiled mode, Native Image NMT will have very minimal performance impact in most scenarios. The current implementation has an overhead of 16B per allocation to accommodate malloc headers. It is possible to have contention for the atomic counters used to track usage amounts, but in most cases it is not expected that there are enough concurrent native memory allocations to have any impact.
Using a simple Quarkus app, based on a basic getting-started quick start, a test was run to gather the performance metrics in the table below. Hyperfoil was used to drive requests to the Quarkus native image executable. 50 requests per second were sent over 5 seconds, with up to 25 requests made concurrently. Each request resulted in 1000 sequential 1KB native allocations before a response was generated. This is something of a worst-case scenario since there are many small allocations instead of fewer large allocations. malloc header overhead scales with the allocation count, not the allocation size. Therefore, this should be interpreted as an exaggerated case, and performance under most conditions will be better.
These results are the average of 10 runs. Results from Java JIT execution are also included for comparison.
Measurement | With NMT (NI) | Without NMT (NI) | With NMT (Java) | Without NMT (Java) |
|---|---|---|---|---|
RSS (KB) | 53,030 | 53,390 | 151,460 | 148,952 |
Start-up time (ms) | 147 | 144 | 1,378 | 1,364 |
Mean response time (us) | 4,040 | 3,766 | 4,881 | 4,613 |
P50 response time (us) | 3,846 | 3,615 | 4,695 | 4,440 |
P90 response time (us) | 4,925 | 4,544 | 6,337 | 5,924 |
P99 response time (us) | 13,772 | 11,347 | 12,497 | 12,602 |
Image size (B) | 47,292,872 | 47,290,704 | N/A | N/A |
From the results table we can see that NMT had a negligible impact on RSS (measured at startup) and start-up time. This was expected since NMT does not require any special set up or pre-allocations (unlike JFR). NMT memory overhead is proportional to the number of native allocations. Image size increase is also very small (adding <3KB). Despite the exaggerated example, response latency also was minimally impacted.
A second test was later run to determine the combined impact of NMT and JFR. The results are below.
Measurement | With NMT and JFR (NI) | Without NMT or JFR (NI) | With NMT and JFR (Java) | Without NMT or JFR (Java) |
|---|---|---|---|---|
RSS (KB) | 72,366 | 52,388 | 191,504 | 149,756 |
Start-up time (ms) | 193 | 138 | 1,920 | 1,315 |
Mean response time (us) | 5,038 | 4,451 | 5,990 | 4,452 |
P50 response time (us) | 4,882 | 3,548 | 4,793 | 4,325 |
P90 response time (us) | 6,704 | 4,662 | 9,525 | 5,826 |
P99 response time (us) | 12,320 | 9,591 | 30,644 | 10,623 |
Image size (B) | 50,938,336 | 47,290,272 | N/A | N/A |
We can see a much bigger performance impact once JFR enters the picture. In fact, the impact of JFR greatly overshadows the impact of NMT in all measurement categories.
We can also use NMT itself to determine the amount of resources being used. The relevant sections of the NMT report are shown below:
  JFR peak used memory: 11295082 bytes
  JFR alive allocations at peak: 1327
  Native Memory Tracking peak used memory: 23584 bytes
  Native Memory Tracking alive allocations at peak: 1474
From this information we can see that the native memory used by JFR completely dwarfs the memory required by NMT. This is because JFR is much more complex. For example, JFR requires thread local buffers for each platform thread and storage tables for internal data. You can also see that NMT’s peak allocation count multiplied by size of a malloc header equals the peak used size.
Limitations and future plans
In GraalVM for JDK 23, NMT in Native Image only tracks malloc/calloc/realloc and is missing virtual memory tracking (only available in early access releases). However, malloc tracking is likely where most of the interesting allocations happen in the majority of cases. The current implementation of SubstrateVM only uses virtual memory operations, such as mmap, to back the “Java heap” and map the “image heap” (Native Image’s read-only part of the “Java heap”). The absence of virtual memory tracking means that JFR events such as jdk.NativeMemoryUsage will report reserved and committed memory as being equal. Once virtual memory tracking is integrated, and we track individual reserve/commits in addition to mallocs, the reserved and committed values may differ in some categories.
A limitation Native Image NMT shares with OpenJDK is that it can only track allocations at the VM-level and those made with Unsafe#allocateMemory(long). For example, if library code or application code calls malloc directly, that call will bypass the NMT accounting and be untracked.
A limitation specific to Native Image is that without JFR, there is no way to collect NMT report data at arbitrary points during program execution. You must wait until the program finishes for a report to be dumped. One solution being worked on is the ability to dump reports upon receiving a signal (similar to heap dumps).
In OpenJDK, NMT has two different modes. “Summary” mode is similar to what is currently implemented in Native Image, while “detailed” mode also tracks allocation call sites. “Detailed" mode is not yet supported in Native Image, but support may eventually be added in the future.
Another thing to be aware of is that each internal NMT counter is updated independently and un-atomically with respect to the other counters. This is the same as in OpenJDK. However, this means that reporting of "total" or “count at peak” measurement buckets may be momentarily out of sync with the other counters depending on when a report is requested.
Conclusion
The new NMT feature added to Native Image should help users shed some light on how their executables are using native memory. NMT joins the ranks of JFR, JMX, heap dumps, and debug info, as another component added to the Native Image observability and debugging toolbox. I hope you will try out this new feature and report any suggestions you have or issues you may find. You can do this in a GitHub issue in the GraalVM project repository. Cheers!
Last updated: January 15, 2025