Visual Studio Code (VS Code) is the integrated development environment (IDE) used by most .NET programmers. Programmers generally run VS Code on their local systems, but in the cloud era, you'll sometimes want to debug applications in the Kubernetes or Red Hat OpenShift environment where you're deploying them. With a few plugins and configurations, VS Code can work very smoothly in these cloud environments. This article sets you up to debug your .NET applications in the cloud.
Set up your environment
Install the Kubernetes command-line interface (CLI), kubectl, which VS Code uses to interact with Kubernetes. On Fedora, you can install kubectl with the following command:
$ sudo dnf install kubernetes-client
If you are using OpenShift, also install the OpenShift oc CLI:
$ sudo dnf install origin-clients
If you haven't already installed Visual Studio Code, do so using the instructions at the VS Code website.
As your final step in setting up the environment, start the IDE and install the C# extension and Kubernetes extension.
Connect to your cluster
Next, you will connect to the cluster and select its namespace. The commands in this section indicate where you should enter the following:
- Your hostname as
$NAME - Your cluster namespace as
$NAMESPACE - An authentication token as
$TOKEN - Your cluster's URL as
$URL
If you have installed the oc client, you can connect to your OpenShift cluster using the login command, then select the namespace using the project command:
$ oc login --token=$TOKEN --server=$URL
$ oc project $NAMESPACE
Alternatively, using kubectl, you can log in as follows:
$ kubectl config set-credentials kubeuser/$NAME --token=$TOKEN
$ kubectl config set-cluster $NAME --server=$URL
$ kubectl config set-context default/$NAME/kubeuser --user=kubeuser/$NAME --namespace=$NAMESPACE --cluster=$NAME
$ kubectl config use-context default/$NAME/kubeuser
Deploy your application
In this section, you'll use the OpenShift Source-to-Image (S2I) strategy to build and deploy an image on your cluster.
If you are not using OpenShift, you should build a container image from a .NET application and deploy it on the cluster. Be sure to build the application in the Debug configuration. Also, make sure your image contains the ps utility, which the Kubernetes plugin uses to find the .NET application. When you build the application, note the path where the source code resides. You'll need this information later to configure the debugger.
For the S2I build, we'll use the latest .NET version. Your cluster probably doesn't know about it yet, so import the version into your namespace using the -f option in the following command (for more information, see Installing .NET image streams):
$ oc create -f https://raw.githubusercontent.com/redhat-developer/s2i-dotnetcore/master/dotnet_imagestreams.json
Now, build and deploy the application from the following .NET source code:
$ oc new-app --name=demo-app 'dotnet:6.0~https://github.com/redhat-developer/s2i-dotnetcore-ex#dotnet-6.0' --build-env DOTNET_STARTUP_PROJECT=app DOTNET_CONFIGURATION=Debug
Note that we've used the DOTNET_STARTUP_PROJECT variable to indicate that the .NET project is under the app folder. We've also set DOTNET_CONFIGURATION to use the Debug configuration.
You can track the build and deployment in the OpenShift web console.
After a successful deployment, make the service publicly accessible:
$ oc expose svc/demo-app
To connect with the application, you need its URL, which you can get through the following command:
$ oc get routes demo-app
NAME          HOST/PORT
example-app   demo-app-mynamespace.myserver.com
Note that you will need the following information for the next step. It appears in the build log after the application is built:
$ oc logs bc/demo-app | head
Adding cluster TLS certificate authority to trust store
Cloning "https://github.com/redhat-developer/s2i-dotnetcore-ex" ...
    Commit:    2703bfe7303d1528d0ddb44b419e3114e5cb9f43 (6.0: replace app with 'dotnet new mvc --no-restore' (#62))
...
Debug the application
Start by getting the application sources. The following commands draw on the information shown in the build log from the previous section:
$ git clone https://github.com/redhat-developer/s2i-dotnetcore-ex
$ cd s2i-dotnetcore-ex
$ git checkout 2703bfe7303d1528d0ddb44b419e3114e5cb9f43
Now open VS Code with the working directory argument (.) to make the workspace folder match the source repository:
$ code .
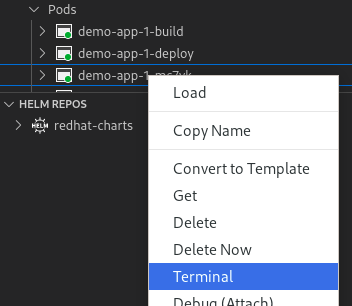
On the left side of the user interface, navigate to the Kubernetes tab and expand cluster–>Workloads–>Pods until you see the pod that is running the application. Right-click the entry and choose Terminal, as shown in Figure 1.
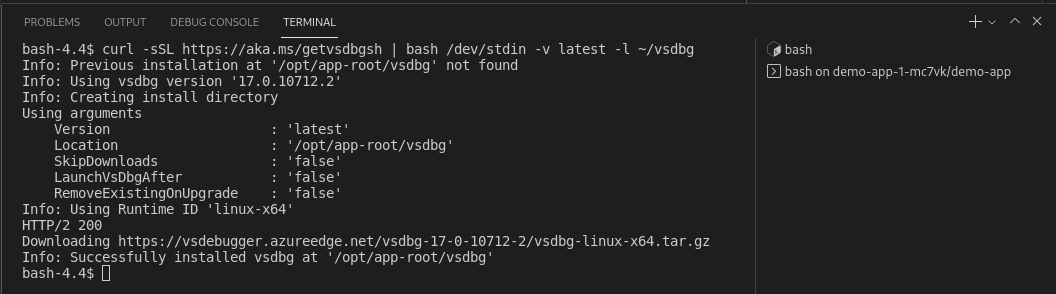
A terminal window will open in the VS Code TERMINAL tab. From the terminal, install Microsoft's .NET Core debugger (vsdbg):
$ curl -sSL https://aka.ms/getvsdbgsh | bash /dev/stdin -v latest -l ~/vsdbg
You can see the installation's progress in the terminal window, as shown in Figure 2. The installation ends by printing the directory where the executable was installed. Make a note of this directory because you'll need the information during configuration.
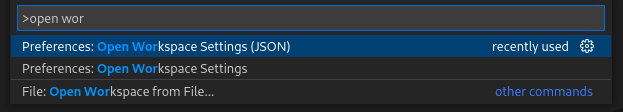
Next, configure the Kubernetes settings for debugging your application. Open the Command Palette by pressing Ctrl+Shift+P and choose Preferences: Open Workspace Settings (JSON), as shown in Figure 3.
An empty JSON document will open. Change the contents to the following and save the file:
{
  "vs-kubernetes": {
    "vs-kubernetes.dotnet-vsdbg-path": "/opt/app-root/vsdbg/vsdbg",
    "vs-kubernetes.dotnet-source-file-map": "/opt/app-root/src"
  }
}
Note that you are setting two paths. The first path (dotnet-vsdbg-path) is the location of vsdbg in the container. You can find the directory containing vsdbg in the output from the installation script, as mentioned earlier. Append /vsdbg to the directory to create the value for this setting.
The second path (dotnet-source-file-map) is the directory where the repository was checked out when the application was built. The debugger uses this setting to map the files referenced in the debug information to the files in the VS Code workspace. When you use the OpenShift S2I strategy, this folder is /opt/app-root/src.
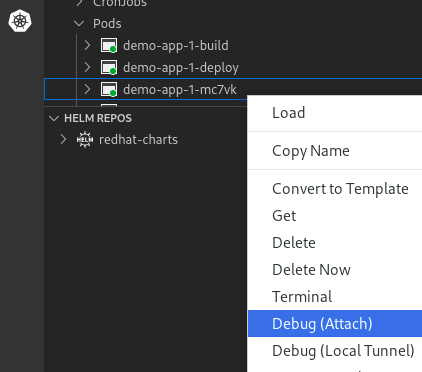
You're ready to start your debugger. Right-click the pod once more and select Debug (Attach), as shown in Figure 4.
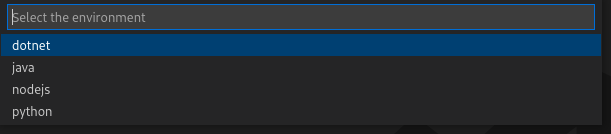
A drop-down menu will appear. Choose dotnet as the environment, as shown in Figure 5.
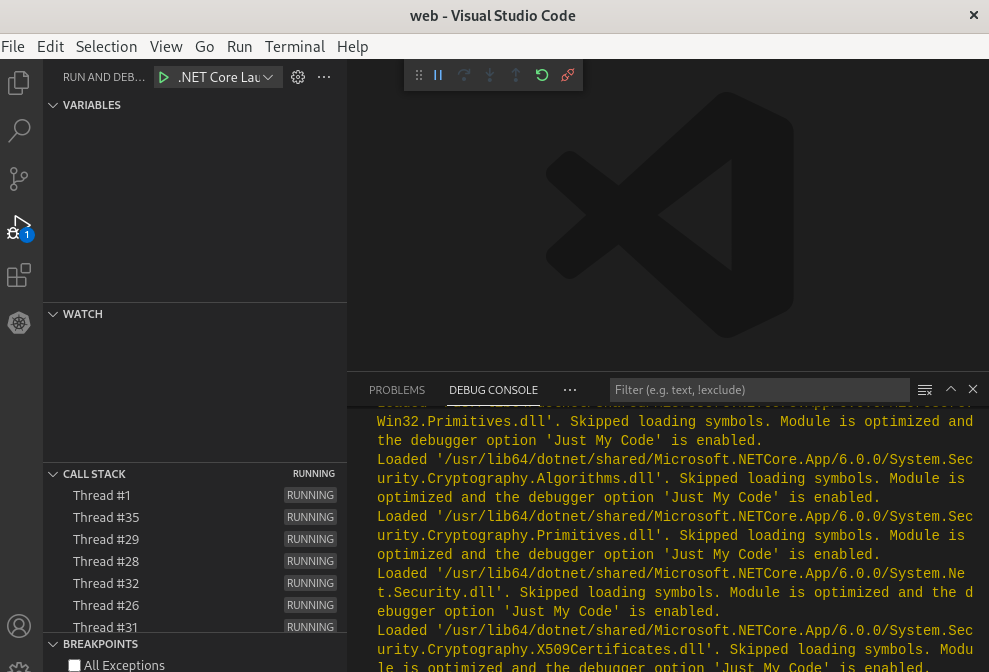
The VS Code debug console (Figure 6) will show the debugger starting.
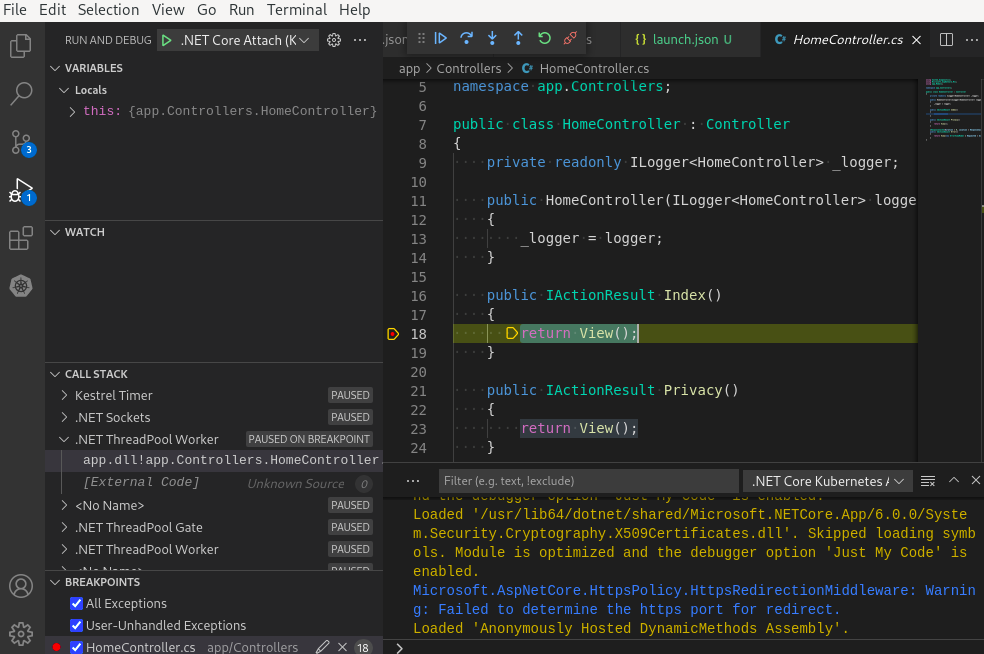
Now you can add a breakpoint to the app and trigger it from the web application, as shown in Figure 7. You are successfully debugging an application running in your cluster.
Define a launch configuration
In the previous section, the Kubernetes plugin was responsible for starting the .NET debug session. You can also define a launch configuration that starts the debugger from VS Code's Debug tab. Within this configuration, you can also control additional debugger settings, such as justMyCode and requireExactSource.
To start, create a file named launch.json in the hidden .vscode directory with the following contents. If the file already exists, you can copy in the .NET Pod Attach configuration following the configurations that are already present:
{
  "version": "0.2.0",
  "configurations": [
    {
      "name": ".NET Pod Attach",
      "type": "coreclr",
      "request": "attach",
      "processId": 1,
      "pipeTransport": {
        "pipeProgram": "kubectl",
        "pipeArgs": [ "exec", "-i", "demo-app-2-6gkd4", "--" ],
        "debuggerPath": "/opt/app-root/vsdbg/vsdbg",
        "pipeCwd": "${workspaceFolder}",
        "quoteArgs": false
      },
      "sourceFileMap": {
        "/opt/app-root/src": "${workspaceFolder}"
      }
    }
  ]
}
If you look closely at the configuration, you'll see the name of the pod, the location of the debugger, and the mapping for the source code. These are the settings you provided to the Kubernetes plugin. The configuration expects the .NET process to run as process ID (pid) 1. This is true for the S2I containers, but you may need to adjust the value when using a different image.
Now, you can launch the debugger directly from VS Code's RUN AND DEBUG tab, as shown in Figure 8.

In this example, you've compiled the application with the Debug configuration, which yields the best experience in the debugger. You can debug an application in the Release configuration by adding "justMyCode ": false to the configuration. Note that release optimizations cause a mismatch between the source code and the CPU instructions, so the debugger could have issues setting breakpoints in this configuration. You can improve the match by disabling JIT optimizations. To do this, set COMPlus_JITMinOpts to 1 in the application deployment configuration.
Conclusion
Although programmers have traditionally used VS Code on their local system, the debugger works just as well for applications in a remote environment such as a Kubernetes cluster. This article has guided you through the steps to make debugging convenient for .NET applications on Kubernetes and OpenShift, and will hopefully encourage you to use those environments.
Last updated: November 8, 2023