These days, most developers deploy applications on Kubernetes. Debugging in a container environment can be hard, and developers sometimes resort to ineffective methods to discover bugs during the deployment phase. As an example, imagine that you have a Kubernetes Operator that you want to debug because the reconciliation process is not working properly, or because the operator is not working as expected. You decide to deploy the operator on a Kubernetes cluster running on your local machine, to verify what's happening in your production cluster.
At this point, you can write some code to debug the operator, build the new debug image, and deploy it on the local cluster to check the output and logs. More elegantly, you can use a debugger on a remote server, setting a breakpoint to look for the problematic behavior.
This article shows how to use the second option, running a debugger on Kubernetes through the Visual Studio Code (VS Code) IDE. We'll debug a Go program, but the principles apply to other languages and debuggers.
Debugging options
First, let's analyze the basics of the debugging methods I mentioned in order to understand the advantages of the method I chose.
Debugging using output
Reviewing output is the simplest way to deploy and debug an application or operator. You just need to identify the hot points in the code and print the information you want to debug. Piece of cake!
The problem with this procedure is the time required to build a new image each time you want to print new information. You also have to consider the time required to deploy the operator to your cluster before testing it.
For example, with the reconcile loops of complex operators (more than a thousand lines per reconcile loop), it could be difficult to print the exact information you need. It might take you several tries until you locate the issue and can debug it. Using print statements, you can easily miss the hot points and fail to see the information you need. In short, you could waste a lot of time with this method if you don't have a good understanding of the code.
Debugging on a remote server
This method consists of using a classical debugger to get information that reveals the cause of your problem quickly. The process shown in this article runs on the remote server in Kubernetes (maybe in a staging environment similar to the production environment). Furthermore, you are creating the images at the same time as you're fixing the code, deploying the operator again and again, and reducing the time you have to wait for information.
The key traits of this method are:
- Running remotely on a test, staging, or production environment.
- Using an interactive debugger (in this article, we use Delve on a Go program).
- Building and deploying the images automatically at the same time as you're running the debugger.
Let's get started.
Prerequisites and environment options
This section covers how to set up the environment and tools you need to run the example in this article. You'll run a Kubernetes cluster remotely on another server, using VS Code extensions to run the debugger and application remotely. My basic environment consists of:
- My laptop:
- Operating system: macOS Big Sur 11.6
- VS Code IDE and extensions
This is my laptop with VS Code installed, but without deployment tools such as Docker, kubectl, and so on.
- Server (hostname
alkmini):- Linux (Fedora 5.11.8-200.fc33.x86_64)
- SSH server
- Docker daemon running
kubectlandoc(the command-line interface for Red Hat OpenShift)- Delve (the debugger for Go)
- A Kubernetes cluster (using
minikubefor this example)
For the remote server, you could also use a staging cluster, a local cluster, or some other setup. The important points here are:
- On the local system, all you need is your IDE.
- On the remote server, you don't need the IDE.
Installing VS Code extensions and tools
First, install the VS Code extensions that allow you to run everything remotely.
Remote - SSH
This extension allows you to use VS Code on your laptop to work in a remote server exactly as you would use VS Code on your local machine. The extension uses SSH to connect to the remote server and run commands there, as well as use other VS Code extensions there.
Install the Remote - SSH extension from the Visual Studio marketplace.
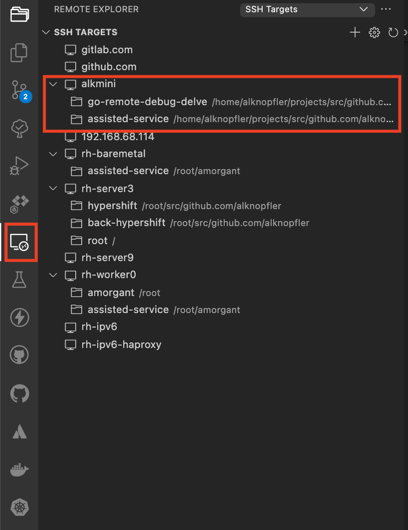
Add your remote server and open a folder just like a workspace to start working remotely. Add your host information and ensure you have direct SSH access to the host (through a previously added SSH key). Then, you can navigate to the folder you want to add, as shown in Figure 1.
Once connected, you can tell that you're working remotely because an SSH connection appears in green in the left-hand bottom corner of the screen, as shown in Figure 2.
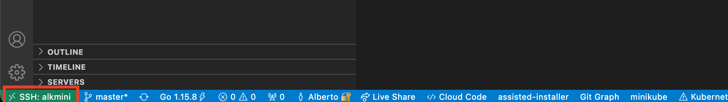
At this point, everything you do in your laptop VS Code editor is executed in the remote server.
Think about which extensions you need in the remote server. What you install in the remote server will probably be only a subset of extensions installed on your own system.
Cloud Code Kubernetes
This extension provides local, continuous feedback on your project as you edit, build, deploy, and run your applications locally or in the cloud. The extension works under the hood with Google’s command-line container tools such as Skaffold, minikube, and kubectl. Cloud Code was originally designed to be used with the Google Cloud Platform, but it works on any Kubernetes cluster. We'll use Cloud Code with our minikube Kubernetes cluster.
Install the Cloud Code extension from the Visual Studio marketplace.
Note: As of this writing, there is a bug in the latest version, so you need to install the previous version, Cloud Code 1.14.1.
Delve
Delve (dlv) is the official debugger for the Go programming language. Delve should be easy to invoke and use, and provides a simple, full-featured debugging tool for Go. Chances are that when you're using a debugger, things aren't going well. With that in mind, Delve tries to stay out of your way as much as possible.
Install Delve from the repository on GitHub. Use the following commands:
bash
$ git clone https://github.com/go-delve/delve
$ cd delve
$ go install github.com/go-delve/delve/cmd/dlv
Keep the debugger running in order to debug the application on the remote server from your local system using the VS Code editor and the Remote - SSH extension.
Configuration
This section creates an example application to explain the debugging process step by step. We'll look at the repository and the configuration you need in order to debug the application interactively in a Kubernetes cluster.
Repository
Download an example Go application from the GitHub repository. The contents of this repository are:
alknopfler:alkmini : ~/projects/src/github.com/alknopfler/go-remote-debug-delve {master}
$ tree .
.
|-- .vscode
|   |-- settings.json
|   |-- launch.json
├── docker
│   └── debug
│       └── Dockerfile
├── go.mod
├── k8s
│   └── deployment.yml
├── main.go
├── Makefile
├── README.md
└── skaffold.yaml
The key contents are:
dockerfolder: Contains the Dockerfile to generate the image, which we'll push to the Quay.io registry.k8sfolder: Contains the manifest that describes application deployment.Main.go: The application's main code file.Skaffold.yaml: The configuration file used to build and deploy the application..vscode/launch.json: The configuration for the cloud code extension.
Configure Cloud Code
Open the .vscode/launch.json file and add the configuration options marked by arrows in Figure 3. I'll describe the options next.

Attach (Go) to k8s Pod
We use this option to attach to a running pod in the Kubernetes cluster in order to debug it. You can set a breakpoint in the code as long as the image was built with the Delve debugger installed. Debug the application by attaching to its pod selector and port, shown in the following configuration:
yaml
{
            "name": "Attach to Kubernetes Pod (Go)",
            "type": "cloudcode.kubernetes",
            "request": "attach",
            "language": "Go",
            "debugPort": 40000,
            "podSelector": {
                "app": "server-debug"
            },
            "localRoot": "${workspaceFolder}",
            "remotePath": "",
            "remoteRoot": "/"
}
Make sure to configure the remotePath and remoteRoot properties. If you make a mistake here, you will be able to attach to the pod but not debug it, because the breakpoint will be "unverified."
Run/Debug Kubernetes App
The configuration for this option follows:
`yaml
{
            "name": "Kubernetes: Run/Debug",
            "type": "cloudcode.kubernetes",
            "request": "launch",
            "autoStop": false,
            "skaffoldConfig": "${workspaceFolder}/skaffold.yaml",
            "watch": true,
            "cleanUp": true,
            "portForward": true,
            "imageRegistry": "quay.io",
            "debug": [
                {
                    "image": "quay.io/amorgant/server-debug",
                    "containerName": "server-debug",
                    "sourceFileMap": {
                        "${workspaceFolder}": ""
                    }
                }
            ]
        },
Some points should be explained:
autoStop: If you set this totrue, the debugging session stops automatically when the application terminates.SkaffoldConfig: This is the configuration file that continuously builds and deploys the application.watch: This is the most important option for debugging interactively. It notifies Skaffold of changes in your code, so that Skaffold can rebuild and redeploy the new image while you're debugging and recoding. Also, if you enable theauto-saveoption, this process will be constantly running.cleanUp: This leaves the server in a clean state after your session. It destroys the containers and images created by Skaffold after you stop the debugger.portForward: This option allows you to run the debugger remotely by port forwarding to your local environment.debug/image: This is the image you will build with the Delve debugger installed, along with your application.
In short, you can use the Cloud Code extension along with the "Attach (Go) to k8s Pod" option to debug a running pod. And if you change something in your code, Skaffold builds and deploys the new image to continue the debugging step. The combination of both options provides the magic to debug Kubernetes applications or operators remotely.
Configure Skaffold
Skaffold is a very interesting tool for building and deploying your application directly using the Cloud Code extension you just installed. Just copy the manifest to create a pipeline for your application and run the Cloud Code extension to use the manifest. There are a number of interesting options that I'll describe shortly.
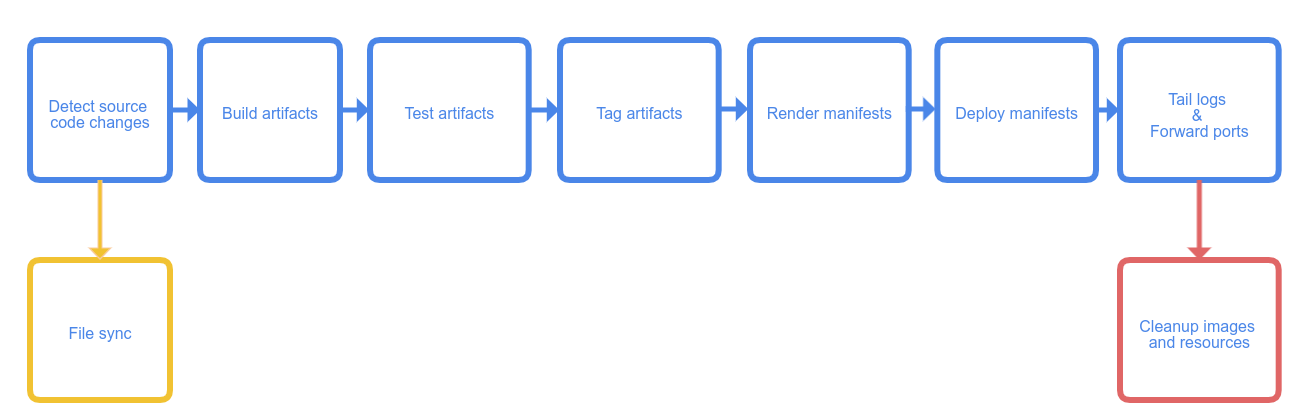
Figure 4 shows the steps Skaffold passes through to build and deploy an application. This process doesn't take place in real time, because the build step takes some time, but you can debug and rebuild iteratively without having to stop the debugger.
The configuration file we use in this example follows:
yaml
apiVersion: skaffold/v2beta19
kind: Config
build:
  artifacts:
  - image: quay.io/amorgant/server-debug
    buildpacks:
      builder: gcr.io/buildpacks/builder:v1
    context: .
    sync:
      auto: true
  local:
    push: true
deploy:
  kubectl:
    manifests:
    - k8s/deployment.yml
For our build step, Skaffold supports a number of builders, which include common tools like Dockerfile, Maven, and Buildpacks, along with your own custom scripts. In our case, we're going to use Buildpacks, which automatically detects your Dockerfile and uses it for the build:
yaml
    buildpacks:
      builder: gcr.io/buildpacks/builder:v1
For a large project where several build steps have complex Makefiles, you could use a configuration like this one:
yaml
buildpacks:
 custom:
      buildCommand: |
        sudo -S skipper make update-debug-minimal
        docker tag quay.io/ocpmetal/assisted-service:latest quay.io/amorgant/assisted-service:latest
        docker push quay.io/amorgant/assisted-service:latest
        sudo -S skipper make deploy-all
Also, you could build using your Dockerfile specification, like this:
yaml
  docker:
    dockerfile: deploy/Dockerfile
For the deployment step, Skaffold supports several deployers: Kubernetes, Helm, Kustomize, and Docker.
Dockerfile configuration for debugging
To debug your application, you need to build its image to include Delve. That way, you can run the application through the dlv command's entry point:
Dockerfile
FROM golang:1.16 AS build
WORKDIR /
COPY . .
RUN CGO_ENABLED=0 go get -ldflags "-s -w -extldflags '-static'" github.com/go-delve/delve/cmd/dlv
RUN CGO_ENABLED=0 go build -gcflags "all=-N -l" -o ./app

FROM alpine
WORKDIR /
COPY . .
COPY --from=build /go/bin/dlv dlv
COPY --from=build /app app
ENTRYPOINT [ "/dlv" , "--listen=:40000", "--headless=true", "--api-version=2", "--accept-multiclient", "exec", "/app"]]
The entry point launches the application using the dlv command so you can debug the application on the remote server.
The Kubernetes deployment
This is a basic deployment for the Kubernetes application. It's a simple deployment with a single container using the image we've just built:
yaml
apiVersion: apps/v1
kind: Deployment
metadata:
  name: server-debug
spec:
  selector:
    matchLabels:
      app: server-debug
  template:
    metadata:
      labels:
        app: server-debug
    spec:
      containers:
      - name: server-debug
        image: quay.io/amorgant/server-debug
        imagePullPolicy: Always
        resources:
          requests:
            memory: "128Mi"
            cpu: "100m"
          limits:
            memory: "256Mi"
            cpu: "500m"
        ports:
        - containerPort: 8080
Demo: Debugging Kubernetes remotely
Once you have the whole configuration ready, open the Cloud Code extension and follow the steps in this section.
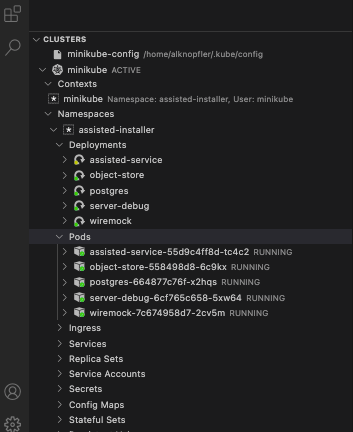
First, verify that the cluster is ready and that you can get access to its resources from VS Code and the Cloud Code extension, as shown in Figure 5.
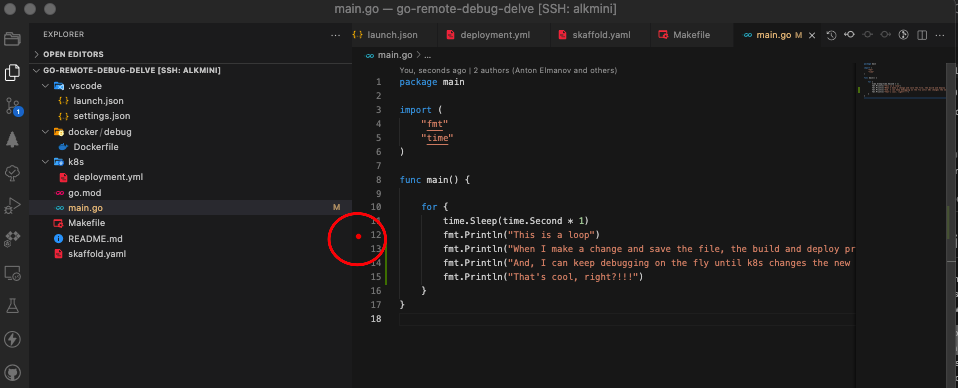
Next, set a breakpoint in the code, as shown in Figure 6.
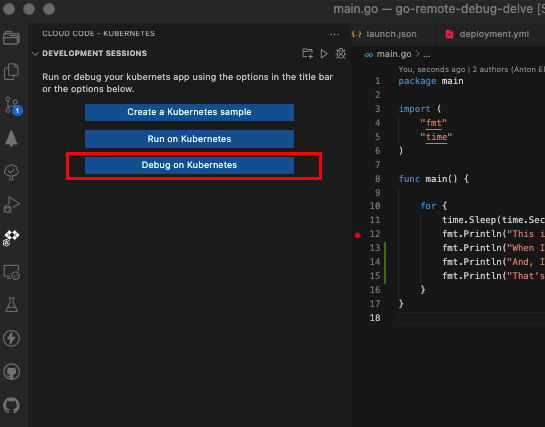
Now, click the Debug on Kubernetes button to start the process, as shown in Figure 7.
Once the application starts, it is run through the debugger, as shown in the following video.
Limitations and a quick fix
To make this process work, you need to copy the project inside the Dockerfile because the debugger needs access to the stack to know which is the trace to debug it. The following should provide what you need:
WORKDIR /
COPY . .
Resources
Some of the main tools mentioned in this article are:
- VScode Remote Explorer
- Cloud Code extension
- Delve Go debugger
- Skaffold builders
- Video of debug session
Acknowledgements
I'd like to thank two people who inspired and helped me with this example application.
- Special thanks to @dchavero for help with the configuration of the environment.
- Thanks also to antelman107 for the application, which made me think about creating this article.