Prometheus is an open source monitoring solution that collects metrics from the system and its applications. As a developer, you can query these metrics and use them to create alerts, which you can use as a source for dashboards. One example would be using Prometheus metrics with Grafana.
In this article, I show you how to use Prometheus to monitor a .NET Core application running on Kubernetes. Note that installation instructions are not included with the article. I do include a reference for using the Prometheus Operator to create and configure Prometheus on Kubernetes.
Note: Learn more about Prometheus' support for monitoring Kubernetes and containerized applications deployed on OpenShift.
Open source monitoring with Prometheus
Prometheus organizes data in a time series. This type of data graph is useful for tracking how a numeric value changes over time. Prometheus then uses the time series to track the following:
- Counters: Values that can only increment, like the number of requests handled.
- Gauges: Values that can go up and down, like memory used.
- Histograms: Values that are counted in a number of buckets, like response time.
A single metric (like HTTP response time) corresponds to multiple time series that have a unique set of labels. Thanks to these labels, you can filter queries for specific criteria, such as the HTTP response time for a particular URL.
Deploying Prometheus
You can use the Prometheus Operator to create and configure Prometheus on Kubernetes. To set up this example, I started by creating a project with a user that has monitoring permissions. I followed the steps described in Monitoring your own services to create the project and user.
Exposing metrics from .NET Core
We'll use the prometheus-net library to expose metrics from .NET Core. This library includes a package for monitoring .NET Core, and a separate package for monitoring ASP.NET Core. The ASP.NET Core monitoring package includes additional metrics related to the web server.
As described in the prometheus-net README, we need to include the prometheus-net.AspNetCore package:
<ItemGroup>
  <PackageReference Include="prometheus-net.AspNetCore" Version="3.5.0" />
</ItemGroup>
Next, we'll add an endpoint that Prometheus will use to retrieve the metrics:
app.UseEndpoints(endpoints =>
{
  // ...
  endpoints.MapMetrics();
};
Finally, we enable capturing the HTTP metrics:
public void Configure(IApplicationBuilder app, ...)
{
  // ...
  app.UseRouting();
  app.UseHttpMetrics();
  // ...
}
We'll deploy this application on Red Hat OpenShift, and make it accessible from outside the cluster:
$ oc new-app dotnet:3.1~https://github.com/redhat-developer/s2i-dotnetcore-ex#dotnetcore-3.1-monitor --context-dir app
$ oc expose service s2i-dotnetcore-ex
Now that our application is up and running, we can have a look at the HTTP endpoint that is used by Prometheus at the /metrics path. Notice the different gauges, counters, and histograms exposed by the ASP.NET Core application:
# HELP process_private_memory_bytes Process private memory size
# TYPE process_private_memory_bytes gauge
process_private_memory_bytes 383516672
# HELP process_working_set_bytes Process working set
# TYPE process_working_set_bytes gauge
process_working_set_bytes 229879808
# HELP http_requests_in_progress The number of requests currently in progress in the ASP.NET Core pipeline. One series without controller/action label values counts all in-progress requests, with separate series existing for each controller-action pair.
# TYPE http_requests_in_progress gauge
http_requests_in_progress{method="GET",controller="",action=""} 1
http_requests_in_progress{method="POST",controller="Home",action="Index"} 0
http_requests_in_progress{method="GET",controller="Home",action="Index"} 0
# HELP http_requests_received_total Provides the count of HTTP requests that have been processed by the ASP.NET Core pipeline.
# TYPE http_requests_received_total counter
http_requests_received_total{code="200",method="POST",controller="Home",action="Index"} 1
http_requests_received_total{code="200",method="GET",controller="Home",action="Index"} 1288
http_requests_received_total{code="200",method="GET",controller="",action=""} 4944
# HELP http_request_duration_seconds The duration of HTTP requests processed by an ASP.NET Core application.
# TYPE http_request_duration_seconds histogram
http_request_duration_seconds_sum{code="200",method="GET",controller="Home",action="Index"} 0.5861144999999994
http_request_duration_seconds_count{code="200",method="GET",controller="Home",action="Index"} 1288
http_request_duration_seconds_bucket{code="200",method="GET",controller="Home",action="Index",le="0.001"} 1262
...
http_request_duration_seconds_bucket{code="200",method="GET",controller="Home",action="Index",le="+Inf"} 1288
http_request_duration_seconds_sum{code="200",method="GET",controller="",action=""} 8.691159999999982
http_request_duration_seconds_count{code="200",method="GET",controller="",action=""} 4944
...
You can see metrics for memory like the process_working_set_bytes gauge. You can also see http_request_duration_seconds that exposes a histogram for the request duration. The process_working_set_bytes metric has time series per code, method, controller, and action. This lets us filter based on those labels. The histogram data is in the http_request_duration_seconds_bucket metric, which defines buckets using the le (less or equal) label. The histogram also includes a *_count and *_sum metric.
Monitoring the .NET application
Now, we need to configure metrics collection for the .NET application. We do this on OpenShift by adding a PodMonitor or ServiceMonitor configuration to the namespace. The OpenShift Prometheus Operator picks up these resources and configures monitoring.
Next, let’s look at the service we’ve deployed. We'll use this information to configure the ServiceMonitor:
$ oc get service s2i-dotnetcore-ex -o yaml
apiVersion: v1
kind: Service
metadata:
  annotations:
    openshift.io/generated-by: OpenShiftNewApp
  creationTimestamp: 2020-05-08T11:48:02Z
  labels:
    app: s2i-dotnetcore-ex
  name: s2i-dotnetcore-ex
  namespace: demoproject
  resourceVersion: "22076"
  selfLink: /api/v1/namespaces/demoproject/services/s2i-dotnetcore-ex
  uid: 2aa94ebe-2384-4544-bcbe-b8283bd2db60
spec:
  clusterIP: 172.30.35.187
  ports:
  - name: 8080-tcp
    port: 8080
    protocol: TCP
    targetPort: 8080
  selector:
    app: s2i-dotnetcore-ex
    deploymentconfig: s2i-dotnetcore-ex
  sessionAffinity: None
  type: ClusterIP
status:
  loadBalancer: {}
Configure the ServiceMonitor
We'll add a ServiceMonitor that matches the app: s2i-dotnetcore-ex label, name: 8080-tcp port, and namespace: demoproject namespace from the service configuration.
First, we create an example-app-service-monitor.yaml file with the following content:
apiVersion: monitoring.coreos.com/v1
kind: ServiceMonitor
metadata:
  labels:
    k8s-app: prometheus-example-monitor
  name: prometheus-example-monitor
  namespace: demoproject
spec:
  endpoints:
  - interval: 30s
    port: 8080-tcp
    scheme: http
  selector:
    matchLabels:
      app: s2i-dotnetcore-ex
Note that the configuration includes the interval for monitoring, which in this case is set to 30s.
All that's left to do is add the monitor:
$ oc apply -f example-app-service-monitor.yaml
Querying Prometheus
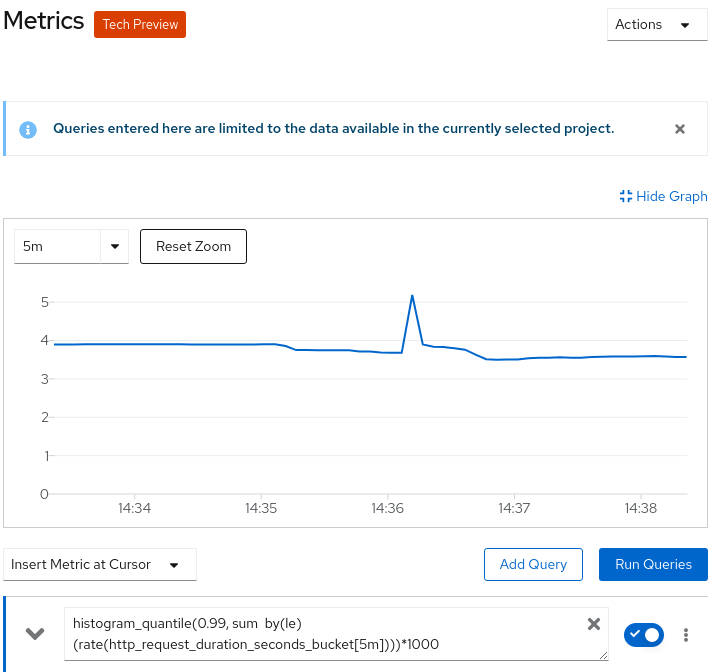
Now that Prometheus is monitoring our application, we can look at the metrics we've collected. To start, open the OpenShift web user interface (UI) and go to the Advanced > Metrics page. On this page, we can execute Prometheus queries. PromQL is the Prometheus Query Language and offers a simple, expressive language to query the time series that Prometheus collected.
As an example, we’ll use a query for calculating the 99% quantile response time of the .NET application service:
histogram_quantile(0.99, sum by(le) (rate(http_request_duration_seconds_bucket[5m])))*1000
Figure 1 shows the response-time graph generated by Prometheus.
PromQL queries
In case you're not familiar with PromQL, let's dissect this query. We're using the http_request_duration_seconds_bucket metric from the http_request_duration_seconds histogram that we saw under the /metrics path.
Because these values are ever-incrementing counters, we apply the rate operation over a five-minute window. This gives us the response-time change over the last five minutes. The http_request_duration_seconds_bucket metric is split into a number of time series (per code, method, and so on). We don't care about these individual series, so we will sum them up. We add the by (le) argument to maintain the separate buckets that make up the histogram. We use histogram_quantile to obtain the 99% quantile value, and multiply by 1000 to get the time in milliseconds.
Conclusion
In this article, you've learned about using Prometheus to monitor .NET Core applications that are deployed on Kubernetes. If you wanted to continue with the example, you could use the metrics collected by Prometheus to generate alerts and view them in one or more Grafana dashboards. If you're curious, check out OpenShift 4.3's support for accessing Prometheus, the Alerting UI, and Grafana via the web console.
Last updated: July 30, 2020