Page
How to scale within clusters on Red Hat OpenShift Service on AWS
Scaling can refer to a few things.
- Manually scaling pods
- Pod autoscaling (using a horizontal pod autoscaler)
- Node autoscaling
In this section, we will explore all three.
What will you learn?
- Manual and auto-scaling of pods
- Autoscaling of nodes
What do you need before starting?
- Successfully deployed application on a Red Hat OpenShift Service on AWS (ROSA) cluster
Steps for scaling within an OpenShift Service on AWS cluster
Pod scaling
In OpenShift, you can scale the number of pods up or down for each part of an application as needed. This can be accomplished via changing our replica set/deployment definition (declarative), by the command line (imperative), or via the web console (imperative).
In our deployment definition (part of our ostoy-fe-deployment.yaml), we stated that we only want one pod for our microservice to start with. This means that the Kubernetes Replication Controller will always strive to keep one pod alive. We can also define pod autoscaling using the horizontal pod autoscaler (HPA) based on load to expand past what we defined if needed (which we will do in a later section of this learning path).
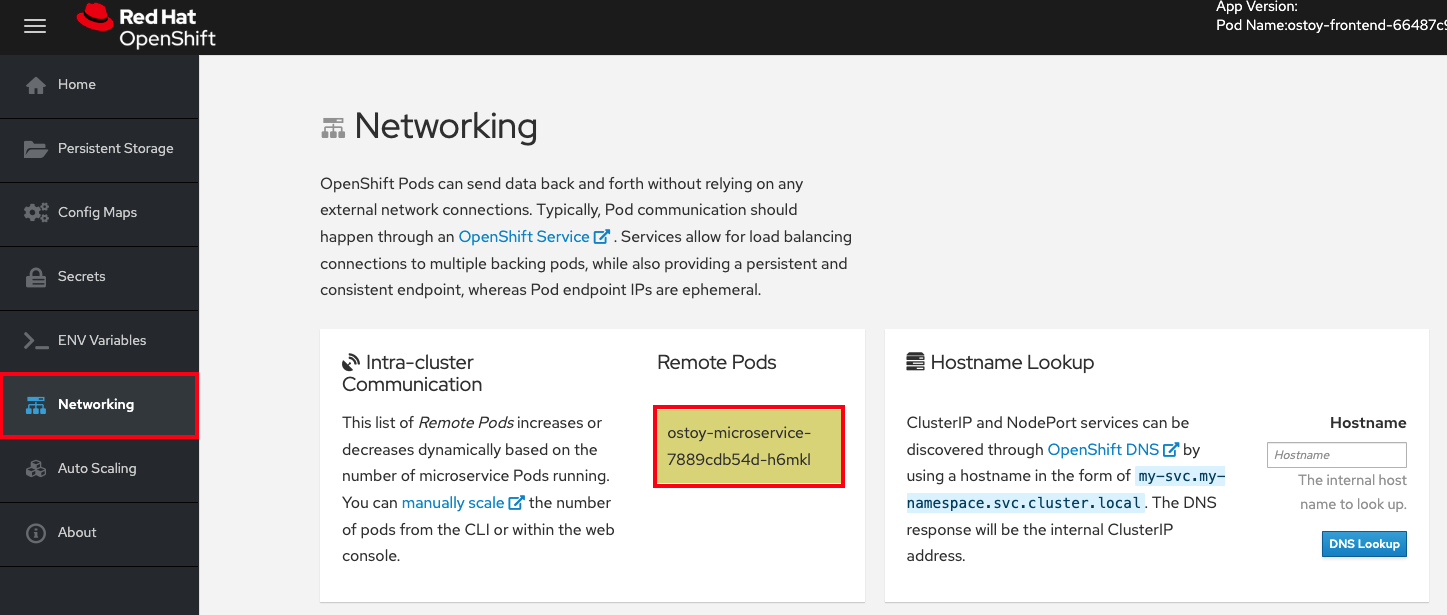
In the OSToy app, click on Networking in the left menu to access this portion of the workshop.
If you look at the Intra-cluster Communication tile on the left, you should see one box randomly changing colors. This box displays the randomly generated color sent to the frontend by our microservice along with the pod name that sent it. Because we see only one box, as shown in Figure 18, that means there is only one microservice pod. We will now scale up our microservice pods to see the number of boxes change.
1. Confirm the number of pods running
To confirm that we only have one pod running for our microservice, run the following command or use the web console:
 $ oc get pods
    NAME                                   READY     STATUS    RESTARTS   AGE
    ostoy-frontend-679cb85695-5cn7x       1/1       Running   0          1h
    ostoy-microservice-86b4c6f559-p594d   1/1       Running   0          1h
2. Scale pods via Deployment definition
Let's change our microservice definition YAML to reflect that we want three pods instead of the one we see. Download the ostoy-microservice-deployment.yaml and save it on your local machine, if you haven’t done so already.
- Open the file using your favorite editor (e.g., vi ostoy-microservice-deployment.yaml)
- Find the line that states replicas: 1 and change that to replicas: 3. Then save and quit.
It will look like this:
spec:
        selector:
          matchLabels:
            app: ostoy-microservice
        replicas: 3
- Assuming you are still logged in via the CLI, execute the following command:
oc apply -f ostoy-microservice-deployment.yaml
Note: You can also change it directly in the OpenShift Web Console by going to Deployments
→ ostoy-microservice → YAML tab.
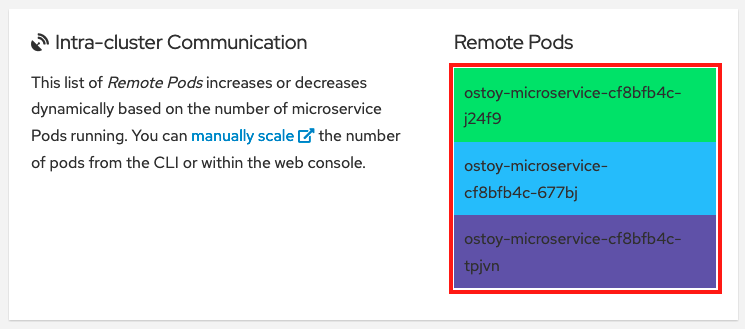
- Confirm that there are now three pods, either the CLI (oc get pods) or the web console (Workloads → Deployments → ostoy-microservice).
- See this visually by navigating to the OSToy app → Networking in the left menu and counting how many boxes there are now. There should be three.
3. Scale down via CLI
Now we will scale the pods down using the command line.
- Execute the following command from the CLI:
oc scale deployment ostoy-microservice --replicas=2
- Confirm that there are indeed two pods, either via the CLI or the web console.
oc get pods
- See this visually by visiting the OSToy app and counting how many boxes there are now. It should be two.
4. Scale down via web console
Lastly, let's use the web console to scale back down to one pod.
- In the project you created for this app (e.g., "ostoy") click Workloads → Deployments → ostoy-microservice. On the left, you will see a blue circle with the number 2 in the middle.
- Click the down arrow to the right of that (shown in Figure 20) to scale the number of pods down to 1.
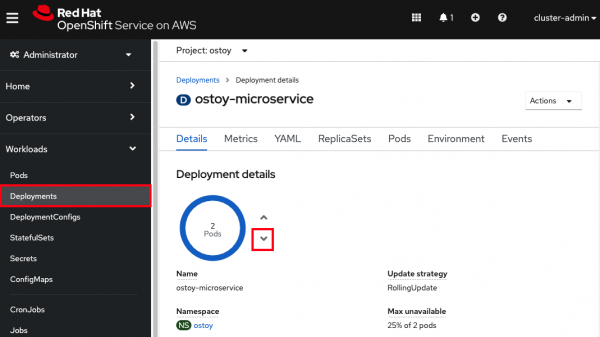
Figure 20. Screenshot of Openshift console showing Deployment details of how many pods are currently available with downward pointing button highlighted for scaling down. - See this visually by visiting the OSToy app and counting the number of boxes; it should be one.
- You can also confirm this via the CLI or the web console.

Pod autoscaling
In this section, we will explore how to use the horizontal pod autoscaler (HPA) in Kubernetes/OpenShift. See here for cluster autoscaling in OpenShift Service on AWS.
As defined in the documentation:
"[...] you can use a horizontal pod autoscaler (HPA) to specify how OpenShift Container Platform should automatically increase or decrease the scale of a replication controller or deployment configuration, based on metrics collected from the pods that belong to that replication controller or deployment configuration."
In simple words: "if there is a lot of work, make more pods"
We will create an HPA and then use OSToy to generate CPU-intensive workloads. We will then observe how the HPA will scale up the number of pods in order to handle the increased workloads.
1. Create the horizontal pod autoscaler
Run the following command to create the autoscaler: This will create an HPA that maintains between 1 and 10 replicas of the Pods controlled by the ostoy-microservice Deployment. Roughly speaking, the HPA will increase and decrease the number of replicas (via the deployment) to maintain an average CPU utilization across all pods of 80% (because each pod requests 50 millicores, this means average CPU usage of 40 millicores).
oc autoscale deployment/ostoy-microservice --cpu-percent=80 --min=1 --max=10
2. View the current number of pods
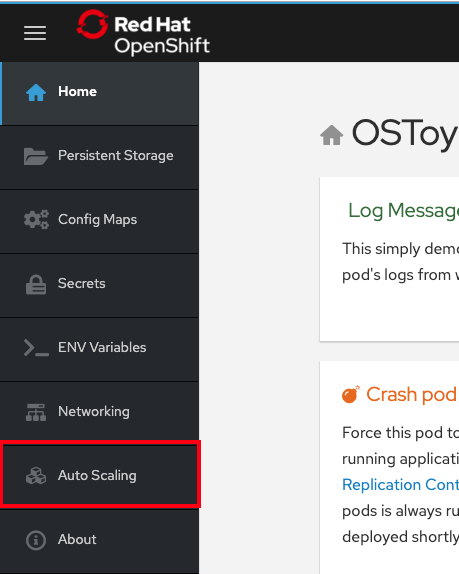
In the OSToy app in the left menu click Autoscaling to access this portion of the workshop (see Figure 21).
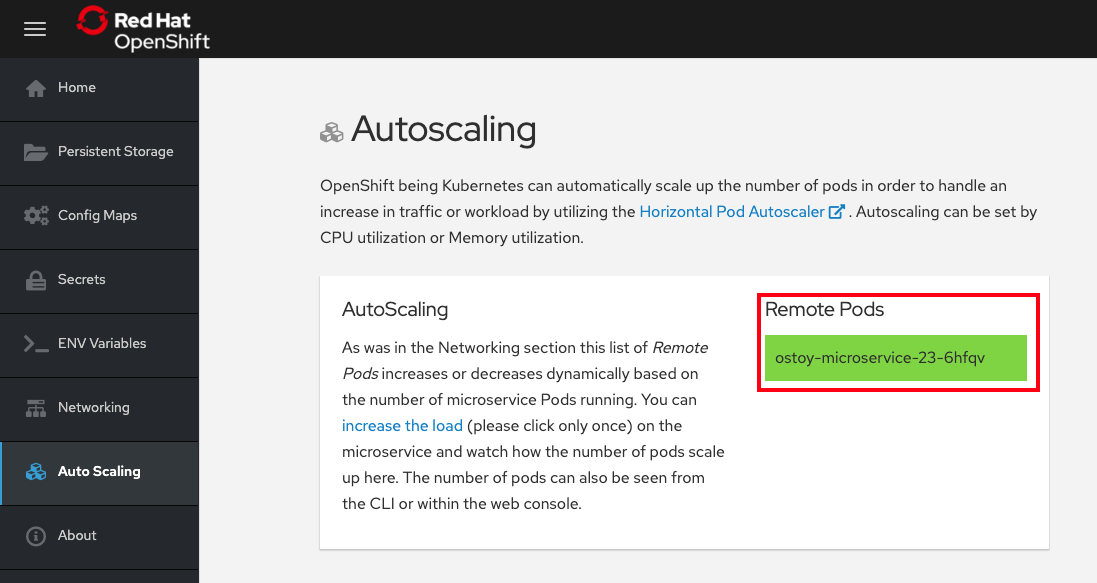
As in the networking section, you will see the total number of pods available for the microservice represented by the number of colored boxes. In this case, we have only one. You can verify this through the web console or from the CLI.
You can use the following command to see the running microservice pods only:
oc get pods --field-selector=status.phase=Running | grep microservice
or visually in our application (Figure 22):
3. Increase the load
Now that we know that we only have one pod, let's increase the workload that the pod needs to perform. Click the link in the center of the card that says "increase the load." Be sure to click only once!
This will generate some CPU-intensive calculations. (If you are curious about what it is doing, you can view the code here).
Note: The page might become slightly unresponsive. This is normal, so be patient while the new pods spin up.
4. See the pods scale up
After about a minute, the new pods will show up on the page (represented by the colored rectangles). Confirm that the pods did indeed scale up through the OpenShift web console or the CLI (you can use the command in step 2).
Note: The page may still lag a bit which is normal.
5. Review metrics with observability
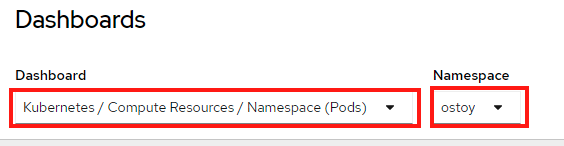
In the OpenShift web console left menu, click on Observe → Dashboards
In the dashboard, select Kubernetes / Compute Resources / Namespace (Pods) and our namespace ostoy.
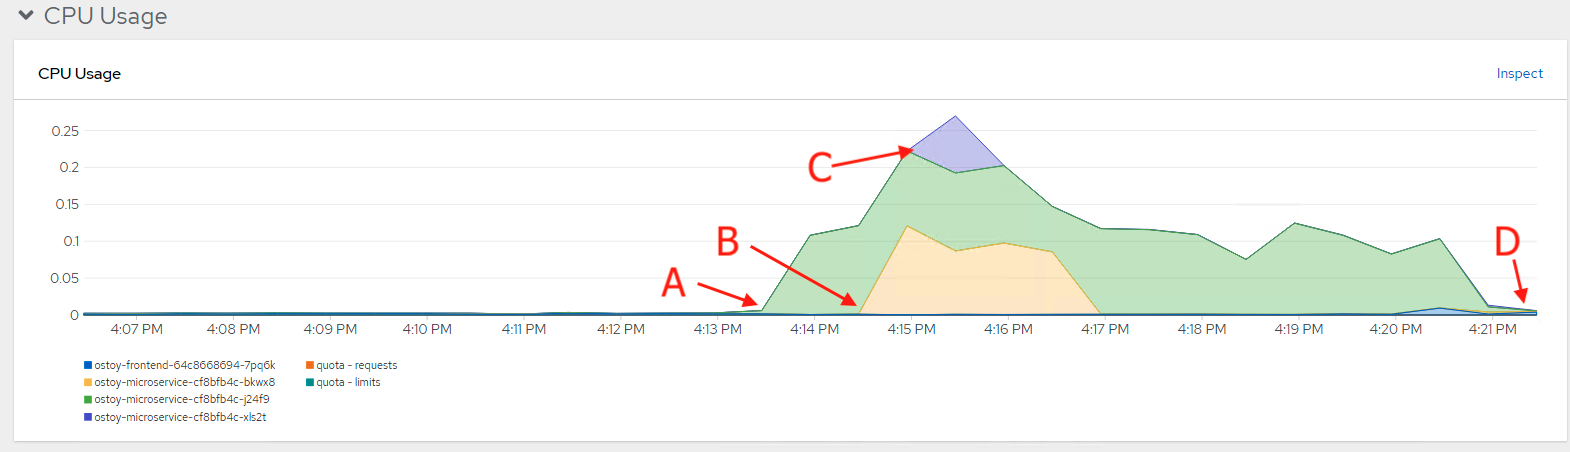
Wait a few minutes, and colorful graphs will appear showing resource usage across CPU and memory. The top graph shows recent CPU consumption per pod, and the lower graph indicates memory usage. Looking at the graph in Figure 24, you can see how things developed. As soon as the load started to increase (A), two new pods started to spin up (B, C). The thickness of each graph is its CPU consumption indicating which pods handled more load. We also see that the load decreased (D), after which, the pods were spun back down.
Node autoscaling
In OpenShift Service on AWS, you can also define node autoscaling. You can also visit the node autoscaling section of this workshop for more information.
Before proceeding in this section, ensure that at least one machine pool has autoscaling enabled; otherwise, these steps will not work.
1. Enable autoscaling nodes on the machine pool
If you have not already enabled autoscaling on a machine pool, then follow the steps in the Setting up cluster autoscaling section to either enable autoscaling on an existing machine pool or create a new one with autoscaling enabled.
2. Test the cluster autoscaler
Create a new project where we will define a job with a load that this cluster cannot handle. This should force the cluster to automatically create new nodes to handle the load.
Create a new project called autoscale-ex:
oc new-project autoscale-ex
Create the job
oc create -f https://raw.githubusercontent.com/openshift/training/master/assets/job-work-queue.yaml
After a few seconds, run the following to see what pods have been created.
$ oc get pods
NAME                     READY   STATUS    RESTARTS   AGE
work-queue-5x2nq-24xxn   0/1     Pending   0          10s
work-queue-5x2nq-57zpt   0/1     Pending   0          10s
work-queue-5x2nq-58bvs   0/1     Pending   0          10s
work-queue-5x2nq-6c5tl   1/1     Running   0          10s
work-queue-5x2nq-7b84p   0/1     Pending   0          10s
work-queue-5x2nq-7hktm   0/1     Pending   0          10s
work-queue-5x2nq-7md52   0/1     Pending   0          10s
work-queue-5x2nq-7qgmp   0/1     Pending   0          10s
work-queue-5x2nq-8279r   0/1     Pending   0          10s
work-queue-5x2nq-8rkj2   0/1     Pending   0          10s
work-queue-5x2nq-96cdl   0/1     Pending   0          10s
work-queue-5x2nq-96tfr   0/1     Pending   0          10s
We see a lot of pods in a pending state. This should trigger the autoscaler to create more nodes in our machine pool.
After a few minutes, let's check how many worker nodes we have.
$ oc get nodes
NAME                                         STATUS   ROLES          AGE     VERSION
ip-10-0-138-106.us-west-2.compute.internal   Ready    infra,worker   22h     v1.23.5+3afdacb
ip-10-0-153-68.us-west-2.compute.internal    Ready    worker         2m12s   v1.23.5+3afdacb
ip-10-0-165-183.us-west-2.compute.internal   Ready    worker         2m8s    v1.23.5+3afdacb
ip-10-0-176-123.us-west-2.compute.internal   Ready    infra,worker   22h     v1.23.5+3afdacb
ip-10-0-195-210.us-west-2.compute.internal   Ready    master         23h     v1.23.5+3afdacb
ip-10-0-196-84.us-west-2.compute.internal    Ready    master         23h     v1.23.5+3afdacb
ip-10-0-203-104.us-west-2.compute.internal   Ready    worker         2m6s    v1.23.5+3afdacb
ip-10-0-217-202.us-west-2.compute.internal   Ready    master         23h     v1.23.5+3afdacb
ip-10-0-225-141.us-west-2.compute.internal   Ready    worker         23h     v1.23.5+3afdacb
ip-10-0-231-245.us-west-2.compute.internal   Ready    worker         2m11s   v1.23.5+3afdacb
ip-10-0-245-27.us-west-2.compute.internal    Ready    worker         2m8s    v1.23.5+3afdacb
ip-10-0-245-7.us-west-2.compute.internal     Ready    worker         23h     v1.23.5+3afdacb
We can see that more worker nodes were automatically created to handle the workload.
You are now ready to learn how to handle logging within your OpenShift Service on AWS cluster.
Get more support
- Red Hat OpenShift Service on AWS frequently asked questions
- Troubleshoot with Red Hat support
- Troubleshoot with AWS support
More OpenShift resources
- Build, run, and scale container-based applications
- OpenShift for Developers e-book
- OpenShift interactive learning paths
- Explore more OpenShift on AWS learning materials