Page
How to manage logging within clusters on Red Hat OpenShift Service on AWS
In this section, we will examine the available options for logging in to Red Hat OpenShift Service on AWS (ROSA). OpenShift Service on AWS does not come preconfigured with a logging solution, but we can easily set one up.
First, we'll review the install procedure for the EFK (Elasticsearch, Fluentd, and Kibana) stack (via Operators); then we will take a look at three methods you can use to view logs:
- We will look at the logs directly through the pod using oc logs.
- We will forward the logs to AWS CloudWatch and view them from there.
- We will use Kibana (EFK Stack) to search our logs.
The cluster logging components are based upon Fluentd, (and Elasticsearch and Kibana, if deployed). The collector, Fluentd, is deployed to each node in the cluster. It collects application logs and writes them to Elasticsearch or forwards them to Amazon CloudWatch. Kibana is the centralized web UI where users and administrators can create rich visualizations and dashboards with the aggregated data. We will also look at using CloudWatch.
- Learn more about logging in OpenShift.
- Learn more about the logging add-on service.
What will you learn?
- Installing cluster logging add-on service
- Viewing application logs with different viewers
- Filtering data
What do you need before starting?
- Successfully deployed application on an OpenShift Service on AWS cluster
Steps for logging within an OpenShift Service on AWS cluster
Installing the cluster logging add-on service
Note: If you plan on running EFK, do not follow the installation steps in this section. Instead, follow the Installing OpenShift Logging steps and skip down to View logs with Kibana.
Use the following steps to install the logging add-on service to forward our logs, in our case to CloudWatch. If you did not follow the "Getting Started" guide of this workshop and did not install OpenShift Service on AWS with STS, you can skip to install the service through the OCM UI or by using the CLI (in step 8). Otherwise, there are a few steps we need to do first in order to get this to work for OpenShift Service on AWS with STS.
Note: These steps were adapted from our Managed OpenShift Black Belts.
- Create an IAM trust policy document.
cat << EOF > /tmp/trust-policy.json
{
    "Version": "2012-10-17",
    "Statement": [
        {
            "Effect": "Allow",
            "Action": [
                "logs:CreateLogGroup",
                "logs:CreateLogStream",
                "logs:DescribeLogGroups",
                "logs:DescribeLogStreams",
                "logs:PutLogEvents",
                "logs:GetLogEvents",
                "logs:PutRetentionPolicy",
                "logs:GetLogRecord"
            ],
            "Resource": "arn:aws:logs:*:*:*"
        }
    ]
}
EOF
2. Create the IAM policy.
POLICY_ARN=$(aws iam create-policy --policy-name "RosaCloudWatchAddon" --policy-document file:///tmp/trust-policy.json --query Policy.Arn --output text)

echo $POLICY_ARN
3. Create a service account.
aws iam create-user --user-name RosaCloudWatchAddon --query User.Arn --output text
4. Attach the policy to the user:
aws iam attach-user-policy --user-name RosaCloudWatchAddon --policy-arn ${POLICY_ARN}
5. Create an AccessKeyId and a SecretAccessKey:
aws iam create-access-key --user-name RosaCloudWatchAddon
6. Save the output to the following environment variables:
export AWS_ID=<from above>
export AWS_KEY=<from above>
7. Create a Secret for the add-on to use:
cat << EOF | kubectl apply -f -
apiVersion: v1
kind: Secret
metadata:
 name: instance
 namespace: openshift-logging
stringData:
  aws_access_key_id: ${AWS_ID}
  aws_secret_access_key: ${AWS_KEY}
EOF
8. Access the OCM UI, select your cluster, and click on the Add-ons tab.
9. Select the Cluster Logging Operator (Figure 25).
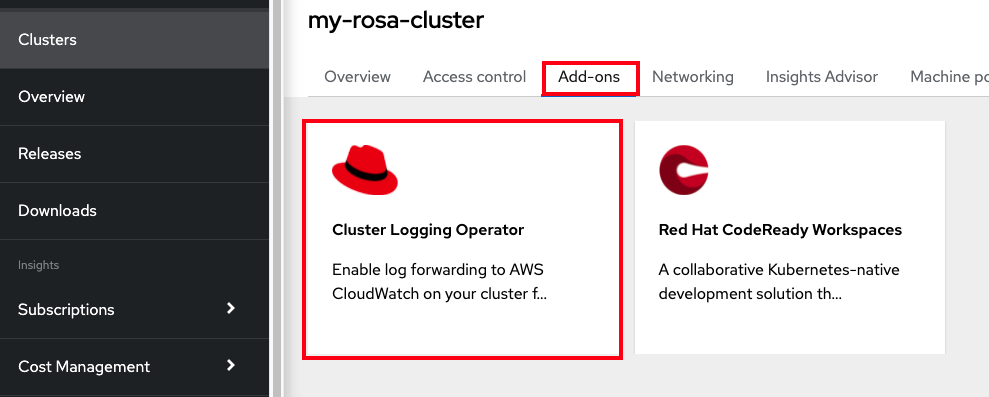
10. Click Install.
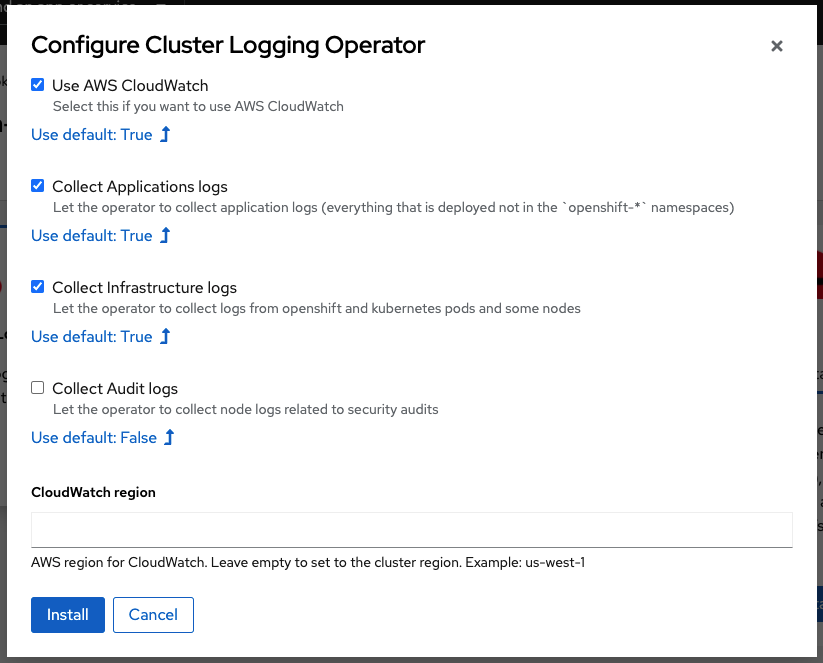
11. Select the logs you want to collect, as shown in Figure 26. If you want to forward somewhere other than CloudWatch leave that box unchecked. You can select the defaults and leave the region blank (unless you want to use a different region). Click Install.
12. It will take about 10 minutes to install.
Output data to the streams/logs
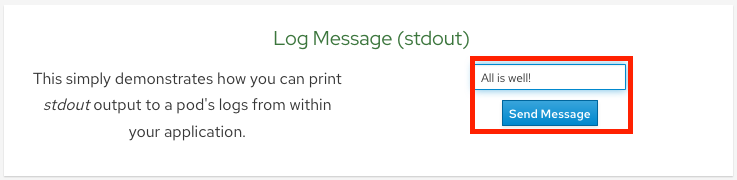
- Output a message to stdout. Click on the Home menu item then click in the message box for Log Message (stdout) and write any message you want to output to the stdout stream. You can try "All is well!". Then click Send Message.
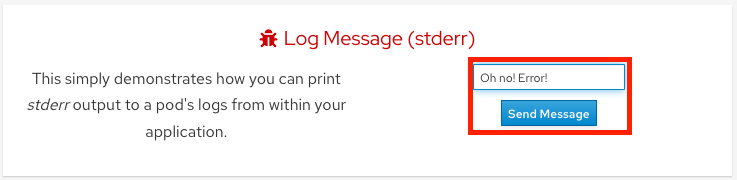
- Output a message to stderr. Click in the message box for Log Message (stderr) and write any message you want to output to the stderr stream. You can try "Oh no! Error!". Then click Send Message.
View application logs using oc
- Go to the CLI and enter the following command to retrieve the name of your frontend pod which we will use to view the pod logs:
$ oc get pods -o name
pod/ostoy-frontend-679cb85695-5cn7x
pod/ostoy-microservice-86b4c6f559-p594d
So the pod name in this case is ostoy-frontend-679cb85695-5cn7x.
- Run oc logs ostoy-frontend-679cb85695-5cn7x and you should see your messages:
$ oc logs ostoy-frontend-679cb85695-5cn7x
[...]
ostoy-frontend-679cb85695-5cn7x: server starting on port 8080
Redirecting to /home
stdout: All is well!
stderr: Oh no! Error!
You should see both the stdout and stderr messages.
View logs with CloudWatch
- Access the web console for your AWS account and go to CloudWatch.
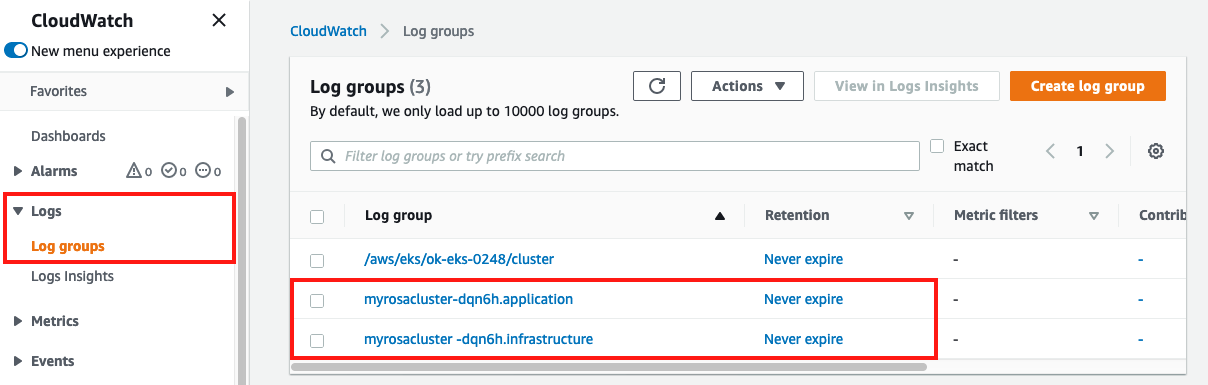
- Click on Logs → Log groups in the left menu to see the different groups of logs depending on what you selected during installation. If you followed the previous steps you should see two groups: one for <cluster-name>-XXXXX-application and one for <cluster-name>-XXXXX-infrastructure (See Figure 30).
- Click on <cluster-name>-XXXXX.application
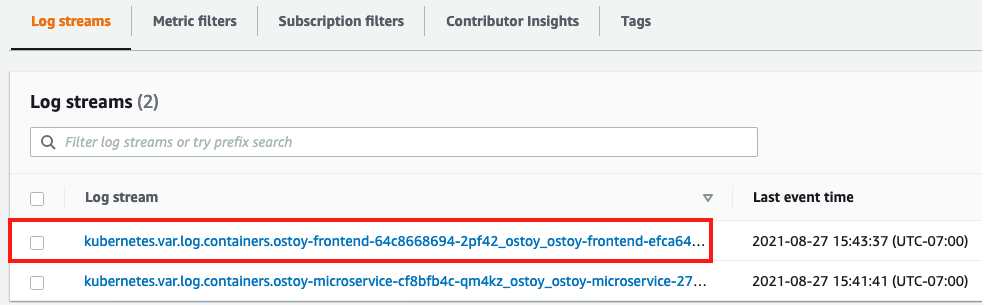
- Click on the log stream for the "frontend" pod. It will be titled something like this: kubernetes.var[...]ostoy-frontend-[...]
- Filter for "stdout" and "stderr" (Figure 32); then expand the row to show the message you entered earlier along with other information.

- We can also see other messages in our logs from the app. Enter "microservice" in the search bar, and expand one of the entries (Figure 33). This shows us the color received from the microservice and which pod sent that color to our frontend pod.

You can also use some of the other features of CloudWatch to obtain useful information. But how to use CloudWatch is beyond the scope of this tutorial.
View logs with Kibana
Note: In order to use EFK, this section assumes that you have successfully completed the steps outlined in Installing OpenShift Logging.
- Run the following command to get the route for the Kibana console:
oc get route -n openshift-logging
- Open up a new browser tab and paste the URL. You will first have to define index patterns. Please see the Defining Kibana index patterns section of the documentation for further instructions on doing so.
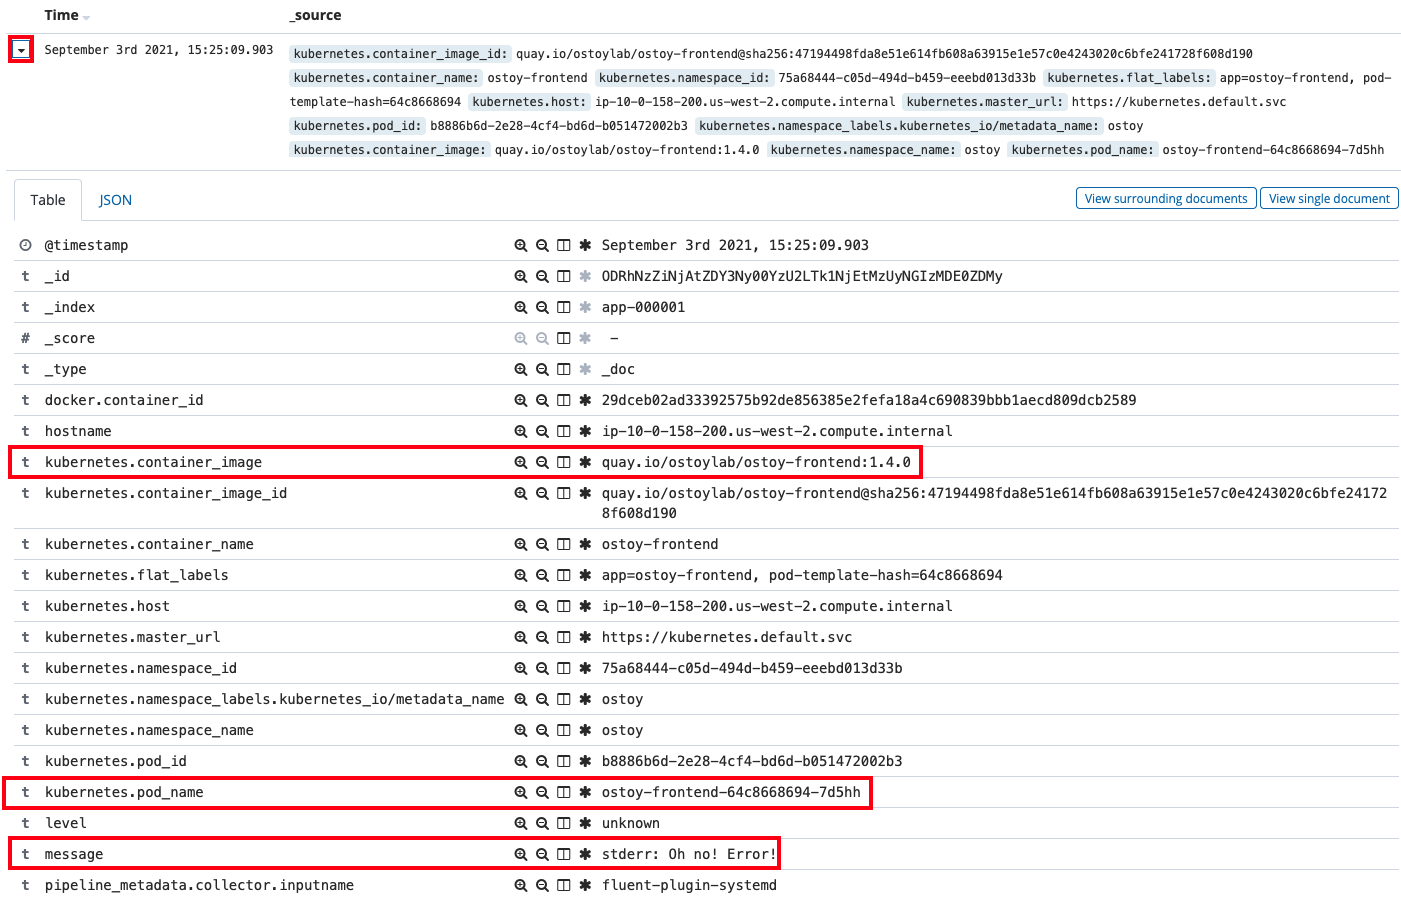
Familiarization with the data
In the main part of the console, you should see three entries. These will contain what we saw in the above section (viewing through the pods). You will see the stdout and stderr messages that we inputted earlier (though you may not see it right away as we might have to filter for it). In addition to the log output, you will see information about each entry. You can see things like:
- namespace name
- pod name
- host ip address
- timestamp
- log level
- message
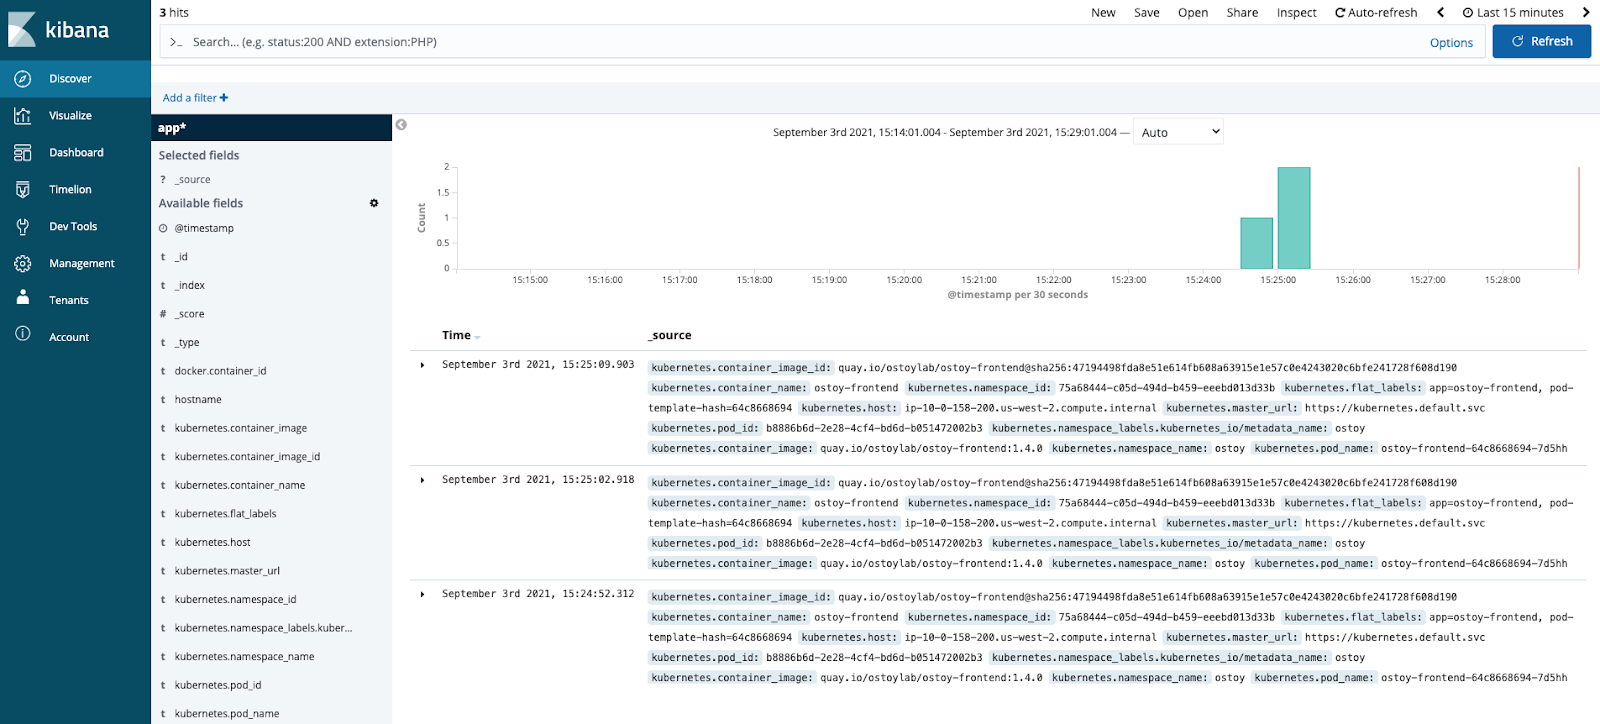
You will also see that there is data from multiple sources and multiple messages. If we expand one of the twisty-ties we can see further details
Filtering Results
Let's look for any errors encountered in our app. Since we have many log entries (most from the previous networking section) we may need to filter to make it easier to find the errors. To find the error message we outputted to stderr lets create a filter.
- Click on "Add a filter+" under the search bar on the upper left.
- For "Fields..." select (or type) "level".
- For "Operators" select "is".
- In "Value..." type in "err".
- Click "Save".
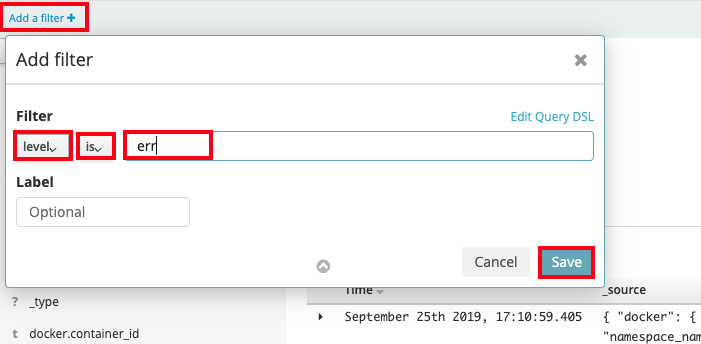
You should see now only one row is returned that contains our error message.
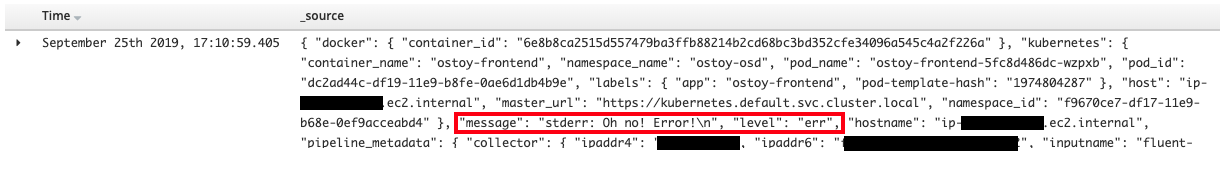
Note: If nothing is returned, depending on how much time has elapsed since you've outputted the messages to the stdout and stderr streams you may need to set the proper time frame for the filter. If you are following this lab consistently then the default should be fine. Otherwise, in the Kibana console click on the top right where it should say "Last 15 minutes" and click on "Quick" then "Last 1 hour" (though adjust to your situation as needed).
Get more support
- Red Hat OpenShift Service on AWS frequently asked questions
- Troubleshoot with Red Hat support
- Troubleshoot with AWS support