Redhat Developers  Logo
  • Products

    Featured

    • Red Hat Enterprise Linux
      Red Hat Enterprise Linux Icon
    • Red Hat OpenShift AI
      Red Hat OpenShift AI
    • Red Hat Enterprise Linux AI
      Linux icon inside of a brain
    • Image mode for Red Hat Enterprise Linux
      RHEL image mode
    • Red Hat OpenShift
      Openshift icon
    • Red Hat Ansible Automation Platform
      Ansible icon
    • Red Hat Developer Hub
      Developer Hub
    • View All Red Hat Products
    • Linux

      • Red Hat Enterprise Linux
      • Image mode for Red Hat Enterprise Linux
      • Red Hat Universal Base Images (UBI)
    • Java runtimes & frameworks

      • JBoss Enterprise Application Platform
      • Red Hat build of OpenJDK
    • Kubernetes

      • Red Hat OpenShift
      • Microsoft Azure Red Hat OpenShift
      • Red Hat OpenShift Virtualization
      • Red Hat OpenShift Lightspeed
    • Integration & App Connectivity

      • Red Hat Build of Apache Camel
      • Red Hat Service Interconnect
      • Red Hat Connectivity Link
    • AI/ML

    • Automation

      • Red Hat Ansible Automation Platform
      • Red Hat Ansible Lightspeed
    • Developer tools

      • Red Hat Trusted Software Supply Chain
      • Podman Desktop
      • Red Hat OpenShift Dev Spaces
    • Developer Sandbox

      Developer Sandbox
      Try Red Hat products and technologies without setup or configuration fees for 30 days with this shared Openshift and Kubernetes cluster.
    • Try at no cost
  • Technologies

    Featured

    • AI/ML
      AI/ML Icon
    • Linux
      Linux Icon
    • Kubernetes
      Cloud icon
    • Automation
      Automation Icon showing arrows moving in a circle around a gear
    • View All Technologies
    • Programming Languages & Frameworks

      • Java
      • Python
      • JavaScript
    • System Design & Architecture

      • Red Hat architecture and design patterns
      • Microservices
      • Event-Driven Architecture
      • Databases
    • Developer Productivity

      • Developer productivity
      • Developer Tools
      • GitOps
    • Secure Development & Architectures

      • Security
      • Secure coding
    • Platform Engineering

      • DevOps
      • DevSecOps
      • Ansible automation for applications and services
    • Automated Data Processing

      • AI/ML
      • Data Science
      • Apache Kafka on Kubernetes
      • View All Technologies
    • Start exploring in the Developer Sandbox for free

      sandbox graphic
      Try Red Hat's products and technologies without setup or configuration.
    • Try at no cost
  • Learn

    Featured

    • Kubernetes & Cloud Native
      Openshift icon
    • Linux
      Rhel icon
    • Automation
      Ansible cloud icon
    • Java
      Java icon
    • AI/ML
      AI/ML Icon
    • View All Learning Resources

    E-Books

    • GitOps Cookbook
    • Podman in Action
    • Kubernetes Operators
    • The Path to GitOps
    • View All E-books

    Cheat Sheets

    • Linux Commands
    • Bash Commands
    • Git
    • systemd Commands
    • View All Cheat Sheets

    Documentation

    • API Catalog
    • Product Documentation
    • Legacy Documentation
    • Red Hat Learning

      Learning image
      Boost your technical skills to expert-level with the help of interactive lessons offered by various Red Hat Learning programs.
    • Explore Red Hat Learning
  • Developer Sandbox

    Developer Sandbox

    • Access Red Hat’s products and technologies without setup or configuration, and start developing quicker than ever before with our new, no-cost sandbox environments.
    • Explore Developer Sandbox

    Featured Developer Sandbox activities

    • Get started with your Developer Sandbox
    • OpenShift virtualization and application modernization using the Developer Sandbox
    • Explore all Developer Sandbox activities

    Ready to start developing apps?

    • Try at no cost
  • Blog
  • Events
  • Videos

Observability signal correlation for Red Hat OpenShift: Technology preview

September 19, 2024
Vanessa Martini Alan Conway
Related topics:
ContainersHybrid CloudKubernetesObservabilityOpen sourceOperators
Related products:
Red Hat OpenShiftRed Hat OpenShift Container Platform

Share:

    Observability signal correlation for Red Hat OpenShift has now been released as a technology preview and is available as part of the latest Cluster Observability Operator 0.4.0 release. The backend of observability signal correlation is powered by Korrel8r—open source observability project founded within Red Hat—aimed at providing a set of rules for easily correlating metrics, logs, alerts, netflows, and additional observability signals and resources across different data stores. 

    The output of Korrel8r is displayed in the form of a node graph in a dedicated troubleshooting panel that Red Hat OpenShift users can trigger within the OpenShift web console. The panel is interactive, which allows users—by clicking each node—to be automatically redirected to the relevant web console UI that displays that specific information (e.g., metric, log, pod, etc.). 

    Back in July, an enhanced developer preview of observability signal correlation was made available to OpenShift users with the Cluster Observability Operator 0.3.0 release. This developer preview specifically included a troubleshooting panel ONLY accessible by navigating to Observe > Alerting UI of the OpenShift web console. Nevertheless, with the latest technology preview release, a series of enhancements have now improved usability and eased data exploration tasks. 

    As of today, key new functionalities include: 

    • An improved troubleshooting panel that provides OpenShift users with the possibility to select and focus on a specific starting signal.

    • More visibility into Korrel8r’s queries with the option of selecting the depth.

    • Enhanced usability as the observability signal correlation’s troubleshooting panel can be triggered from the application launcher menu in the masthead of the OpenShift web console—without needing to access the Observe > Alerting UI.

    Disclaimer:

    This third functionality (enhanced usability) is tied to the release of OpenShift 4.17. Note that OpenShift 4.16 users can still make use of the troubleshooting panel by triggering it in the Observe>Alerting UI, as described in the enhanced developer preview dedicated blog. 

    Technology preview: Everything you need to know

    With this introduction in mind, let’s deep dive into the details of this technology preview release. 

    Getting started

    To make use of observability signal correlation’s latest functionalities, OpenShift users need to:

    1. Install the Cluster Observability Operator 0.4.0 version.
    2. Deploy an OpenShift 4.17 cluster to be able to launch the troubleshooting panel from an application launcher button at the top of the OpenShift web console’s masthead.
    3. Install OpenShift Network Observability to visualize correlated netflows.
    4. Install OpenShift Logging to visualize correlated logs.

    Note:

    The troubleshooting panel displays the observability signals/resources that are installed for your OpenShift cluster. K8s resources, alerts, and metrics are always available as part of the Red Hat OpenShift Container Platform. Other signals are optional.

    Focus functionality 

    With the technology preview release of observability signal correlation, OpenShift users can now make use of a Focus functionality directly in the Troubleshooting side panel. What does it entail? 

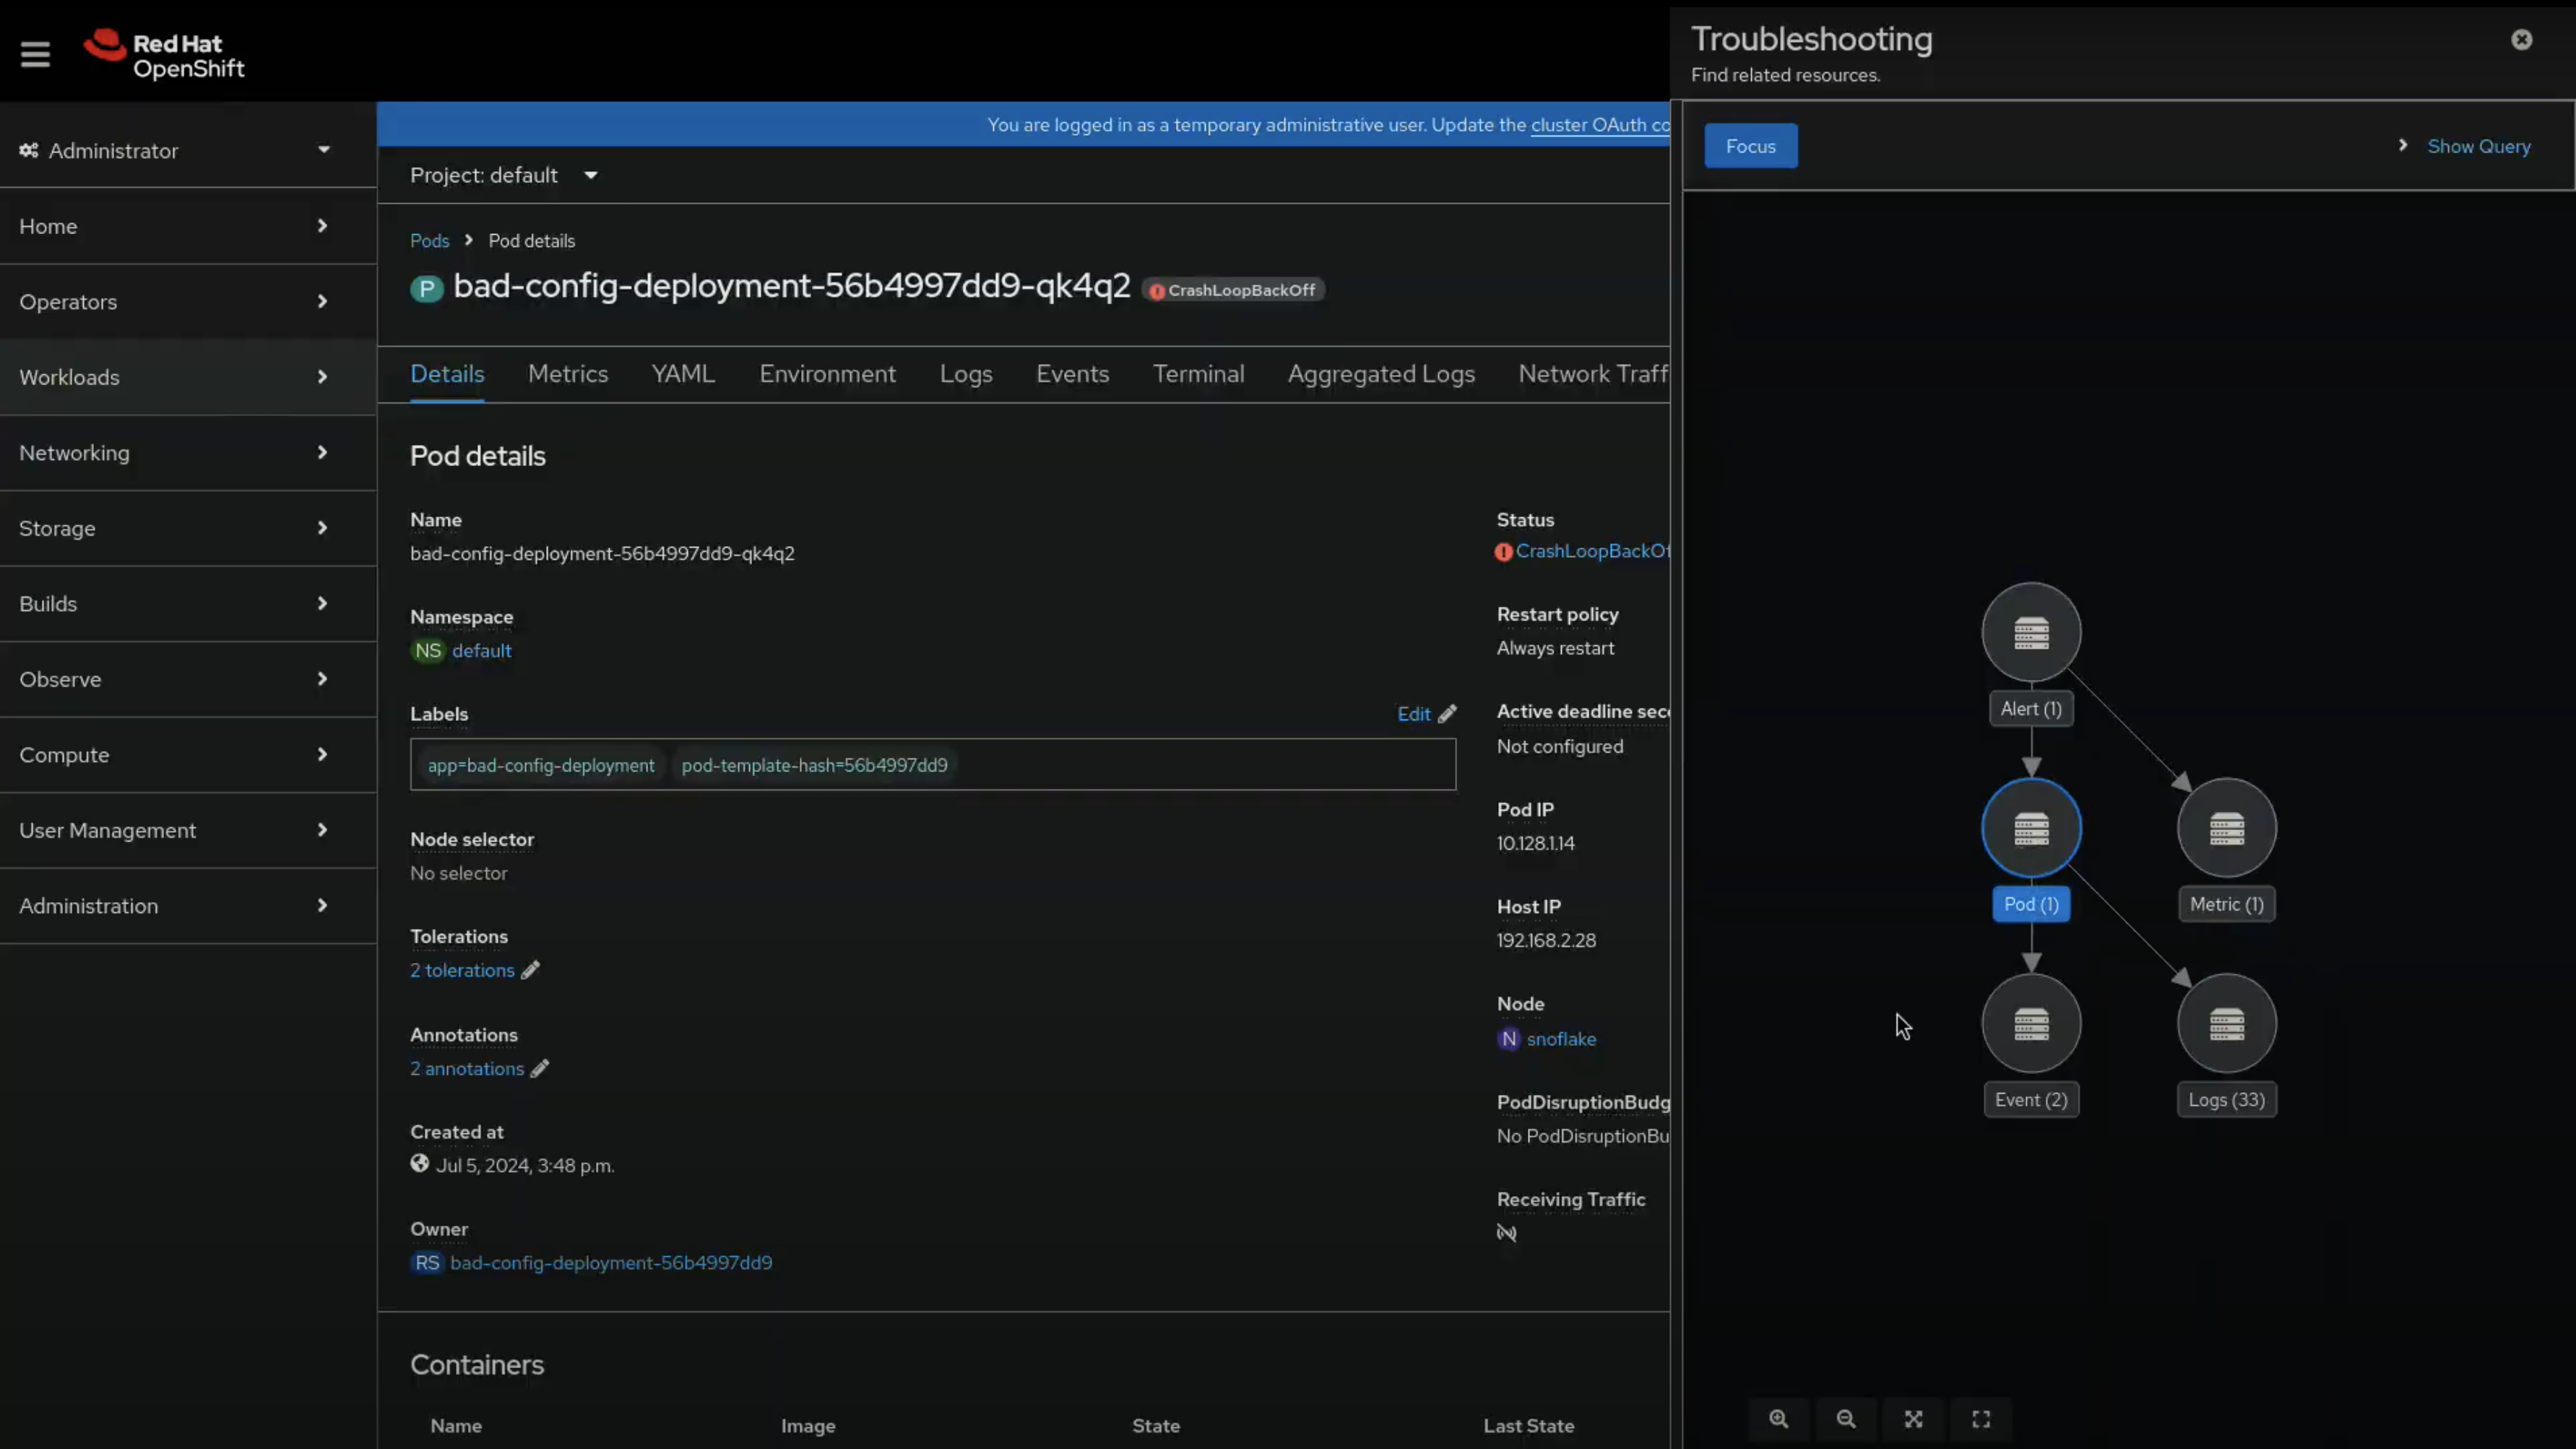
    The default display of observability signal correlation’s output is a neighborhood graph of the resources/signals currently displayed in a dedicated troubleshooting panel (see Figure 1). Specifically, the neighborhood graph starts at the current resource—in this case an alert—and it includes related objects up to 3 steps away from the starting signal.

    A view of Observability signal correlation's troubleshooting panel with the navigation menu on the left.
    Figure 1: Observability signal correlation’s troubleshooting panel - neighbourhood graph.
    Figure 1: Observability signal correlation's troubleshooting panel—neighborhood graph.

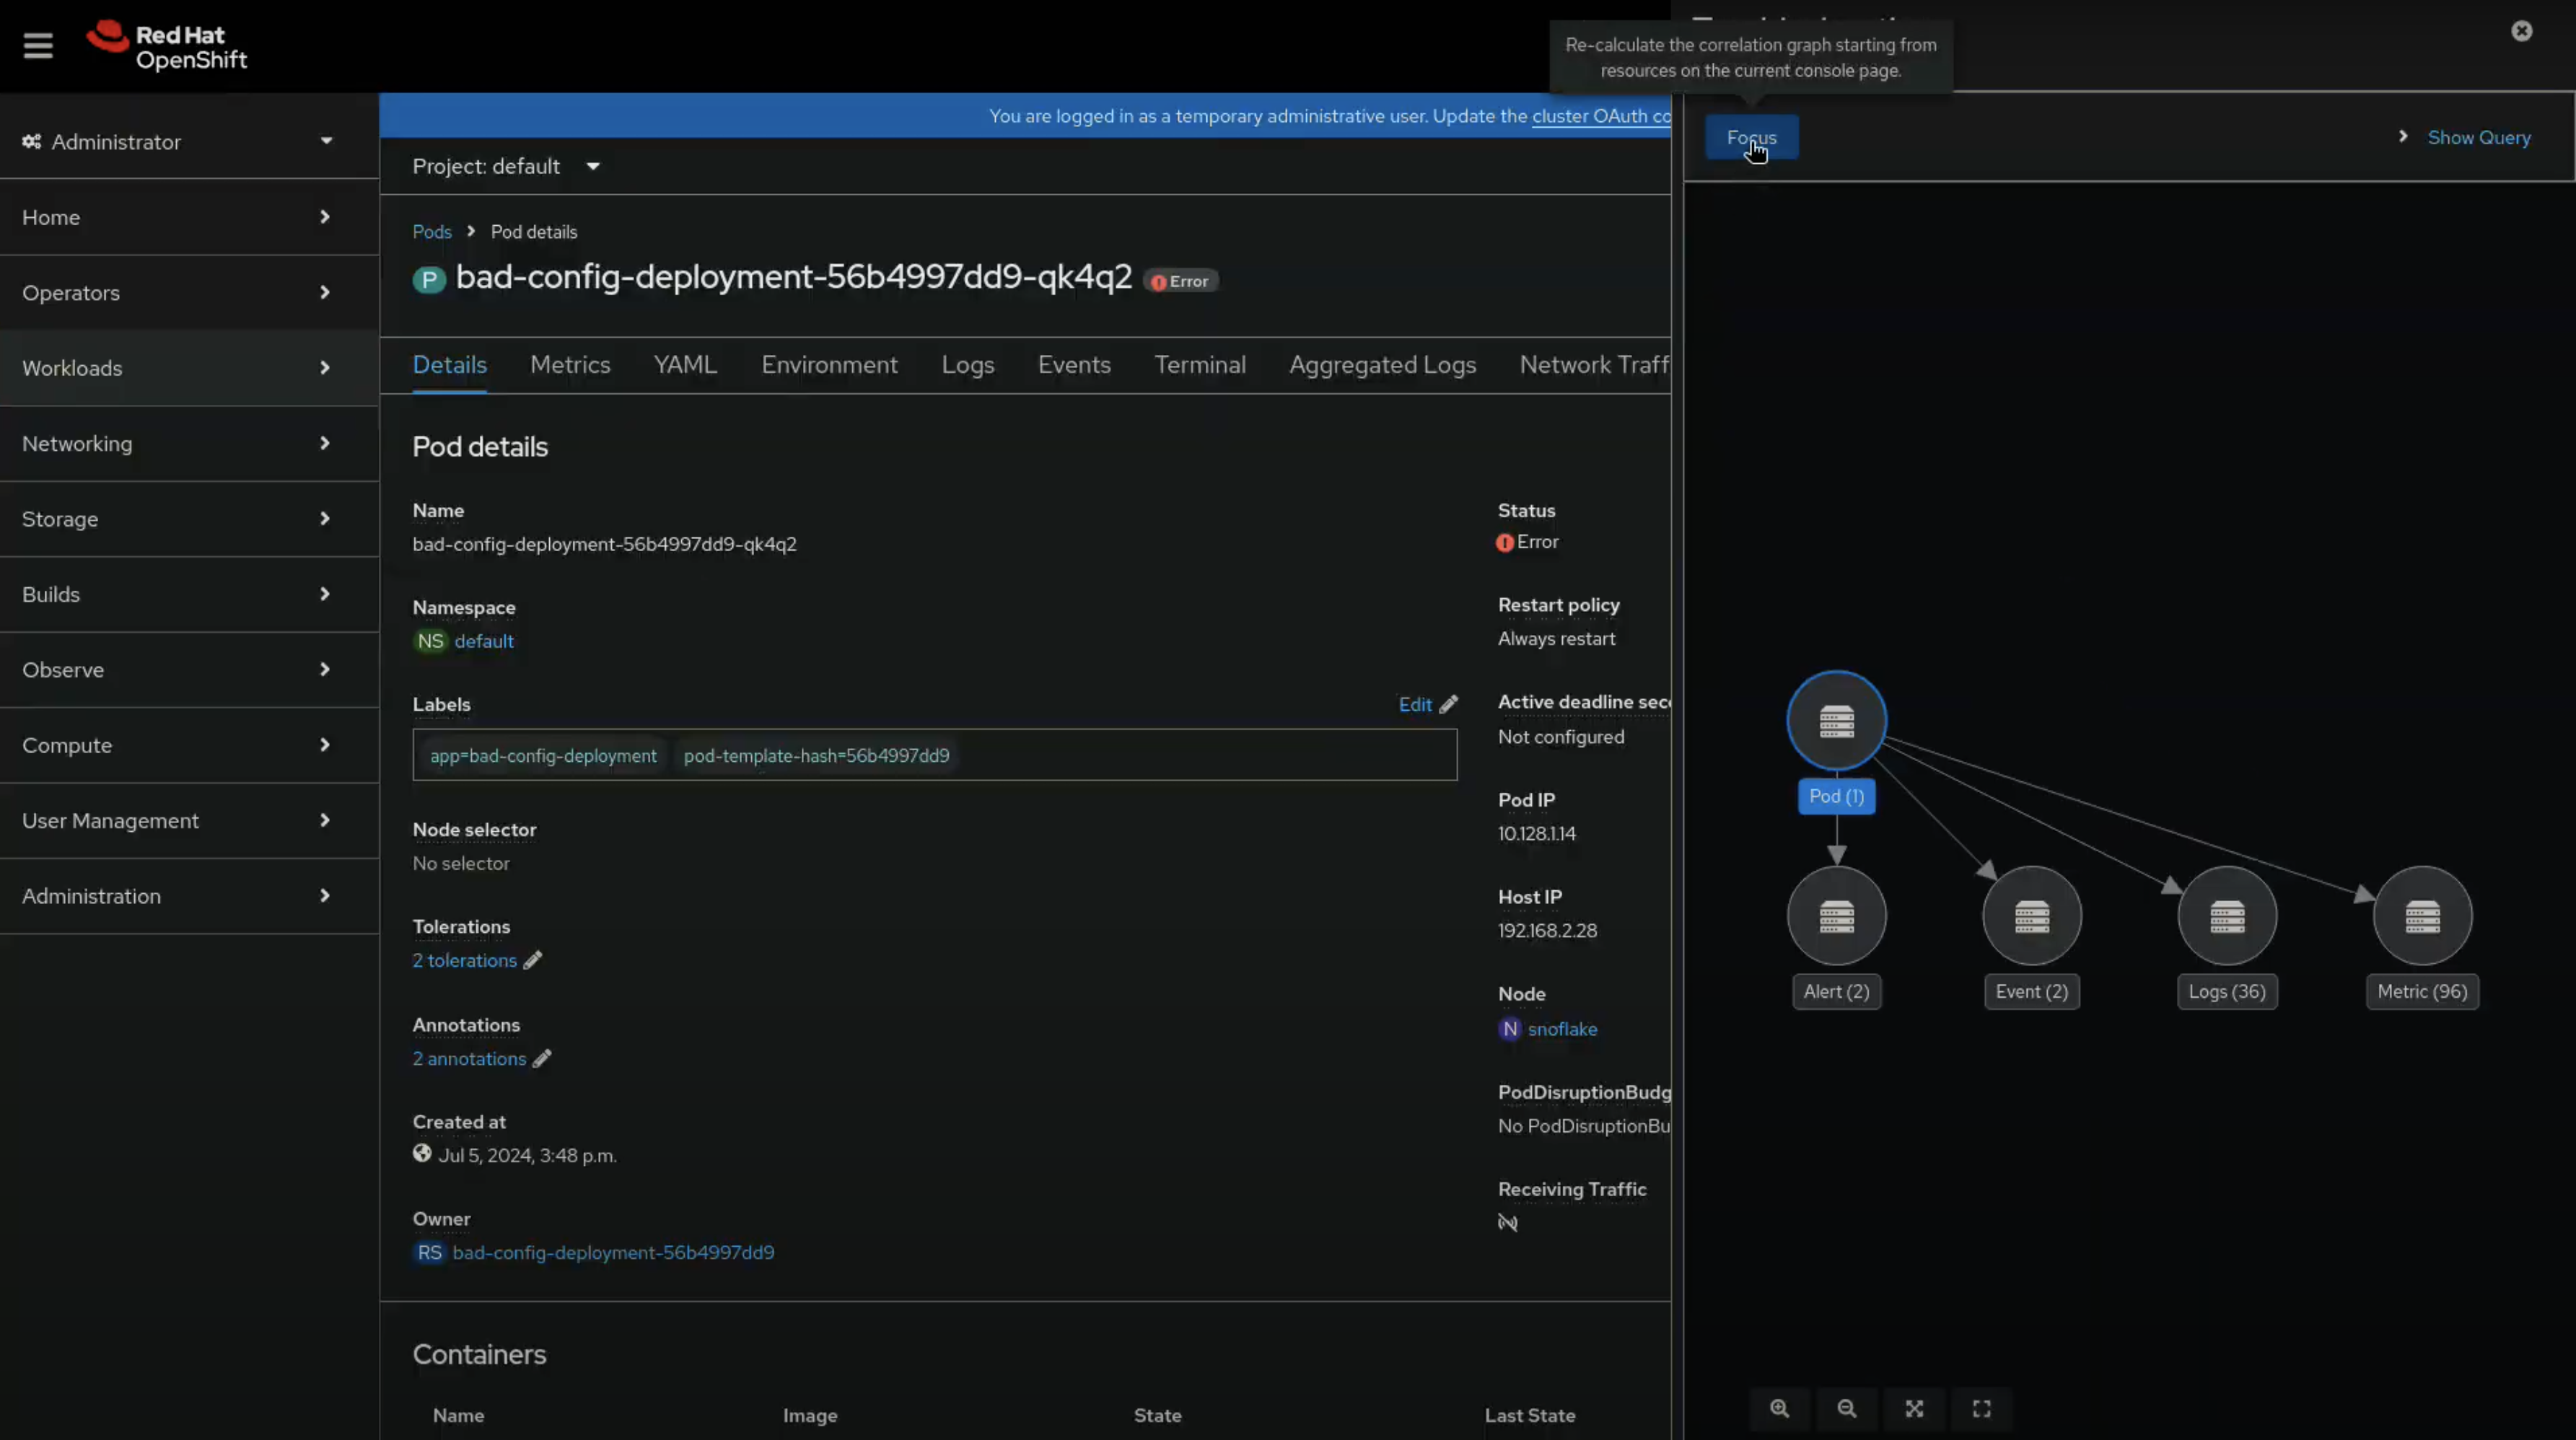
    Nonetheless, the brand new Focus functionality allows users to easily switch the starting signal and gain new perspectives depending on the troubleshooting questions that need to be answered (see Figure 2). 

    A view of Observability signal correlation's troubleshooting panel with the navigation menu on the left and the Focus button shown on the right.
    Figure 2: Observability signal correlation’s troubleshooting panel - Focus button.
    Figure 2: Observability signal correlation's troubleshooting panel—Focus button.

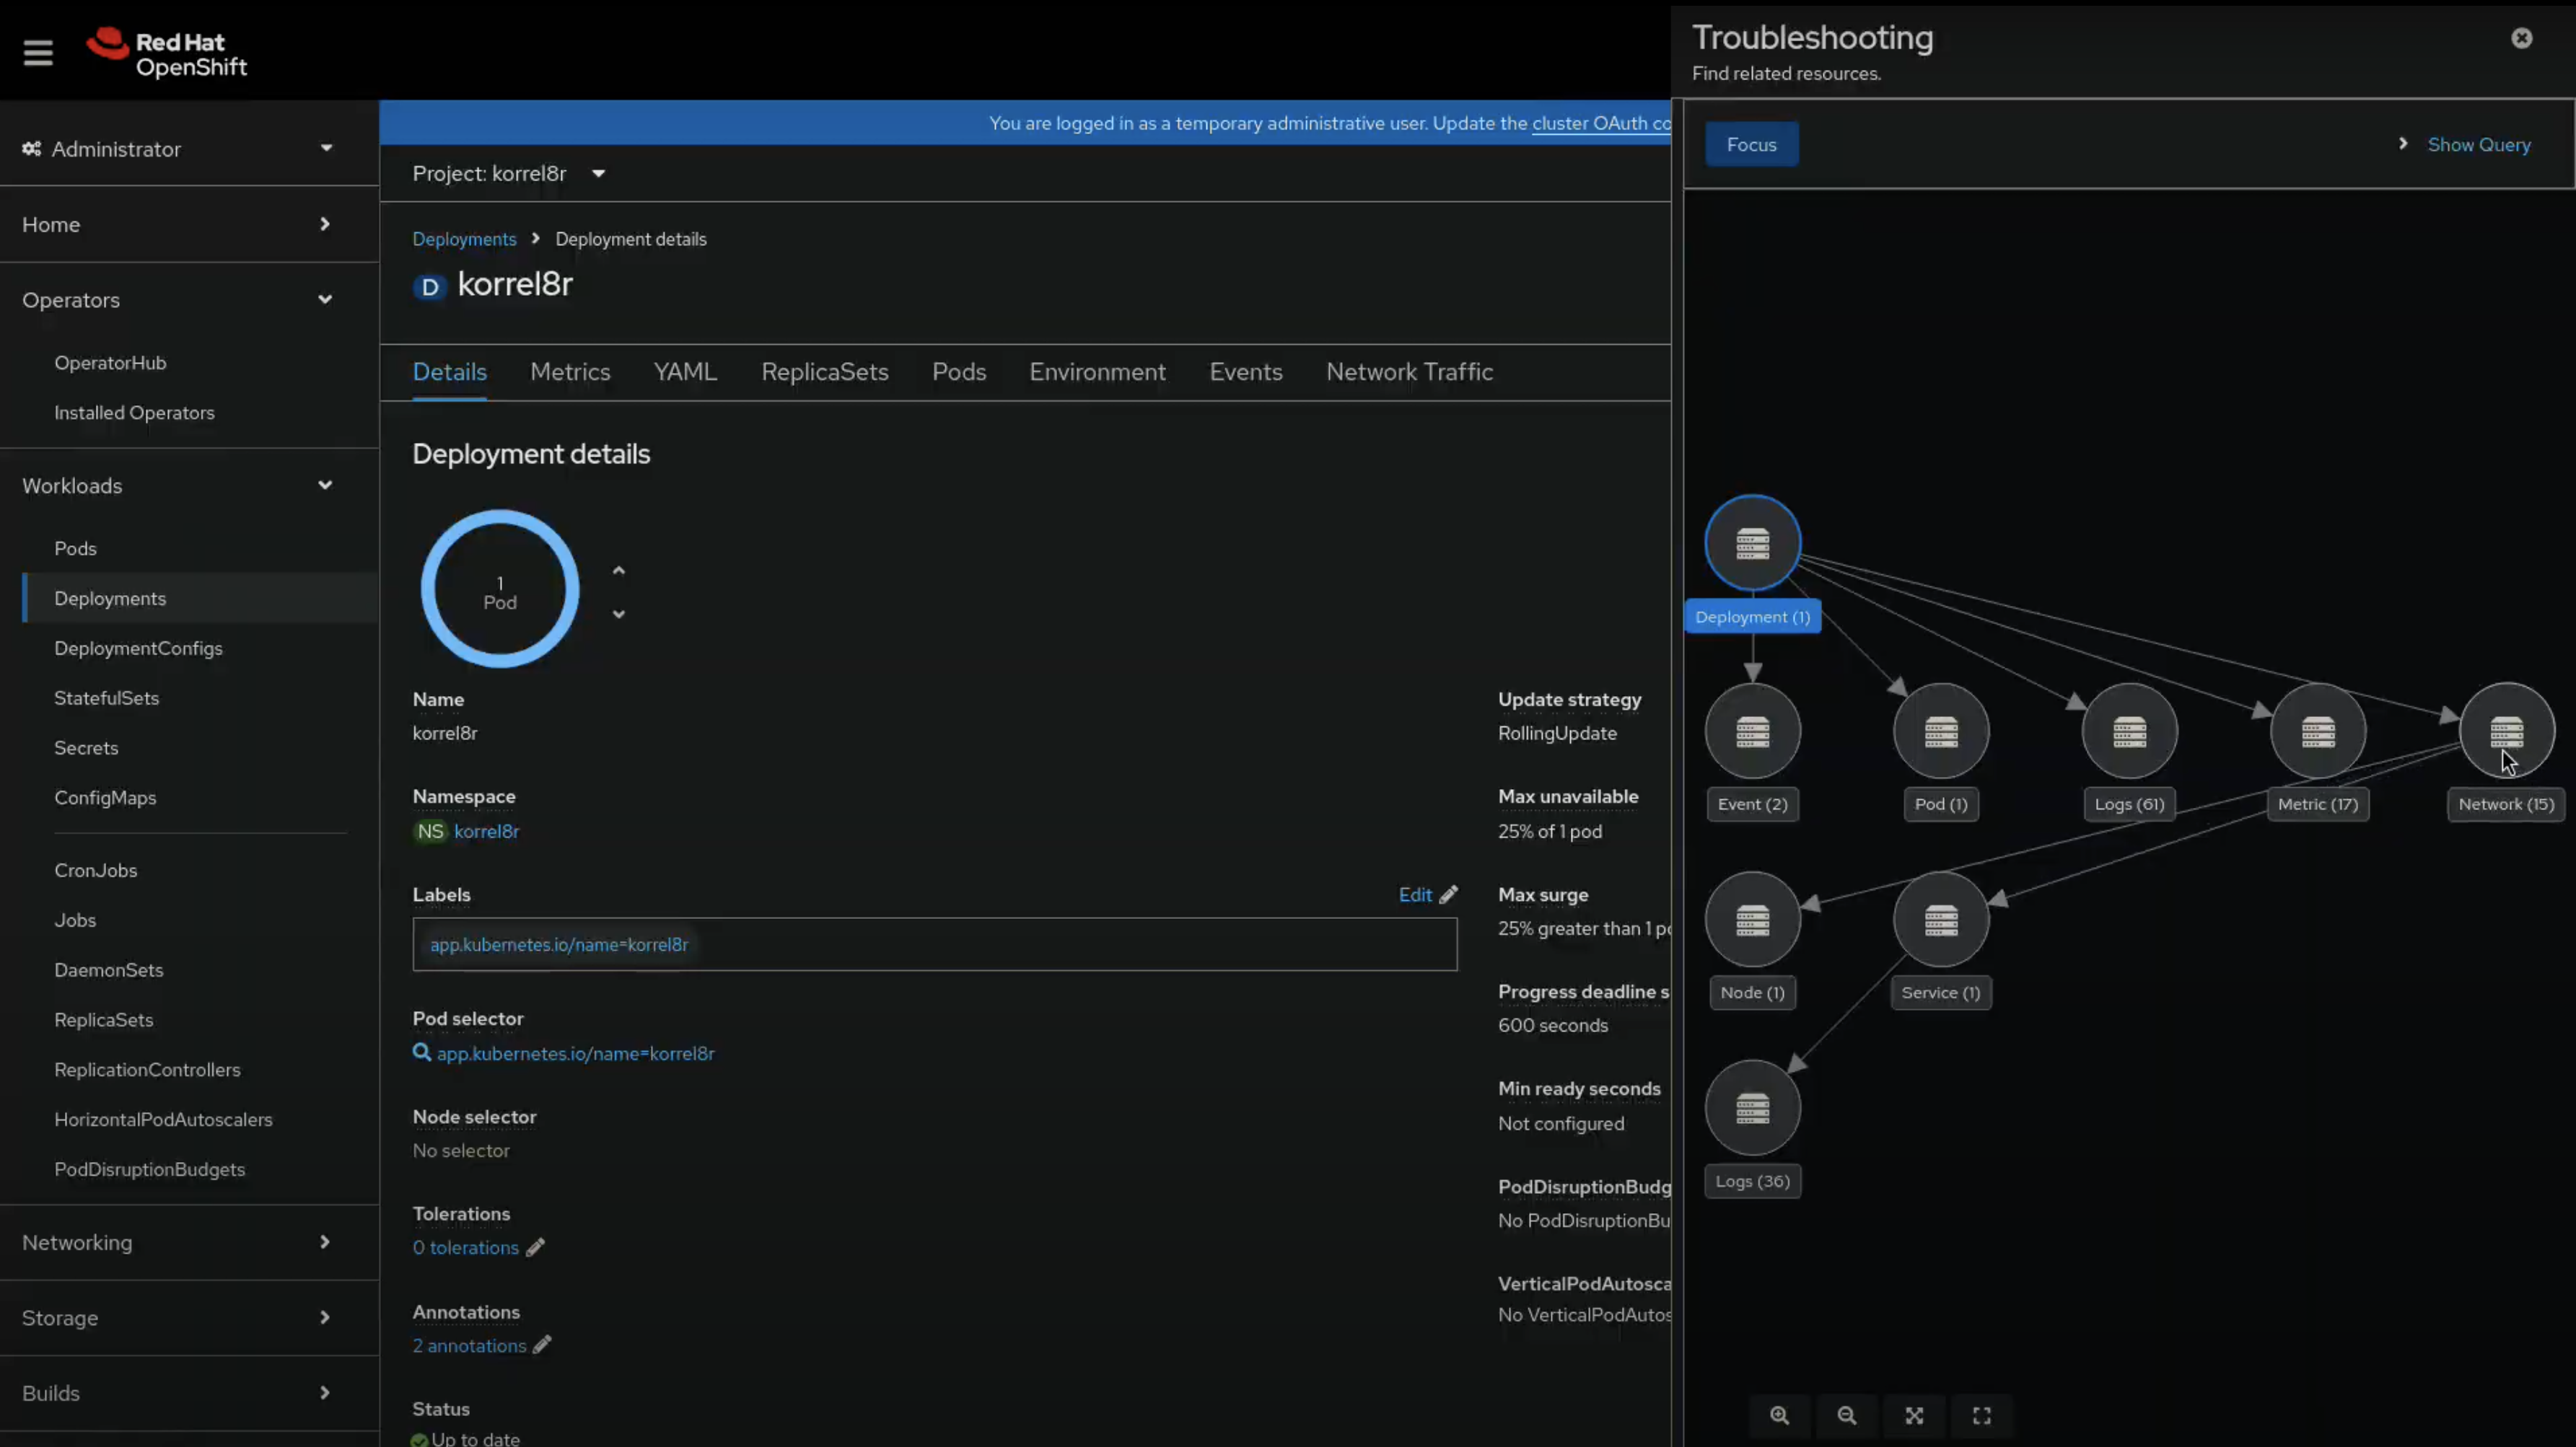
    By clicking Pod (displayed in the graph) and then the Focus button positioned on the top left of the panel, OpenShift users are now provided with correlated signals and resources to that specific pod, as shown in Figure 3. 

    A view of Observability signal correlation's troubleshooting panel showing the Focus functionality in action.
    Figure 3: Observability signal correlation’s troubleshooting panel - Focus functionality in action.
    Figure 3: Observability signal correlation's troubleshooting panel—Focus functionality in action.

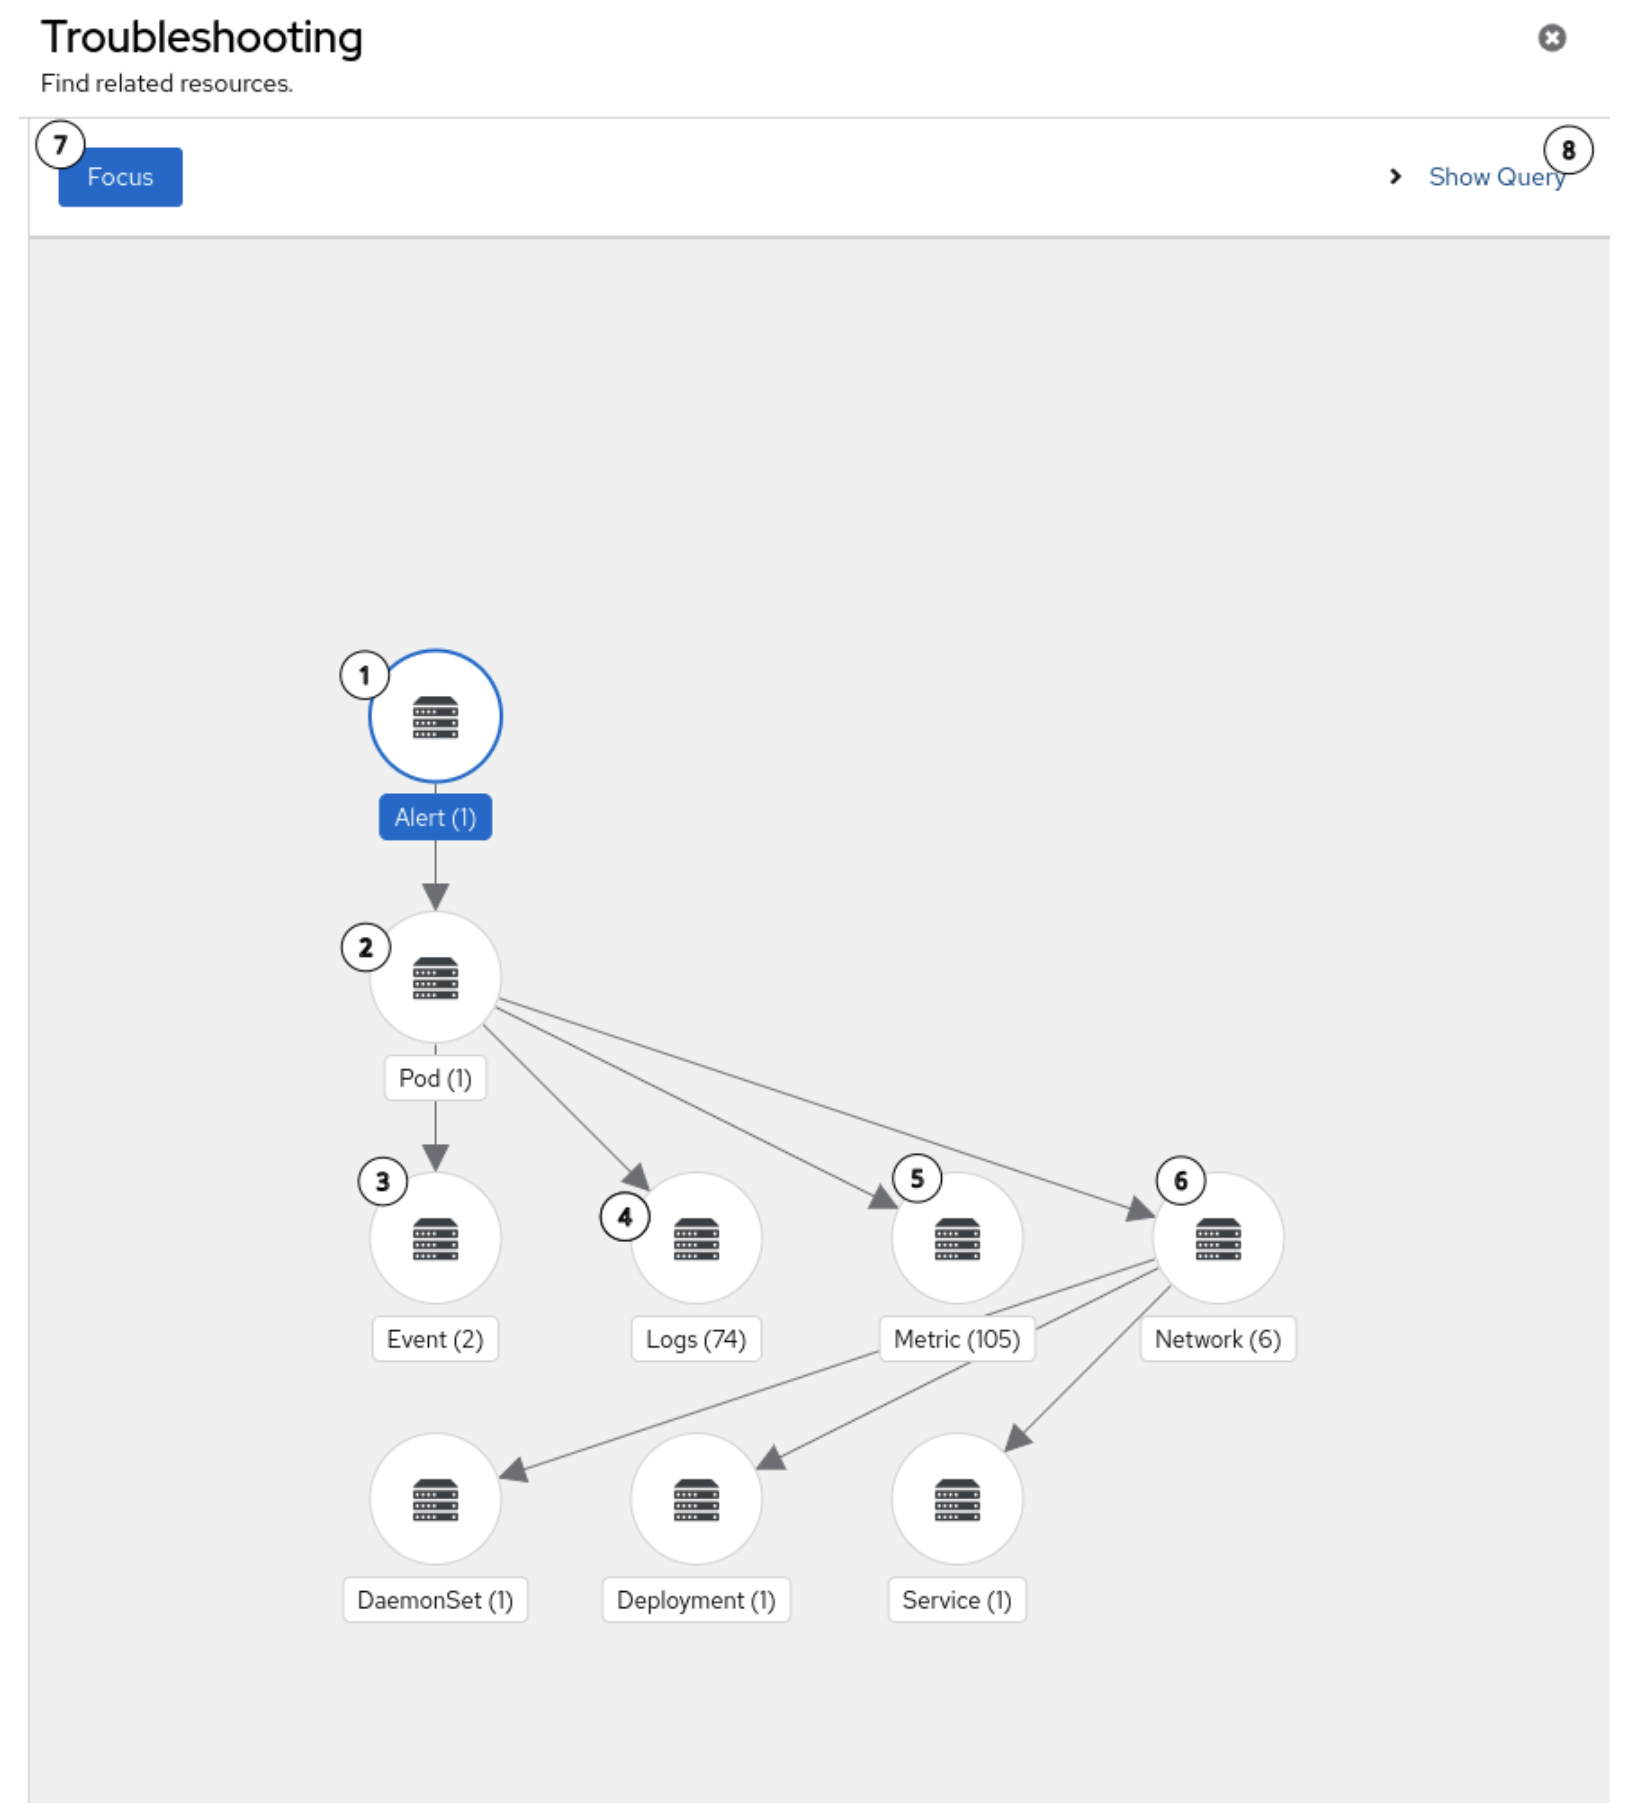
    Show query and additional experimental functionalities

    A series of experimental functionalities that allow OpenShift users to customize their own correlation experience have been added as part of this technology preview release. Those features are optional and aim at providing a greater flexibility to users. More specifically:

    • "Show Query" displays the experimental features.
    • "Hide Query" hides the experimental features.
    • "Korrel8r query" identifies the starting point for the node graph and gets updated by the Focus functionality which is described above. Note that this query language is experimental and, as such, it is likely to evolve in the future. 
    • "Neighborhood depth" provides users with the possibility to increase or decrease the depth of correlation to be able to explore a smaller or larger neighborhood. 

    "Goal class" provides users with the opportunity to opt for a goal directed search instead of a neighborhood search, which is the standard default. A goal directed search shows all available paths from the starting point to the goal signal/resource. Valid goals currently include any K8s resource, alert, metric, and network event, as well as application, infrastructure, and audit logs. Figure 4 depicts the Show Query feature.

    A view of the Show Query feature in action in the Troubleshooting panel.
    Figure 4: Show Query - Experimental features.
    Figure 4: Show Query—experimental features.

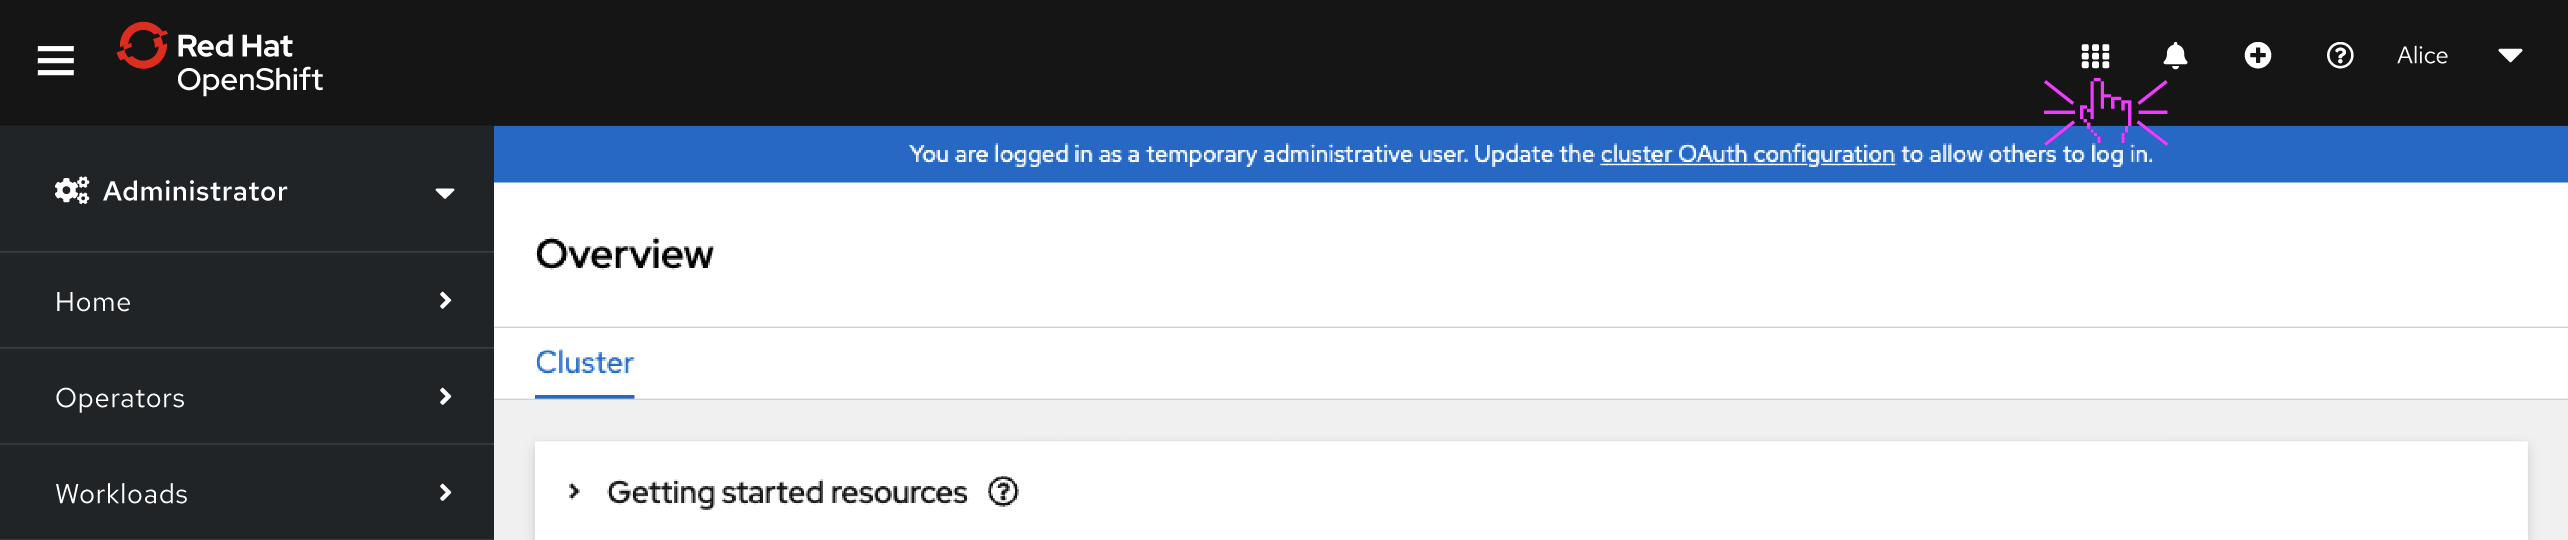
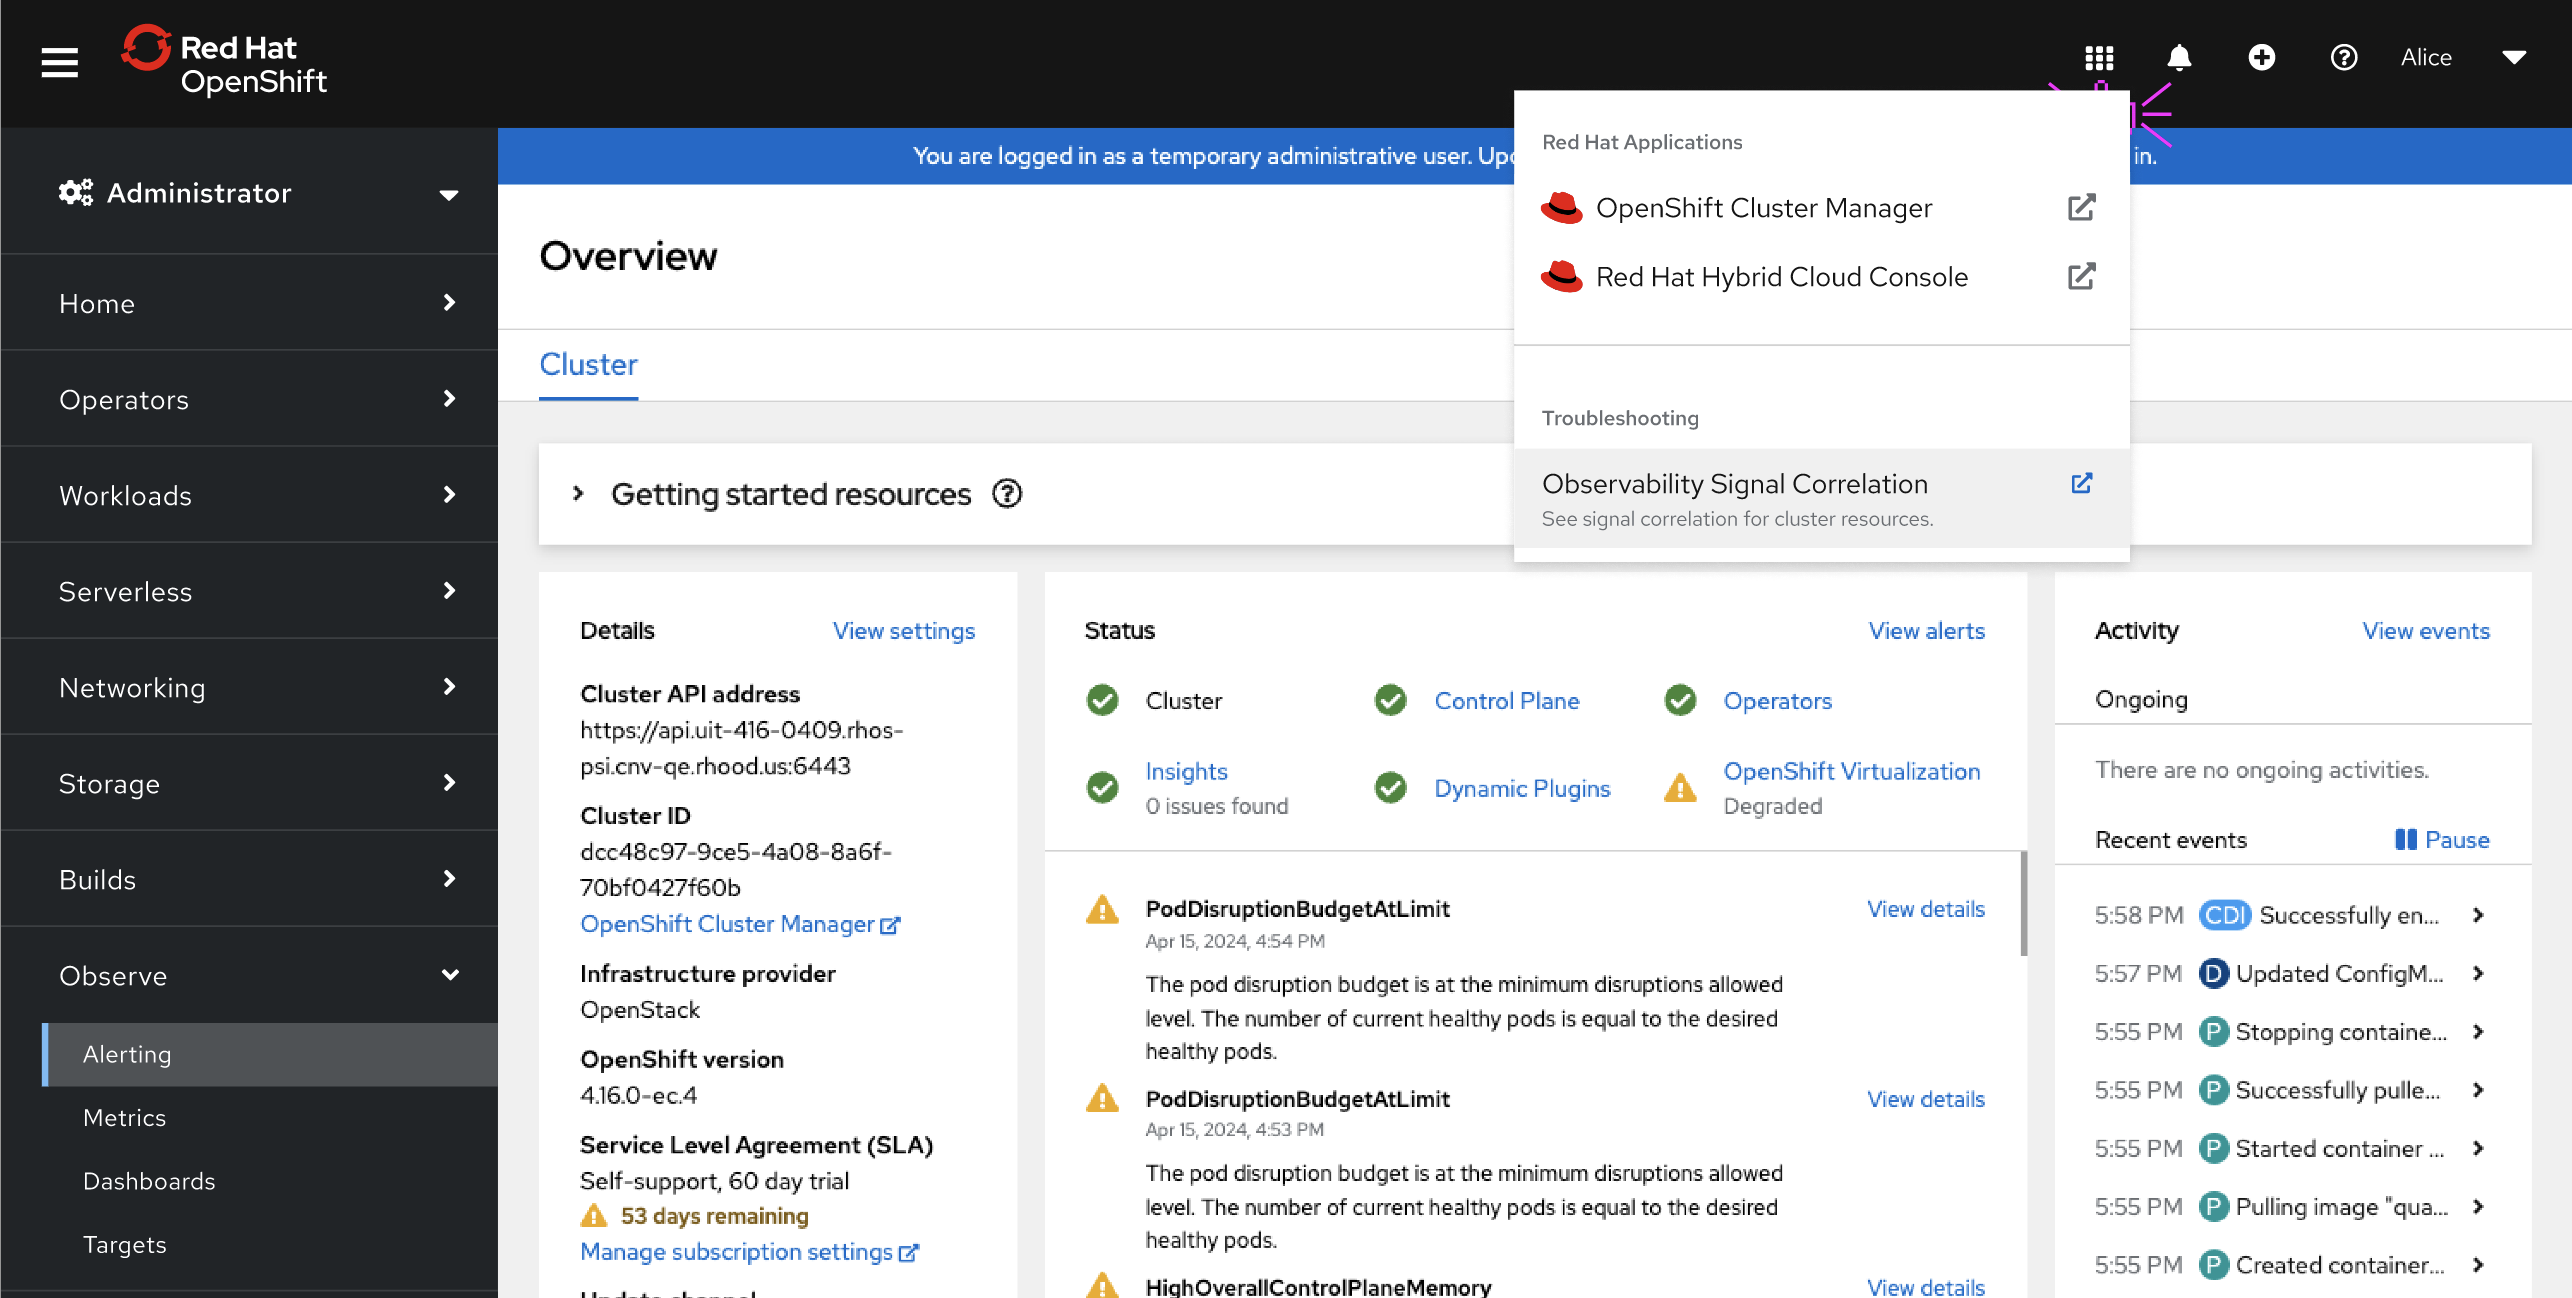
    Troubleshooting panel: Universal launcher 

    An additional functionality will be available with the OpenShift 4.17 release: OpenShift users will be able to trigger the observability signal correlation’s troubleshooting panel directly from the masthead of the OpenShift web console, as shown in Figures 5 and 6. This new feature improves usability and accessibility to the correlation tool and the thus the panel, without users having to necessarily access the Observe > Alerting UI to find the dedicated troubleshooting panel hyperlink.

    A view of the Troubleshooting panel's launcher in the OpenShift web console's masthead in the top right, pointed out by a purple hand icon.
    Figure 5: Troubleshooting panel’s launcher in the OpenShift web console’s masthead.
    Figure 5: Troubleshooting panel's launcher in the OpenShift web console's masthead.


    The result of clicking the Troubleshooting panel's launcher in the OpenShift web console's masthead showing a menu apearing with the option to click Observability Signal Correlation.
    Figure 6: Troubleshooting panel’s launcher in the OpenShift web console’s masthead.
    Figure 6: Troubleshooting panel's launcher in the OpenShift web console's masthead showing the menu that appears after clicking the icon.

    What's next?

    We continue to work on enhancements that provide greater flexibility and usability for OpenShift users. We are working on extending support for additional observability signals/resource types. Up next? Traces. We are also planning on consolidating the experimental features described earlier in the article. That is why your feedback is important. You can share your questions and recommendations with us using the Red Hat OpenShift feedback form.

    Related Posts

    • Improved observability signal correlation for Red Hat OpenShift

    • Building an observability stack for automated performance tests on Kubernetes and OpenShift (part 2)

    • OpenTelemetry: A Quarkus Superheroes demo of observability

    • Network observability using TCP handshake round-trip time

    Recent Posts

    • GuideLLM: Evaluate LLM deployments for real-world inference

    • Unleashing multimodal magic with RamaLama

    • Integrate Red Hat AI Inference Server & LangChain in agentic workflows

    • Streamline multi-cloud operations with Ansible and ServiceNow

    • Automate dynamic application security testing with RapiDAST

    What’s up next?

    Read Operating OpenShift, a practical guide to running and operating OpenShift clusters more efficiently using a site reliability engineering (SRE) approach. Learn best practices and tools that can help reduce the effort of deploying a Kubernetes platform.

    Get the e-book
    Red Hat Developers logo LinkedIn YouTube Twitter Facebook

    Products

    • Red Hat Enterprise Linux
    • Red Hat OpenShift
    • Red Hat Ansible Automation Platform

    Build

    • Developer Sandbox
    • Developer Tools
    • Interactive Tutorials
    • API Catalog

    Quicklinks

    • Learning Resources
    • E-books
    • Cheat Sheets
    • Blog
    • Events
    • Newsletter

    Communicate

    • About us
    • Contact sales
    • Find a partner
    • Report a website issue
    • Site Status Dashboard
    • Report a security problem

    RED HAT DEVELOPER

    Build here. Go anywhere.

    We serve the builders. The problem solvers who create careers with code.

    Join us if you’re a developer, software engineer, web designer, front-end designer, UX designer, computer scientist, architect, tester, product manager, project manager or team lead.

    Sign me up

    Red Hat legal and privacy links

    • About Red Hat
    • Jobs
    • Events
    • Locations
    • Contact Red Hat
    • Red Hat Blog
    • Inclusion at Red Hat
    • Cool Stuff Store
    • Red Hat Summit

    Red Hat legal and privacy links

    • Privacy statement
    • Terms of use
    • All policies and guidelines
    • Digital accessibility

    Report a website issue