Last year, we released the Network Observability CLI, a lightweight flow and packet visualization tool. The first version of this tool captured flows or packets by running a simple command and reused NetObserv components without installing and configuring operators.
Since introducing the Network Observability CLI, we have added numerous features. This article covers seven improvements to the command-line interface (CLI) in version 1.8 and provides examples.
7 new CLI features
This update adds seven new features and options to the Network Observability CLI, covering more scenarios and enabling scripting on top of the tool. The following sections describe these improvements in detail.
1. The new background option
The --background option allows you to start a flow or packet capture without connecting your terminal to the collector pod. This enables the capture process to run in the background while you work on something else.
Here are the commands you can use with this option:
- You can check the capture progress using the
followcommand. - The capture ends automatically when it reaches maximum bytes (50MB) or time (5 minutes). You can update these accordingly, using the
--max-bytesand--max-timeoptions. - To end the capture manually, use the
stopcommand. - In both cases, the collector pod keeps running to let you download the output locally using the
copycommand. - Once the job is complete, you can
cleanupeverything as follows:
oc netobserv flows --background # Run a flow capture in the background

oc netobserv follow             # Show current capture progress

oc netobserv stop               # Stop the capture, keeping the collector pod alive

oc netobserv copy               # Copy the output

oc netobserv cleanup            # Remove all
2. Customizable namespace
Now you can customize the capture namespace using the NETOBSERV_NAMESPACE environment variable. When the CLI starts, it automatically checks if this namespace exists, and stops if it finds any conflict with a pending capture. This is particularly useful if you want to run captures in parallel:
NETOBSERV_NAMESPACE=my_ns oc netobserv [flows]3. Labeling subnets
Subnets labeling (for OCP clusters) is a new feature. Now this tool can read Red Hat OpenShift configurations from cluster-config-v1 and network to identify machine, pods, and services subnets, using the --get-subnets option. This automatically adds SrcSubnetLabel and DstSubnetLabel to your flows.
During the creation of agents, you can view the configuration of subnets as follows:
creating flow-capture agents:
opt: get_subnets, value: true
Found subnets:
    Services: "172.30.0.0/16"
    Pods: "10.128.0.0/14"
    Machines: "10.0.0.0/16"
The subnet labels are displayed as columns:
Enrichment: SubnetLabel Use Page Up / Page Down keyboard keys to cycle enrichment scopes
End Time 			Src Subnet Label 	Dst Subnet Label 	Interfaces
14:54:04.816000 	Services 			Pods				06f87d8e27c8fe2
14:54:04.816000 	Pods 				Pods 				afaa6cd4ccaal89,enss
4. Enhanced data filtering
Filtering is crucial to gathering precise network data without excessive utilization of resources and storage. The CLI focuses on this area, allowing you to deploy agents only where needed and fine-tune the captured data.
The next sections will describe how these filtering features have been enhanced:
- Assigning agents to nodes
- More fine-tuning options
- Filtering with regexes
Assigning agents to nodes
It's now possible to define agents nodeSelector to capture on a subset of nodes. You can rely on existing labels or create a dedicated one for this usage. For example, you can run the agents on the node with the kubernetes.io/hostname:my-node label with the following command:
oc netobserv flows --node-selector=kubernetes.io/hostname:my-nodeMore fine-tuning options
Agents recently introduced the ability to filter simultaneously on IPs, ports, protocol, action, TCPFlags, and more. You can now apply these eBPF filters in the CLI as follows:
oc netobserv flows \              # Capture flows
--protocol=TCP --port=8080 \      # either on TCP 8080
or --protocol=UDP                 # or UDP
View these filters validated during the creation of the agents in the following output:
creating flow-capture agents:
opt: filter_protocol, value: TCP
opt: filter_port, value: 8080
opt: add_filter
opt: filter_protocol, value: UDP
Here you can see the filters applied with the output:
Options: protocol=TCP|port=8080|or |protocol=UDPYou can add up to sixteen sets of filters separated by the or operator to create multiple capture scenarios.
Filtering with regexes
If you need to filter on enriched content beyond the agent-level filters, you can use regular expressions (regexes) to match any field/value pair. For example, the --regexes=SrcK8S_Namespace~openshift.* command allows you to keep the traffic only from OpenShift namespaces.
In this output, regexes are validated during creation of the agents:
creating flow-capture agents:
opt: filter_regexes, value: SrcK8S_Namespace~openshift.*
key: SrcK8S_Namespace value: openshift.*
This is the filtered output:
Options: regexes=Srck8S_Namespace~openshift.x
...
Enrichment: Namespace Use Page Up / Page Down keyboard keys to cycle enrichment scopes
End Time 			Src Namespace 			Dst Namespace 			Interfaces
14:51:20.216000 	openshift-monitoring 	openshift-monitoring 	eth0,11e205f2f971729, genev_sys_6081
14:51:20.246000 	openshift-monitoring 	default 				eth0,101070861aded97
You can use multiple regexes at once separated by commas, such as --regexes=SrcK8S_Namespace~my-ns,SrcK8S_Name~my-app. Refer to the network flows format to view the possible fields.
5. Unified collector user experience
All filtering capabilities are now supported for capturing packets and displaying enriched data. This unified collector user experience is an improvement made possible by introducing the flowlogs-pipeline component inside eBPF agents, which parses packets and generates flows from them.
For example, you can run a packet capture on a specific port, as follows:
oc netobserv packets --port=80The output that follows appears the same as if it were a flow capture:
Running network-observability-cli as Packet Capture
Log level: info Duration: 1m52s Capture size: 36KB
Options: port=80
Showing last: 35 Use Up / Down keyboard arrows to increase / decrease limit
Display: Standard Use Left / Right keyboard arrows to cycle views
Enrichment: None Use Page Up / Page Down keyboard keys to cycle enrichment scopes
End Time 			Src IP 			Src Port 	Dst IP 			Dst Port 	Interfaces
02:47:55.180000 	172.30.68.174 	80 (http) 	10.128.0.16 	43236 		n/a
02:47:55.180000 	10.128.0.16 	43236 		172.30.68.174 	80 (http) 	n/a
02:47:55.180000 	10.128.0.16 	43236 		172.30.68.174 	80 (http) 	n/a
...
Live table filter: [10.] Press enter to match multiple regexes at once
6. Capture metrics on OpenShift
You can now capture metrics on OpenShift by using the metrics command. This creates a ServiceMonitor to gather metrics from the agents and store them in Prometheus. You can enable all or specific features to gather more information about your network.
Use the following command to capture packet drops, DNS, and RTT metrics:
oc netobserv metrics --enable_allYou can also use the following command to focus only on drops:
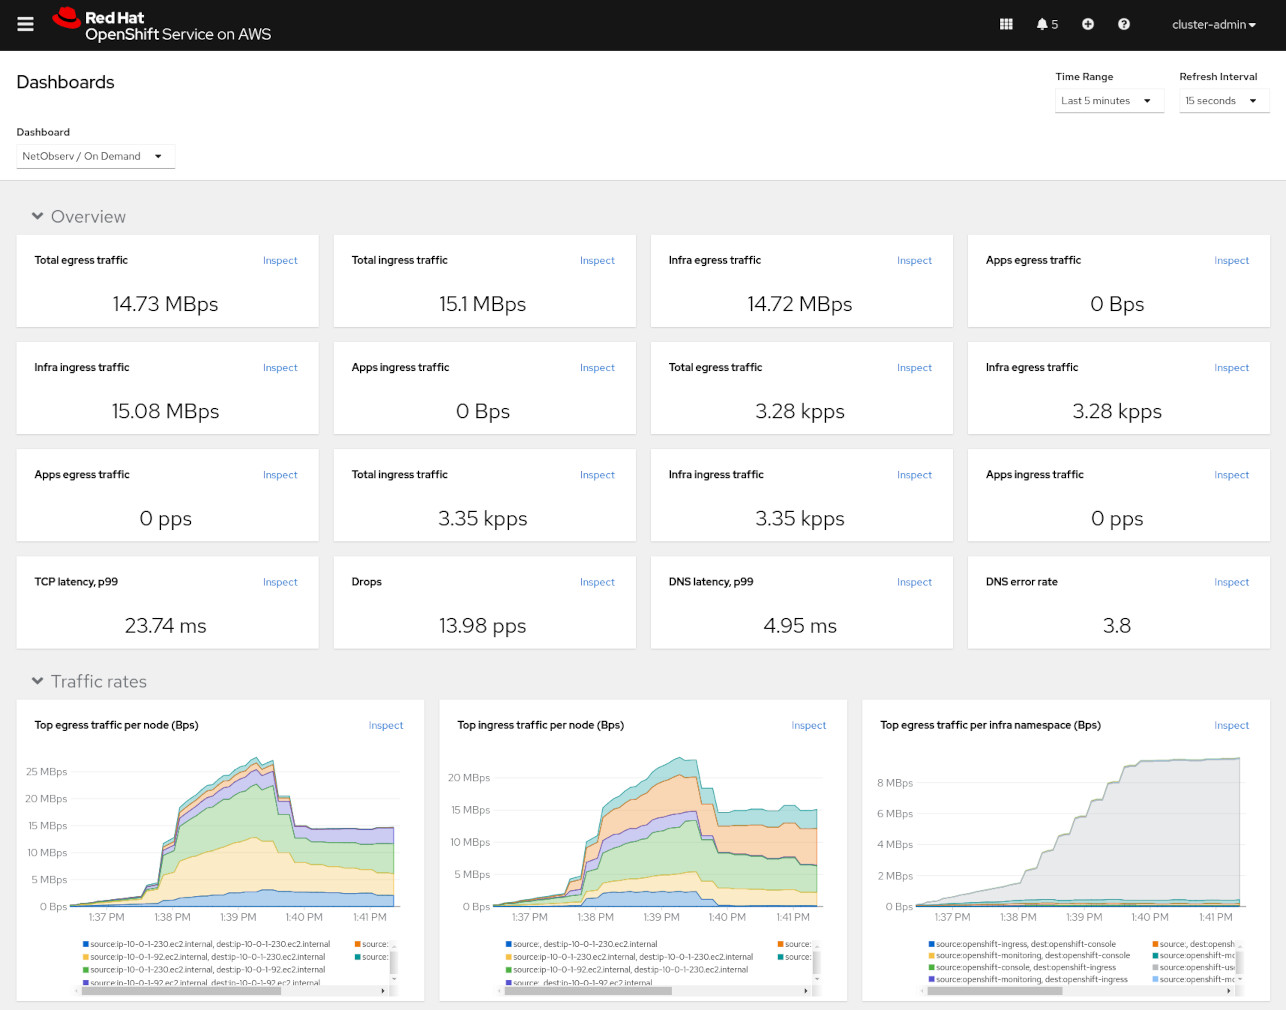
oc netobserv metrics --enable_pkt_dropIn addition to these features, you can use all the previously mentioned filtering capabilities to focus on the data for which you are looking. An automatically created NetObserv / On Demand dashboard shows the results (Figure 1).
This dashboard will include all the default metrics also available in the operator. These are not customizable for now but we are already working on adding more options to this command.
Please keep in mind that this mode ignores the maximum bytes or time options since there is no collector pod involved. It only deploys the eBPF agents. You must run the stop or cleanup command to remove everything.
7. Enhanced help feature
We have enhanced the help feature by providing examples for each command and option.
Type oc netobserv help to get this general help message:
$ oc netobserv help

Netobserv CLI allows you to capture flows, packets and metrics from your cluster.
Find more information at: https://github.com/netobserv/network-observability-cli/

Syntax: netobserv [flows] [options]

main commands:
  flows      Capture flows information in JSON format using collector pod.
  metrics    Capture metrics information in Prometheus using a ServiceMonitor (OCP cluster only).
  packets    Capture packets information in pcap format using collector pod.

extra commands:
  cleanup    Remove netobserv components and configurations.
  copy       Copy collector generated files locally.
  follow     Follow collector logs when running in background.
  stop       Stop collection by removing agent daemonset.
  version    Print software version.

basic examples:
  netobserv flows --drops         # Capture dropped flows on all nodes
  netobserv packets --port=8080   # Capture packets on port 8080
  netobserv metrics --enable_all  # Capture all cluster metrics with pktDrop, dns, rtt and network events features

advanced examples:
  Capture drops in background and copy output locally
    netobserv flows --background \                            # Capture flows using background mode
    --max-time=15m \                                          # for a maximum of 15 minutes
    --protocol=TCP --port=8080 \                              # either on TCP 8080
    or --protocol=UDP                                         # or UDP
    netobserv follow                                          # Display the progression of the background capture
    netobserv stop                                            # Stop the background capture by deleting eBPF agents
    netobserv copy                                            # Copy the background capture output data
    netobserv cleanup                                         # Cleanup netobserv CLI by removing the remaining collector pod

  Capture packets on specific nodes and port
    netobserv packets                                         # Capture packets
    --node-selector=netobserv:true \                          # on nodes labelled with netobserv=true
    --port=80 \                                               # on port 80 only
    --max-bytes=100000000                                     # for a maximum of 100MB
You can also request help on a specific command to get an options list. For example, the oc netobserv metrics help command yields this output:
$ oc netobserv metrics help

Netobserv CLI allows you to capture metrics on your OCP cluster.
Find more information at: https://github.com/netobserv/network-observability-cli/

Syntax: netobserv metrics [options]

features:
  --enable_all:                 enable all eBPF features                   (default: false)
  --enable_dns:                 enable DNS tracking                        (default: false)
  --enable_network_events:      enable network events monitoring           (default: false)
  --enable_pkt_translation:     enable packet translation                  (default: false)
  --enable_pkt_drop:            enable packet drop                         (default: false)
  --enable_rtt:                 enable RTT tracking                        (default: false)
  --enable_udn_mapping:         enable User Defined Network mapping (default: false)
  --get-subnets:                get subnets informations                   (default: false)

filters:
  --action:                     filter action                              (default: Accept)
  --cidr:                       filter CIDR                                (default: 0.0.0.0/0)
  --direction:                  filter direction                           (default: n/a)
  --dport:                      filter destination port                    (default: n/a)
  --dport_range:                filter destination port range              (default: n/a)
  --dports:                     filter on either of two destination ports  (default: n/a)
  --drops:                      filter flows with only dropped packets     (default: false)
  --icmp_code:                  filter ICMP code                           (default: n/a)
  --icmp_type:                  filter ICMP type                           (default: n/a)
  --node-selector:              capture on specific nodes                  (default: n/a)
  --peer_ip:                    filter peer IP                             (default: n/a)
  --peer_cidr:                  filter peer CIDR                           (default: n/a)
  --port_range:                 filter port range                          (default: n/a)
  --port:                       filter port                                (default: n/a)
  --ports:                      filter on either of two ports              (default: n/a)
  --protocol:                   filter protocol                            (default: n/a)
  --regexes:                    filter flows using regular expression      (default: n/a)
  --sport_range:                filter source port range                   (default: n/a)
  --sport:                      filter source port                         (default: n/a)
  --sports:                     filter on either of two source ports       (default: n/a)
  --tcp_flags:                  filter TCP flags                           (default: n/a)
  --interfaces:                 interfaces to monitor                      (default: n/a)
We welcome your feedback
We invite you to explore all the new improvements and features on the Network Observability CLI 1.8, and we welcome your feedback. If you enjoyed this article, feel free to share your ideas, use cases; and you can always ask the community for help. NetObserv is an open source project available on GitHub.
Thanks to Joël Takvorian, Mehul Modi, and Sara Thomas for reviewing this article.