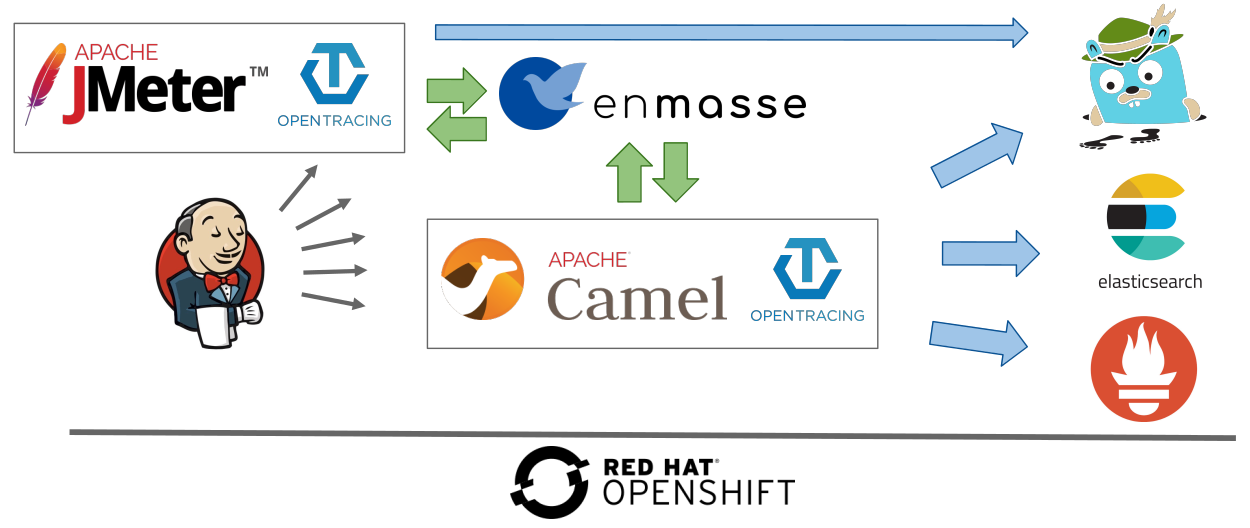
This is the second of a series of three articles based on a session I held at Red Hat Tech Exchange in EMEA. In the first article, I presented the rationale and approach for leveraging Red Hat OpenShift or Kubernetes for automated performance testing, and I gave an overview of the setup.
In this article, we will look at building an observability stack. In production, the observability stack can help verify that the system is working correctly and performing well. It can also be leveraged during performance tests to provide insight into how the application performs under load.
An example of what is described in this article is available in my GitHub repository.
Overview of the setup
Application metrics
Prometheus and Grafana installation
Until OpenShift 3.10, Ansible playbooks were available for installing Prometheus and Grafana. They are installed together with the openshift-ansible package and are available at:
/usr/share/ansible/openshift-ansible/playbooks/openshift-prometheus/usr/share/ansible/openshift-ansible/playbooks/openshift-grafana
With OpenShift 3.11, Red Hat provides an operator that, besides performing the installation, allows you to manage the lifecycle of Prometheus and Grafana (applying updates, for instance). It is, however, important to note that Red Hat supports only the operator and associated Prometheus and Grafana for monitoring the cluster at this point in time. Nothing prevents us, however, from leveraging the operator for installing separate instances if we are comfortable with managing them on our own.
The Prometheus operator can also be used for installation on top of upstream Kubernetes.
Application JMX/Jolokia and Prometheus endpoints
The Fabric8 S2I Java image, which is used by Fuse, among others, handily comes with support for exporting metrics to Prometheus. Among others, it has a Prometheus exporter agent, which is started with the application and exposes metrics to be scraped. The Java process is started with -javaagent:/opt/prometheus/jmx_prometheus_javaagent.jar=9779:/opt/prometheus/prometheus-config.yml, where prometheus-config.yml already includes all the Camel metrics. You can use the S2I capabilities of the image to add your own metrics. More information is available here.
Most Java applications use JMX for exposing the JVM, frameworks, and application custom metrics. Like the Fabric8 S2I Java image, any Java application can leverage the JMX exporter agent to make JMX metrics accessible through Prometheus.
Metrics scraping
Once the application has made a Prometheus endpoint available, the next step is to tell Prometheus to collect metrics from it. Therefore, a service needs to be created that exposes the Prometheus port (9779) with special annotations. Here is an example:
apiVersion: v1
kind: Service
metadata:
  annotations:
    prometheus.io/port: '9779'
    prometheus.io/scheme: http
    prometheus.io/scrape: 'true'
[...]
Finally, the Prometheus ConfigMap created by the Ansible playbook during the installation into the openshift-metrics project needs to be amended with a couple of lines in which perftest is the project namespace where my application is deployed. Kubernetes SD configurations allow retrieving scrape targets from Kubernetes' REST API and staying synchronized with the cluster state. The endpoints role discovers targets from listed endpoints of a service. For each endpoint address, one target is discovered per port.
- job_name: 'myapps-job'
  kubernetes_sd_configs:
  - role: endpoints
    namespaces:
      names:
      - perftest
Using relabel, we can limit the metrics' scraped to the service name of our application, camel-amq-fakeapp here, and the port, which is named prometheus.
relabel_configs:
- source_labels: [__meta_kubernetes_service_name]
  action: keep
  regex: camel-amq-fakeapp
- source_labels: [__meta_kubernetes_pod_container_port_name]
  action: keep
  regex: prometheus
Dashboards
Grafana is the tool usually used for data visualization. The first thing is to configure a data source pointing to our Prometheus installation. The following information needs to be provided:
- Name: Self-explanatory; I used
DS_PROMETHEUSin my demo - Type: Prometheus
- URL:
https://prometheus-openshift-metrics.apps.sandbox.com/(this is to be populated with the Prometheus route) - Access: Server/proxy (named differently depending on the Grafana version)
- Skip TLS Verification (Insecure): If we don't have a CA configured
- Token (under "Prometheus settings"): Set to the result of
$ oc serviceaccounts get-token prometheus-reader -n openshift-metrics
Once the data source has been configured, we can create a dashboard making use of it and displaying the collected metrics. Prometheus scrapes them by default every 30 seconds. Here is an example that creates the dashboard below. It can be uploaded with the following steps:
- Click the Grafana icon menu on the top left and select Dashboards.
- Click New dashboard.
- Click the Import Dashboard button.
- Click the Upload .json File button.
- Select the JSON file.
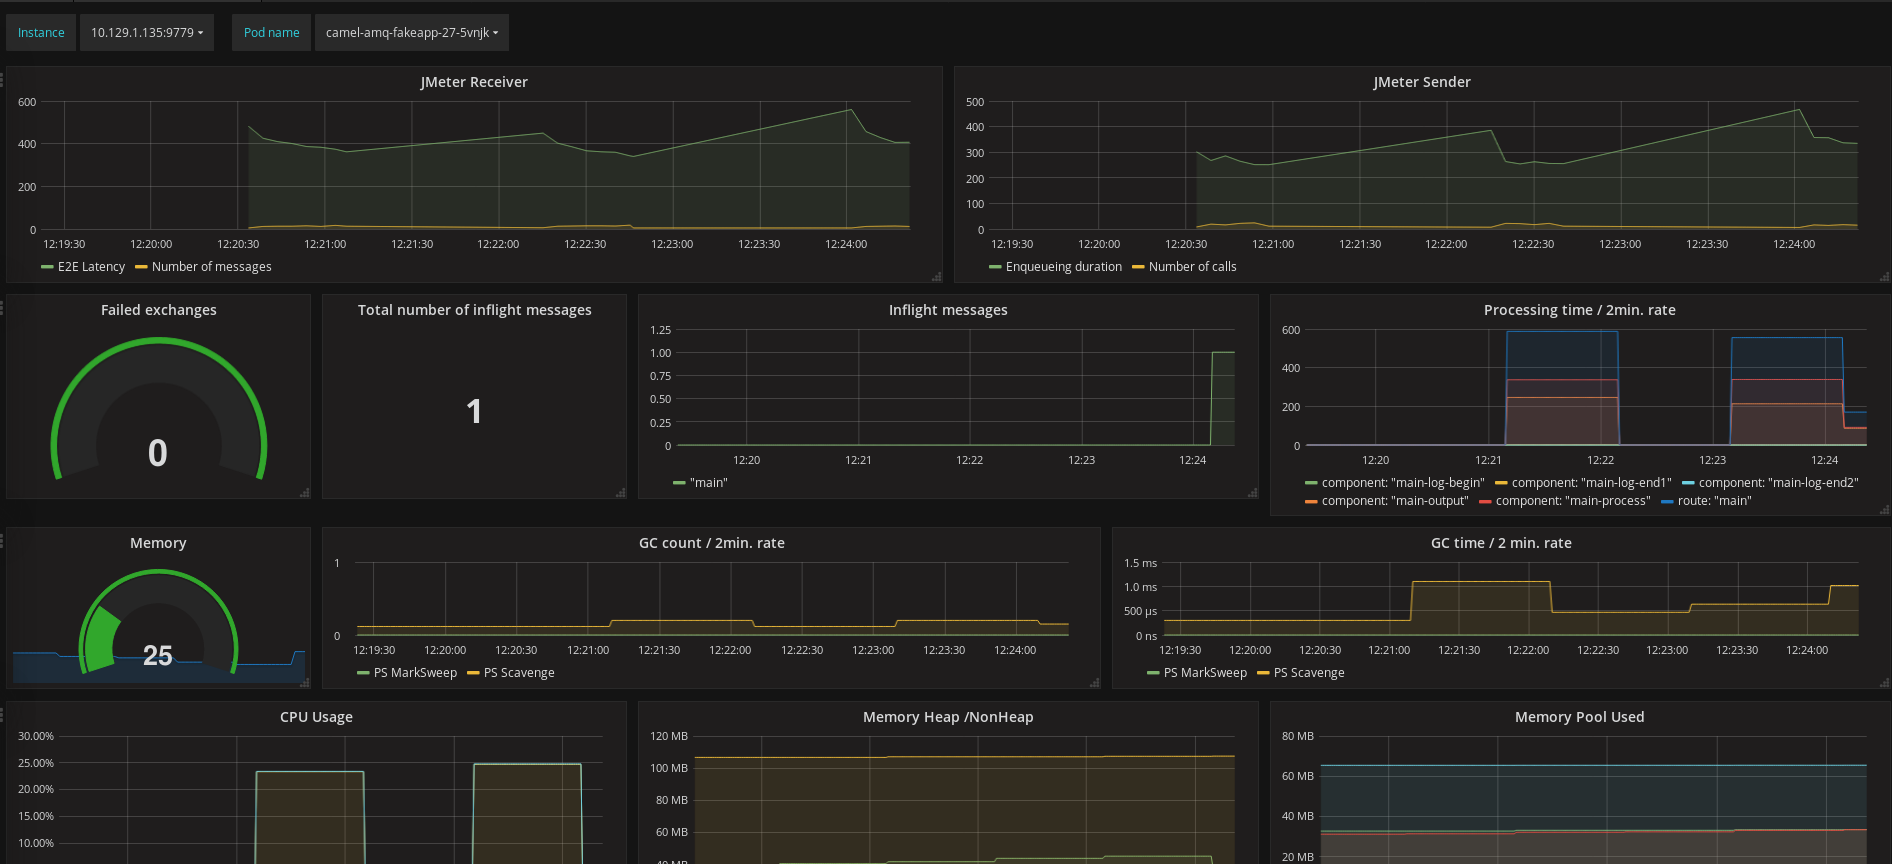
Note that this dashboard also contains JMeter metrics (the two graphs on the top line). They will be covered in the third and last article in this series.
The dashboard is contextual: the name of the pod and the instance need to be selected on the top left. These dropdown lists are automatically populated with the data retrieved from OpenShift.
The nice thing with Grafana dashboards is that you can display in one page multiple graphs originating from various sources and realms. This helps with identifying correlations.
- The second line contains metrics exposed by Camel: load, failures, and processing times
- The third and fourth lines show the resource consumption: memory, CPU, and garbage collections
I recommend that you have a look at the queries behind each graph and refer to the Prometheus documentation if you are not familiar with the concepts, metric types, functions, and operators in use. It may give you ideas for building your own dashboards and may provide a practical introduction to the querying capabilities offered.
Application performance management
Because this article is about performance tests, application performance management is of high relevance. The demo relies on OpenTracing and Jaeger. The instrumentation is split into several parts:
- A collector, which acts as a data sink
- An agent in charge of sending application metrics to the sink
- A front end for querying data from the sink
It may also be worth mentioning that enMasse/ActiveMQ Artemis is working on adding OpenTracing support.
Collector
Deploying an in-memory Jaeger collector can be done with a single command. A production installation would require the use of Cassandra or Elasticsearch for data storage. Information is available in the jaeger-openshift repository.
$ oc process -f https://raw.githubusercontent.com/jaegertracing/jaeger-openshift/master/all-in-one/jaeger-all-in-one-template.yml | oc create -f -
Agent
The agent can be deployed as a sidecar container. This is handy because this setup will work regardless of the language the application is written in. The library deployed with the application will send traces to the localhost using UDP. Therefore, the following needs to be added to the application deployment configuration under the containers section:
- image: jaegertracing/jaeger-agent
        name: jaeger-agent
        ports:
        - containerPort: 5775
          protocol: UDP
        - containerPort: 5778
        - containerPort: 6831
          protocol: UDP
        - containerPort: 6832
          protocol: UDP
        args:
          - '--collector.host-port=jaeger-collector.perftest.svc:14267'
Using the jaeger-java-client library, we have added the following to the application pom.xml file.
<!-- 0.30 matches the dependency in Camel opentracing starter -->
<jaeger.version>0.30.1</jaeger.version>

<!-- Opentracing -->
<dependency>
  <groupId>org.apache.camel</groupId>
  <artifactId>camel-opentracing-starter</artifactId>
</dependency>
<dependency>
  <groupId>io.jaegertracing</groupId>
  <artifactId>jaeger-client</artifactId>
  <version>${jaeger.version}</version>
</dependency>
The next step is to tell the application to send traces by annotating the Application class with @CamelOpenTracing and the Camel OpenTracing implementation does the rest. Events (spans) are captured for incoming and outgoing messages being sent to/from Camel. Logs are also sent and can be seen when the consumer span is expanded.
Finally, the agent can be configured through environment variables set within the deployment configuration.
- name: JAEGER_SERVICE_NAME
  value: fakeapp
- name: JAEGER_SAMPLER_PARAM
  value: '1.0'
- name: JAEGER_PROPAGATION
  value: 'jaeger,b3'
The service name identifies the service provided by the application component in the trace. By default, Jaeger will send trace information for one call out of 1,000 to limit the burden put on the application. For validating the setup, we may want to tell Jaeger to do it for every single call as done in the code snippet above. Different formats can be used for trace propagation. Jaeger and b3 are configured here.
The front end
The Jaeger UI has been installed with the collector and a route has been created for reaching it. It can be used to retrieve and display traces and spans. Here is an example of a span. This also includes JMeter producers and consumers. We will see in the third article of this series how they can be added.

Logs
If applications running inside containers write their logs to the standard output, they are with OpenShift automatically aggregated into Elasticsearch and made available for querying and reporting in Kibana. It is best is to have them written in a structured way to add new querying and reporting capabilities. You can find more information on ways to achieve this in a previous article of mine.
Broker and external services
Monitoring of the broker is not covered in the demo available in my GitHub repository. I made, however, the assumption that the broker is not the limiting factor during our performance tests. It is best to make sure that this holds true.
EnMasse can be monitored using Prometheus and Grafana. Instructions are provided here. Also, it would make sense to reuse the Prometheus and Grafana instances monitoring the application. It seems that metrics are getting added to the information exposed; see this.
JMeter
Regarding JMeter, I made a few assumptions in the first article in this series. It would be better to validate that the resources made available to JMeter are not a limiting factor. The good thing with having it running on OpenShift is that it is easy to scale vertically or horizontally.
Although it is not covered in my GitHub repository, it would make sense to monitor JMeter using Prometheus and make sure that the JMeter instances were not overheated during the tests. Because JMeter instances may come and go when the tests are launched and terminated (that’s a good thing for freeing up resources), a Prometheus pushgateway may be used for metrics collection.
Time profiling and diagnostics
As an addition to application performance management, Java Flight Recorder and Java Mission Control have recently been open sourced, and they may be valuable tools when performance issues or degradation are noticed. On top of the metrics already exposed through JMX, JMC provides the capability to properly analyze information: objects allocated per thread, time spent per thread, call tree, time spent at each level, and so on.
A demonstration is not covered here but may be a subject for a subsequent article.
Conclusion
Thanks for reading. I hope you found this second article interesting. The third and last article will show how JMeter and Jenkins, both running on OpenShift, can be leveraged to automate and orchestrate our performance tests.