Redhat Developers  Logo
  • Products

    Featured

    • Red Hat Enterprise Linux
      Red Hat Enterprise Linux Icon
    • Red Hat OpenShift AI
      Red Hat OpenShift AI
    • Red Hat Enterprise Linux AI
      Linux icon inside of a brain
    • Image mode for Red Hat Enterprise Linux
      RHEL image mode
    • Red Hat OpenShift
      Openshift icon
    • Red Hat Ansible Automation Platform
      Ansible icon
    • Red Hat Developer Hub
      Developer Hub
    • View All Red Hat Products
    • Linux

      • Red Hat Enterprise Linux
      • Image mode for Red Hat Enterprise Linux
      • Red Hat Universal Base Images (UBI)
    • Java runtimes & frameworks

      • JBoss Enterprise Application Platform
      • Red Hat build of OpenJDK
    • Kubernetes

      • Red Hat OpenShift
      • Microsoft Azure Red Hat OpenShift
      • Red Hat OpenShift Virtualization
      • Red Hat OpenShift Lightspeed
    • Integration & App Connectivity

      • Red Hat Build of Apache Camel
      • Red Hat Service Interconnect
      • Red Hat Connectivity Link
    • AI/ML

      • Red Hat OpenShift AI
      • Red Hat Enterprise Linux AI
    • Automation

      • Red Hat Ansible Automation Platform
      • Red Hat Ansible Lightspeed
    • Developer tools

      • Red Hat Trusted Software Supply Chain
      • Podman Desktop
      • Red Hat OpenShift Dev Spaces
    • Developer Sandbox

      Developer Sandbox
      Try Red Hat products and technologies without setup or configuration fees for 30 days with this shared Openshift and Kubernetes cluster.
    • Try at no cost
  • Technologies

    Featured

    • AI/ML
      AI/ML Icon
    • Linux
      Linux Icon
    • Kubernetes
      Cloud icon
    • Automation
      Automation Icon showing arrows moving in a circle around a gear
    • View All Technologies
    • Programming Languages & Frameworks

      • Java
      • Python
      • JavaScript
    • System Design & Architecture

      • Red Hat architecture and design patterns
      • Microservices
      • Event-Driven Architecture
      • Databases
    • Developer Productivity

      • Developer productivity
      • Developer Tools
      • GitOps
    • Secure Development & Architectures

      • Security
      • Secure coding
    • Platform Engineering

      • DevOps
      • DevSecOps
      • Ansible automation for applications and services
    • Automated Data Processing

      • AI/ML
      • Data Science
      • Apache Kafka on Kubernetes
      • View All Technologies
    • Start exploring in the Developer Sandbox for free

      sandbox graphic
      Try Red Hat's products and technologies without setup or configuration.
    • Try at no cost
  • Learn

    Featured

    • Kubernetes & Cloud Native
      Openshift icon
    • Linux
      Rhel icon
    • Automation
      Ansible cloud icon
    • Java
      Java icon
    • AI/ML
      AI/ML Icon
    • View All Learning Resources

    E-Books

    • GitOps Cookbook
    • Podman in Action
    • Kubernetes Operators
    • The Path to GitOps
    • View All E-books

    Cheat Sheets

    • Linux Commands
    • Bash Commands
    • Git
    • systemd Commands
    • View All Cheat Sheets

    Documentation

    • API Catalog
    • Product Documentation
    • Legacy Documentation
    • Red Hat Learning

      Learning image
      Boost your technical skills to expert-level with the help of interactive lessons offered by various Red Hat Learning programs.
    • Explore Red Hat Learning
  • Developer Sandbox

    Developer Sandbox

    • Access Red Hat’s products and technologies without setup or configuration, and start developing quicker than ever before with our new, no-cost sandbox environments.
    • Explore Developer Sandbox

    Featured Developer Sandbox activities

    • Get started with your Developer Sandbox
    • OpenShift virtualization and application modernization using the Developer Sandbox
    • Explore all Developer Sandbox activities

    Ready to start developing apps?

    • Try at no cost
  • Blog
  • Events
  • Videos

Improved observability signal correlation for Red Hat OpenShift

July 10, 2024
Vanessa Martini Alan Conway
Related topics:
ContainersHybrid CloudKubernetesOperators
Related products:
Red Hat OpenShift

Share:

Observability signal correlation for Red Hat OpenShift has exponentially evolved over the past few months. A developer preview was made available to OpenShift users in December 2023 as part of the Logging 5.8 release. But since then, our team has worked to provide you with a series of great new features!

Observability signal correlation for Red Hat OpenShift continues to be powered by Korrel8r—an open source observability project founded within Red Hat—aimed at providing a set of rules for easily correlating metrics, logs, alerts, and additional observability signals across different data stores. Key enhancements include 1) expanded signal support, as you can now correlate netflows, 2) brand new troubleshooting panel in the OpenShift web console that simplifies the overall observability signal navigation, and 3) easier installation and set up process by simply installing the Cluster Observability Operator. 

This correlation capability is crucial for organizations to manage and monitor their infrastructure effectively, deal with the increasing data volume, and reduce their overall mean time to detection (MTTD) and mean time to resolution (MTTR). In this article, we will delve into the features, benefits, and setup process for testing the enhanced dev preview features of Korrel8r on OpenShift clusters, namely observability signal correlation for Red Hat OpenShift—a key part of the Observability troubleshooting journey. Learn more about the initiative below.

Enhanced developer preview: Everything you need to know

By installing the Cluster Observability Operator—the Observability umbrella operator—you can deploy a specific set of Observability UI plug-ins in OpenShift. See Figure 1.

Overview of installed operators
Figure 1: Observability UI plug-ins.

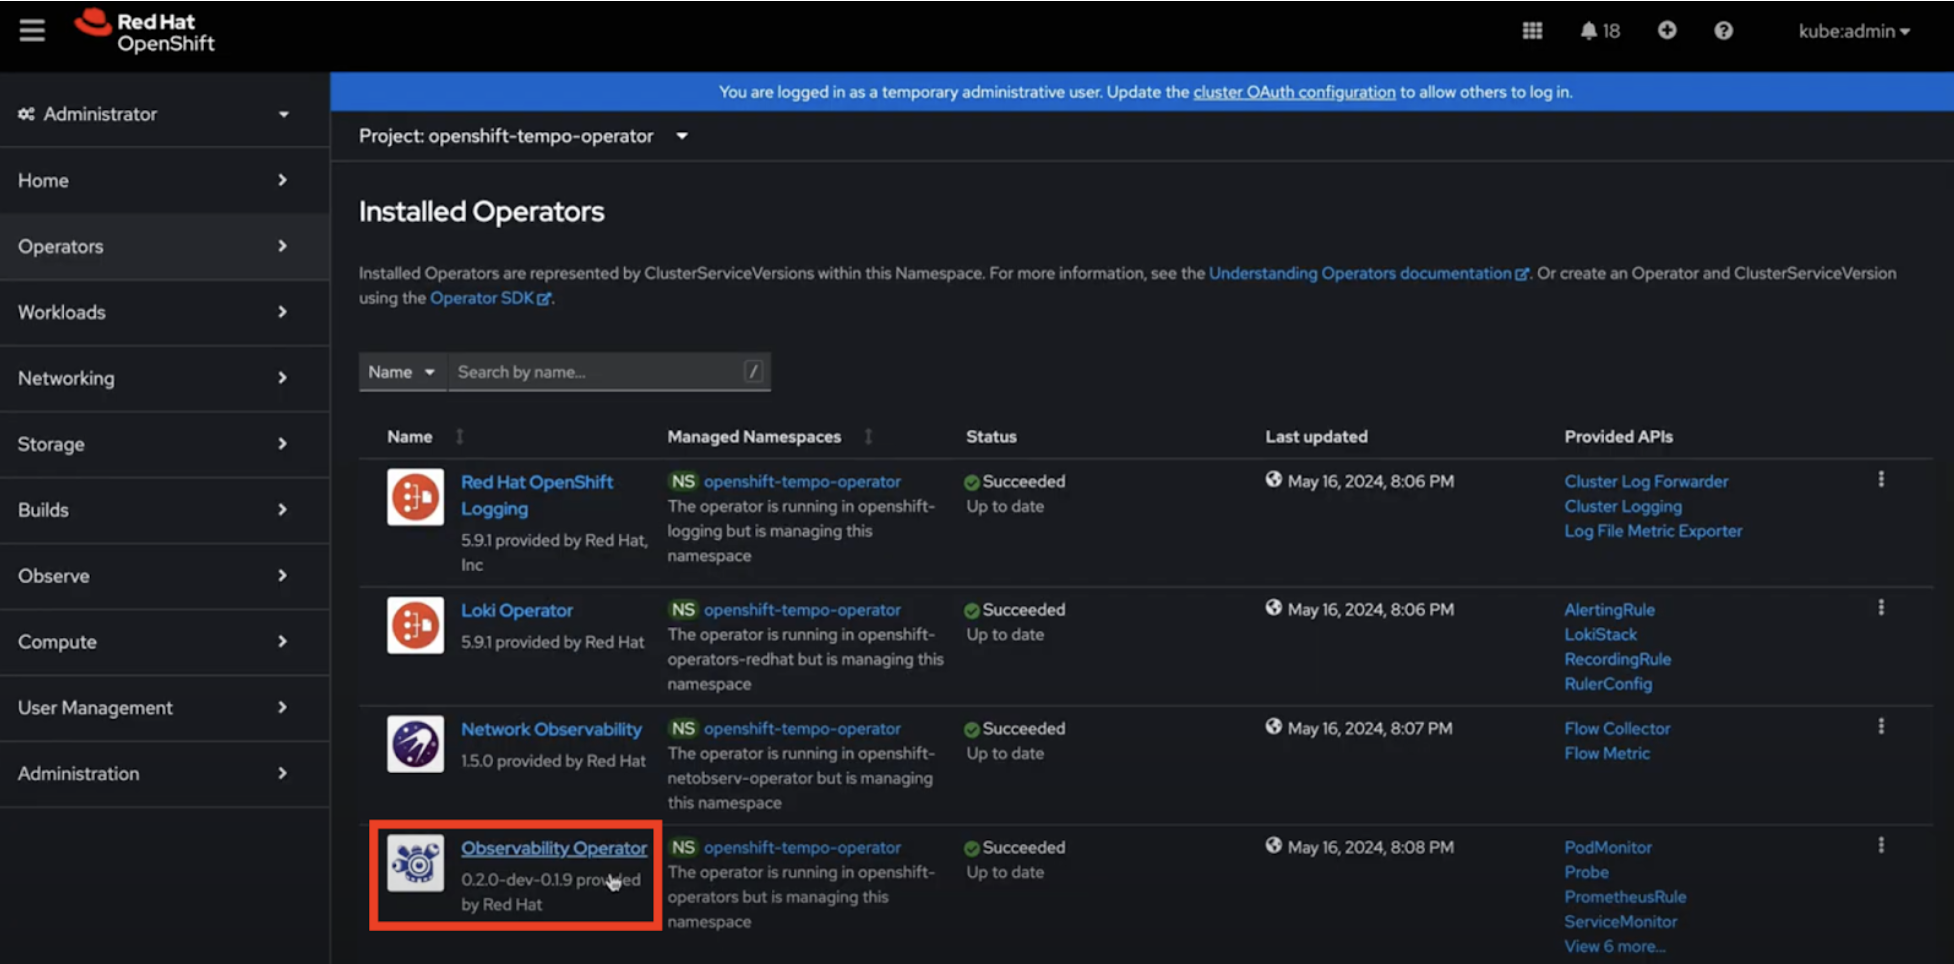
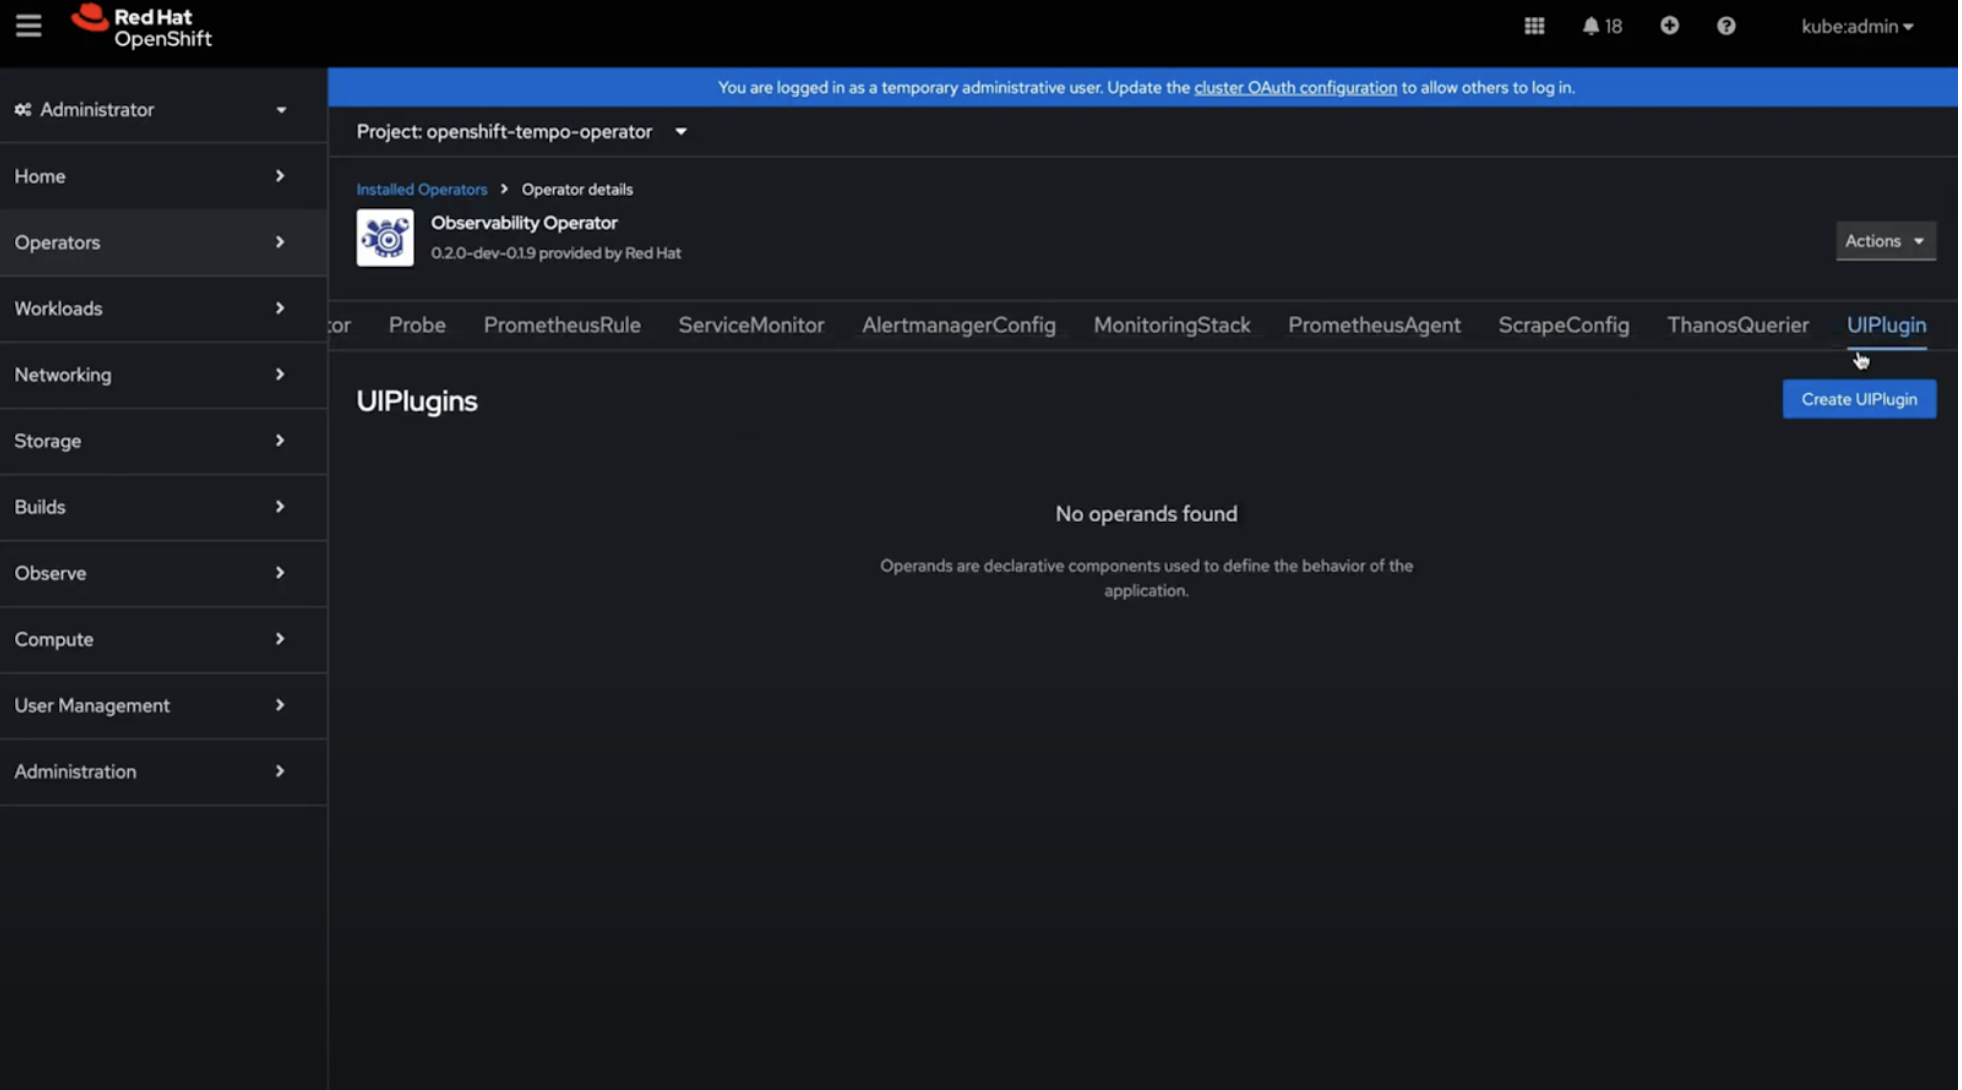
That includes the troubleshooting-panel, which is the heart of the observability signal correlation experience. As displayed in Figure 2, click Create UIPlugin in the operator details section of your (now) installed Cluster Observability Operator. Note that creating the plug-in will also automatically install Korrel8r.

Create UIPlugin
Figure 2: Create UIPlugin button.

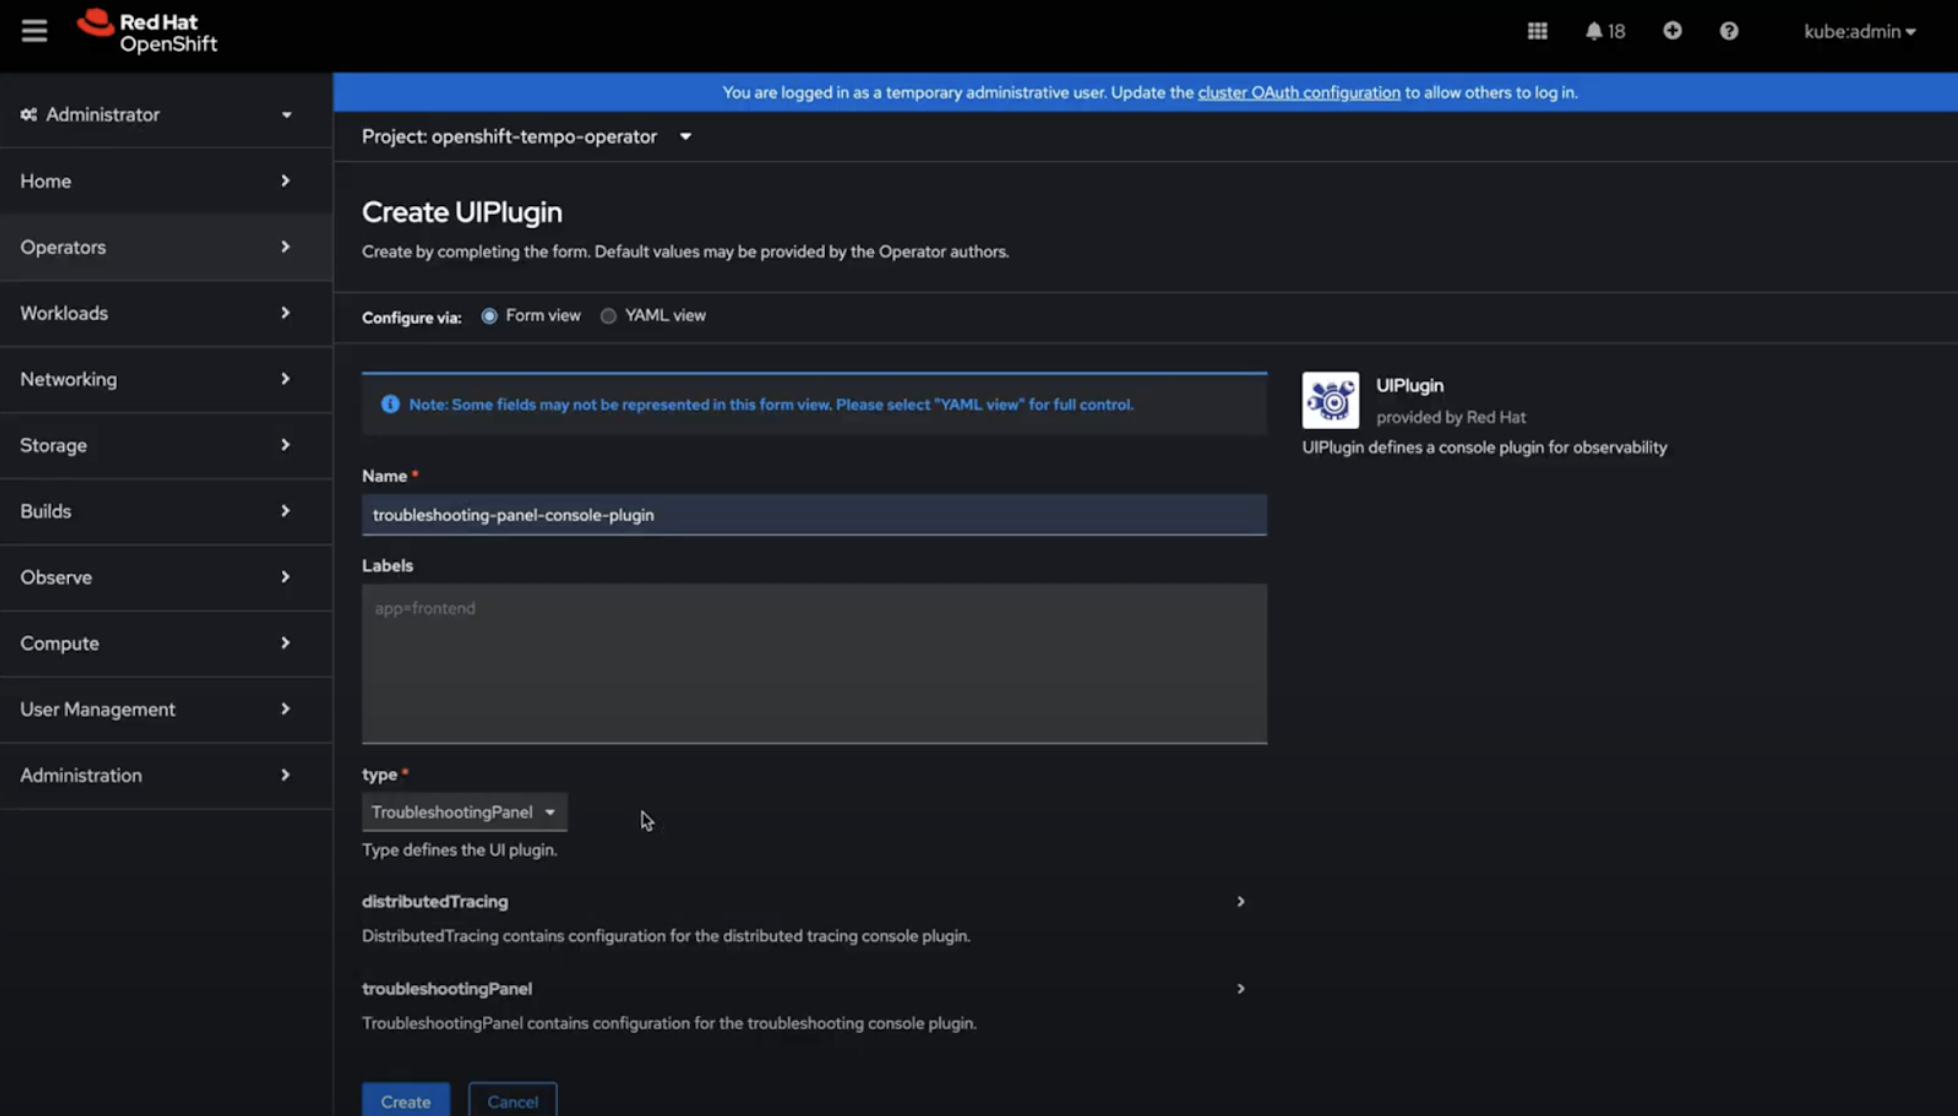
When creating the plug-in, make sure to name it troubleshooting-panel and select TroubleshootingPanel as the type, as shown in Figure 3. Then click Create.

Getting started with the Troubleshooting Panel
Figure 3: Naming the plug-in and selecting TroubleshootingPanel.

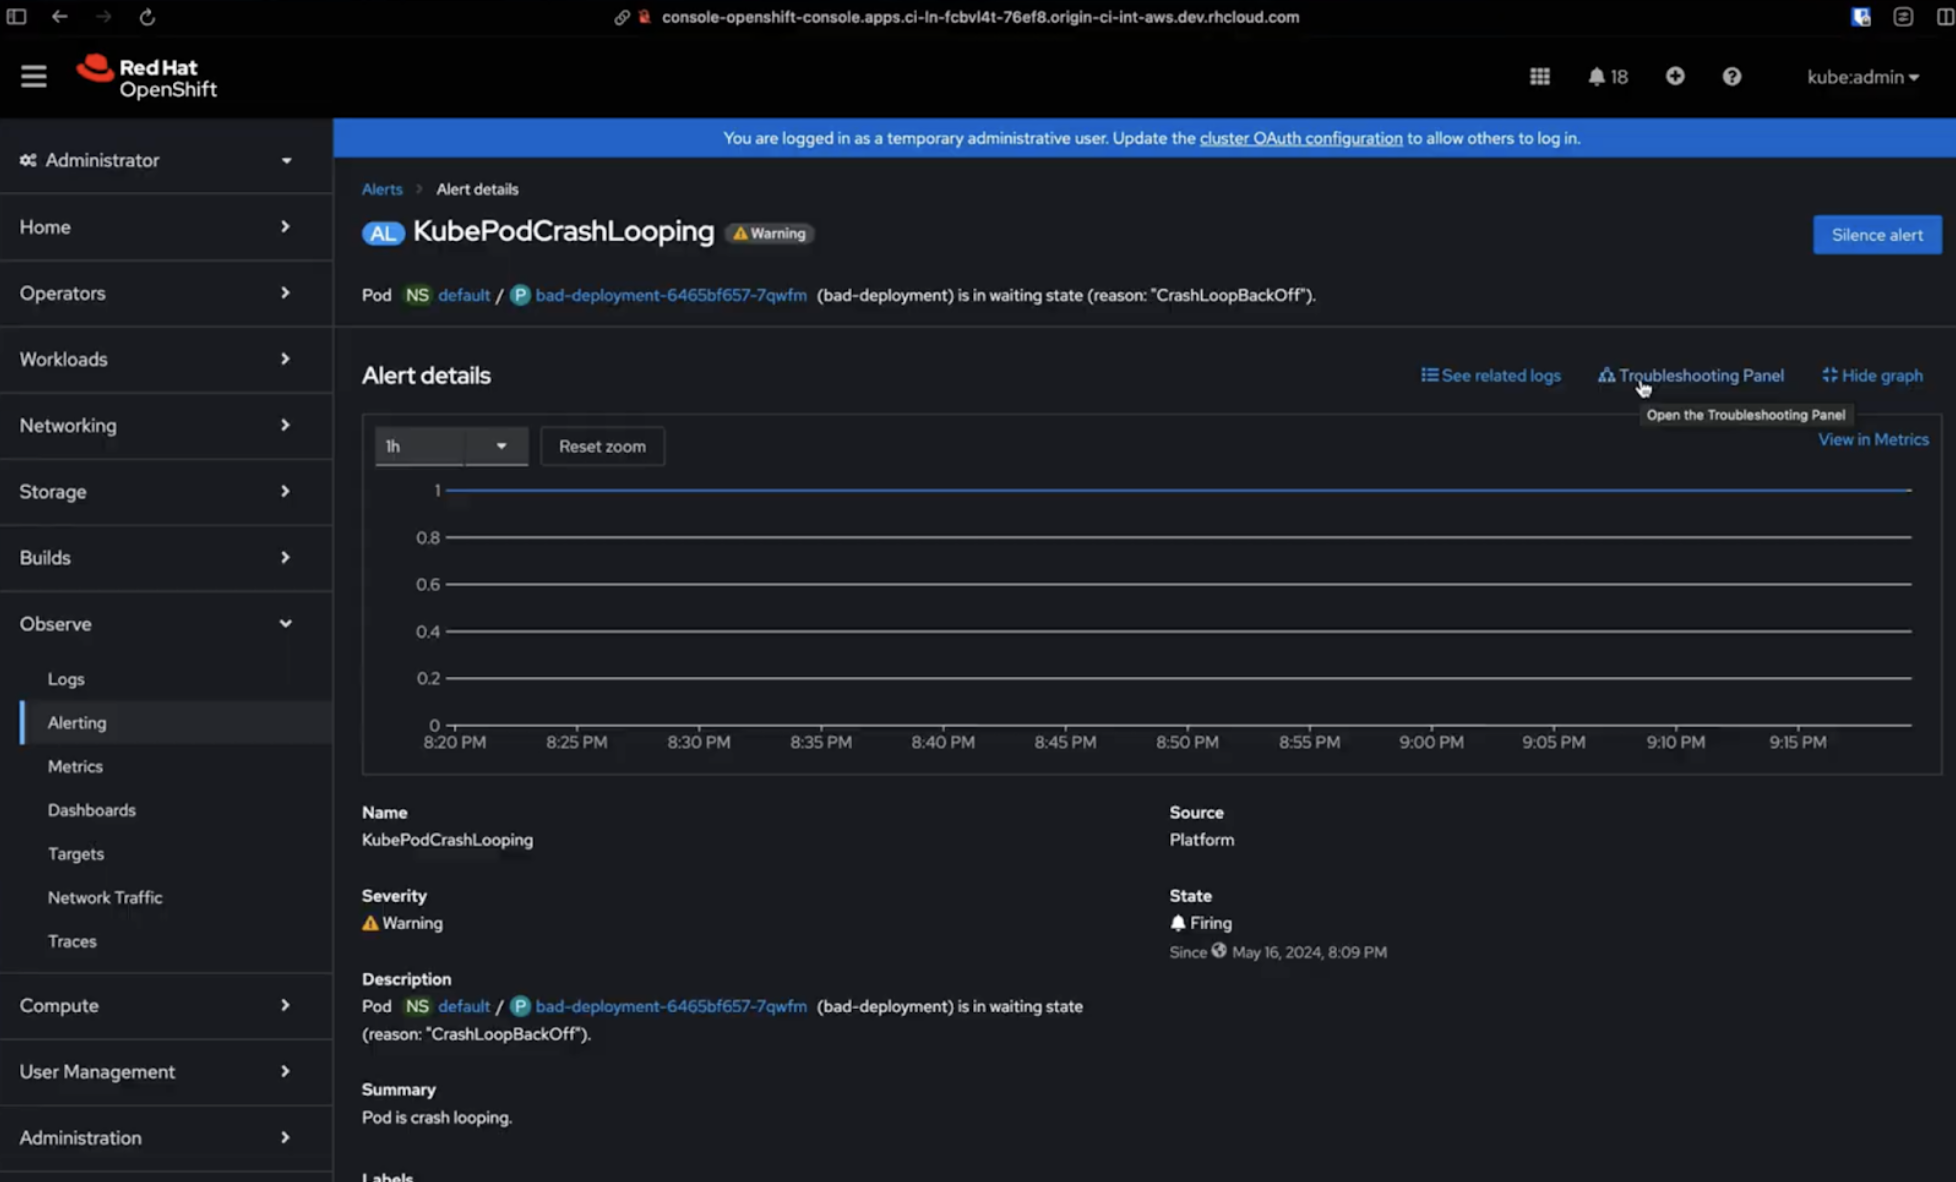
You will then be able to access the troubleshooting panel by clicking Observe → Alerting, as displayed in Figure 4.

Get started navigating observability signals
Figure 4: Click Observe then Alerts to access the troubleshooting panel.

A floating panel will then pop up on the side of the screen, starting with the Korrel8r query related to that specific alert—the starting point of the troubleshooting journey itself. Note that installing the Logging and Network Traffic plug-ins is not necessary for making use of the troubleshooting panel and for the Korrel8r backend to work. However, if not installed, the corresponding relations to logs and netflows will not be rendered in the UI. Based on your use cases, we highly recommend the installation of both. See Figure 5.

Overview of Troubleshooting Panel
Figure 5: Overview of troubleshooting panel.

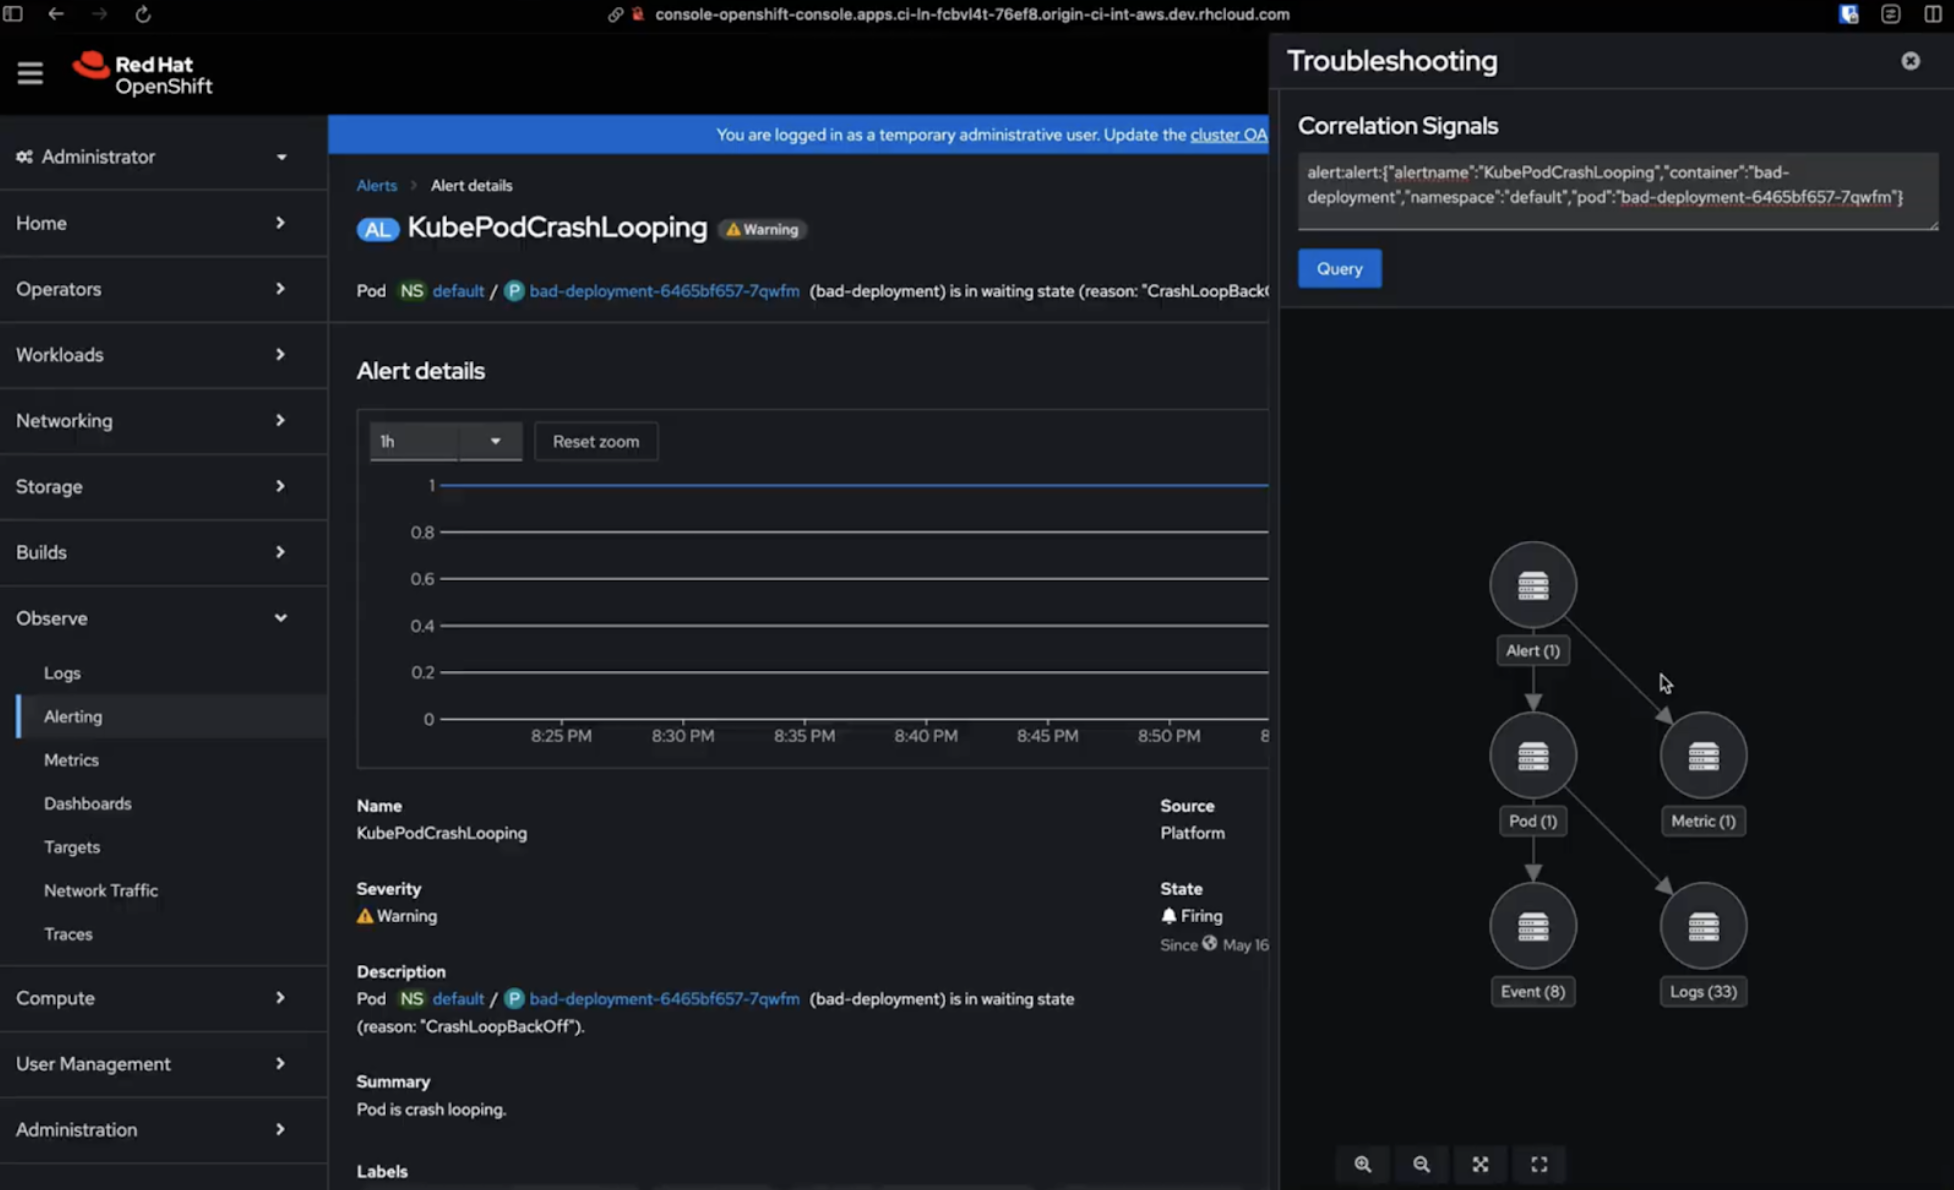
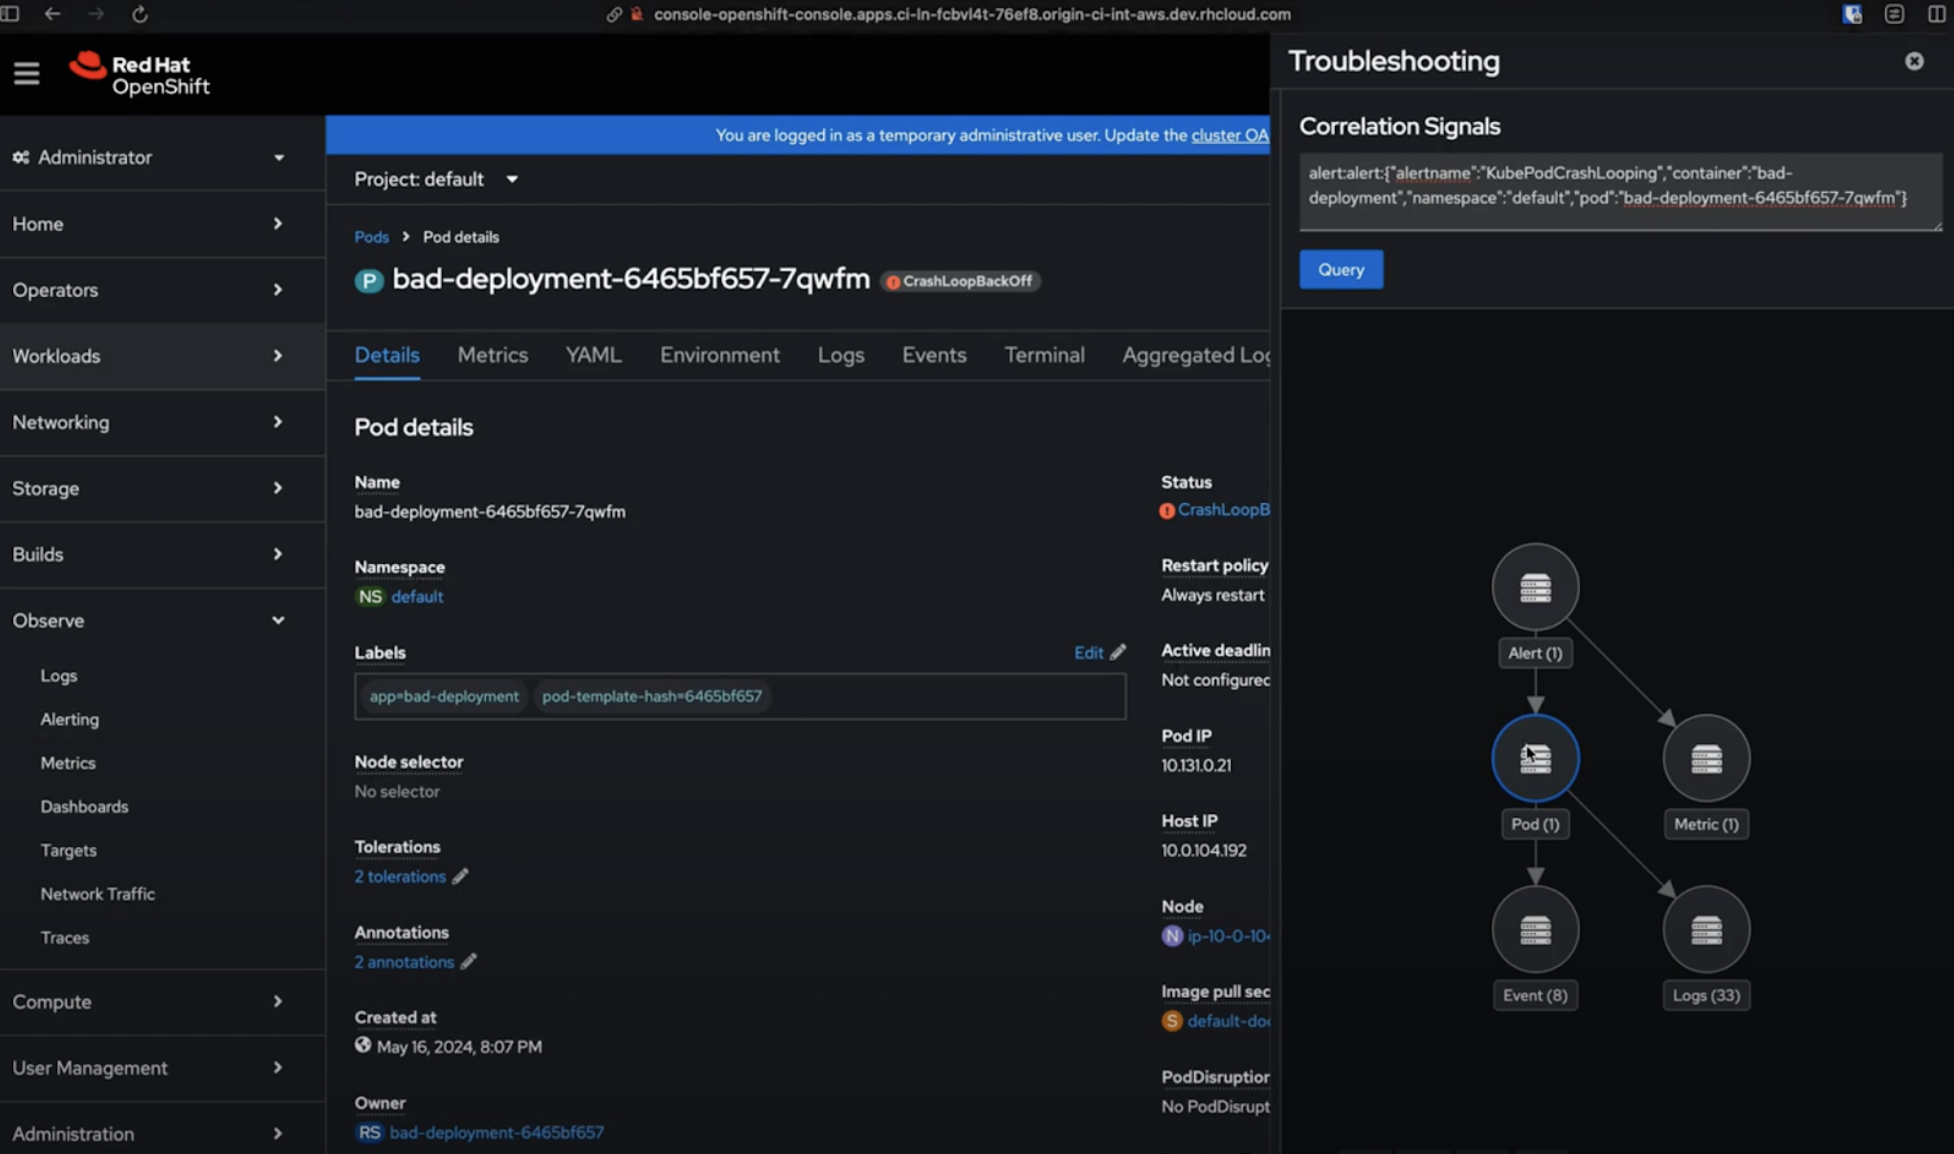
The troubleshooting panel is interactive, meaning that users can click each icon/node and be automatically redirected to the web console UI that displays that specific information—in this case, a pod. See Figure 6.

From an alert to pods
Figure 6: Pod information displayed in the web console UI.

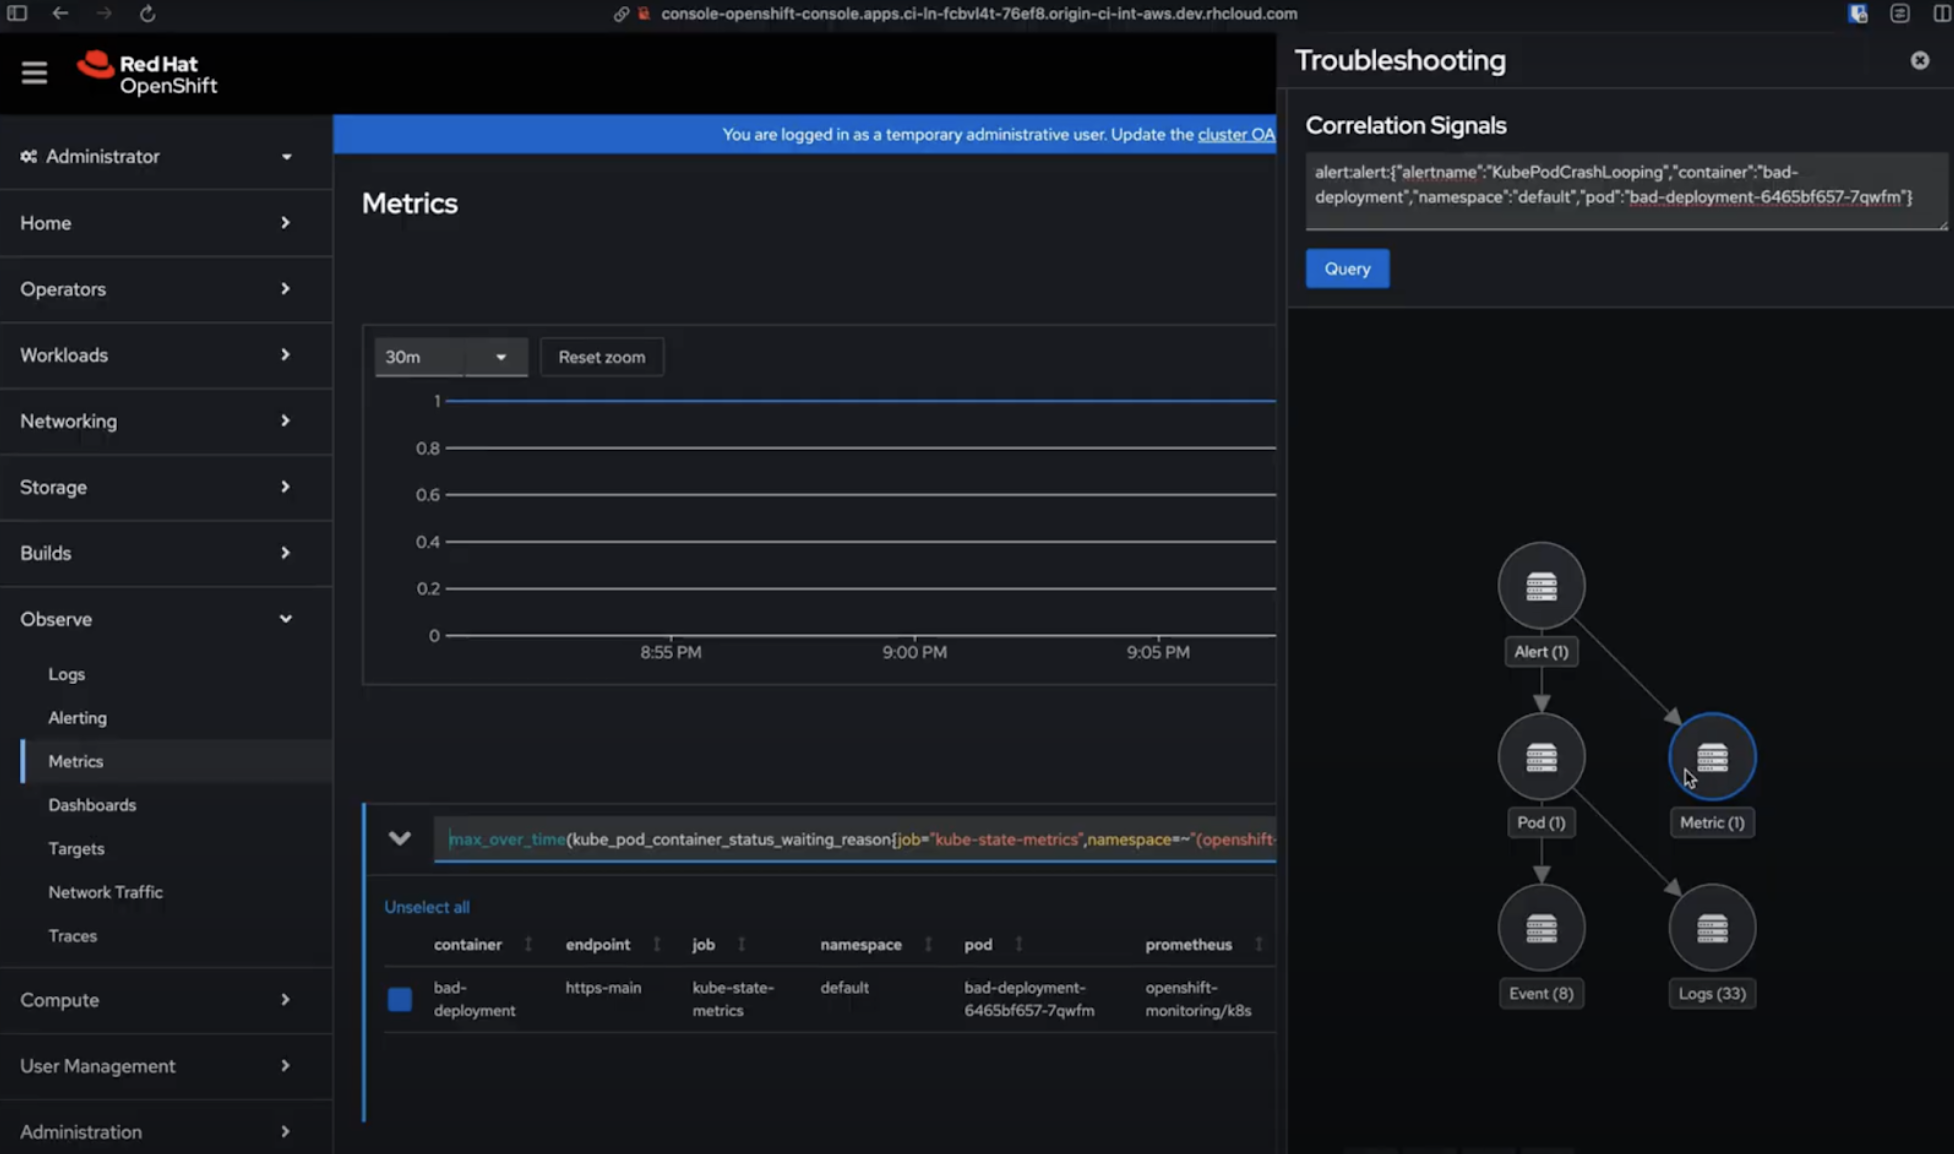
From the starting alert, I can go to the correlated Metric, too (Figure 7).

From an alert to metrics
Figure 7: Correlated Metric.

And also to the corresponding events (Figure 8).

From an alert to events
Figure 8: Corresponding Events.

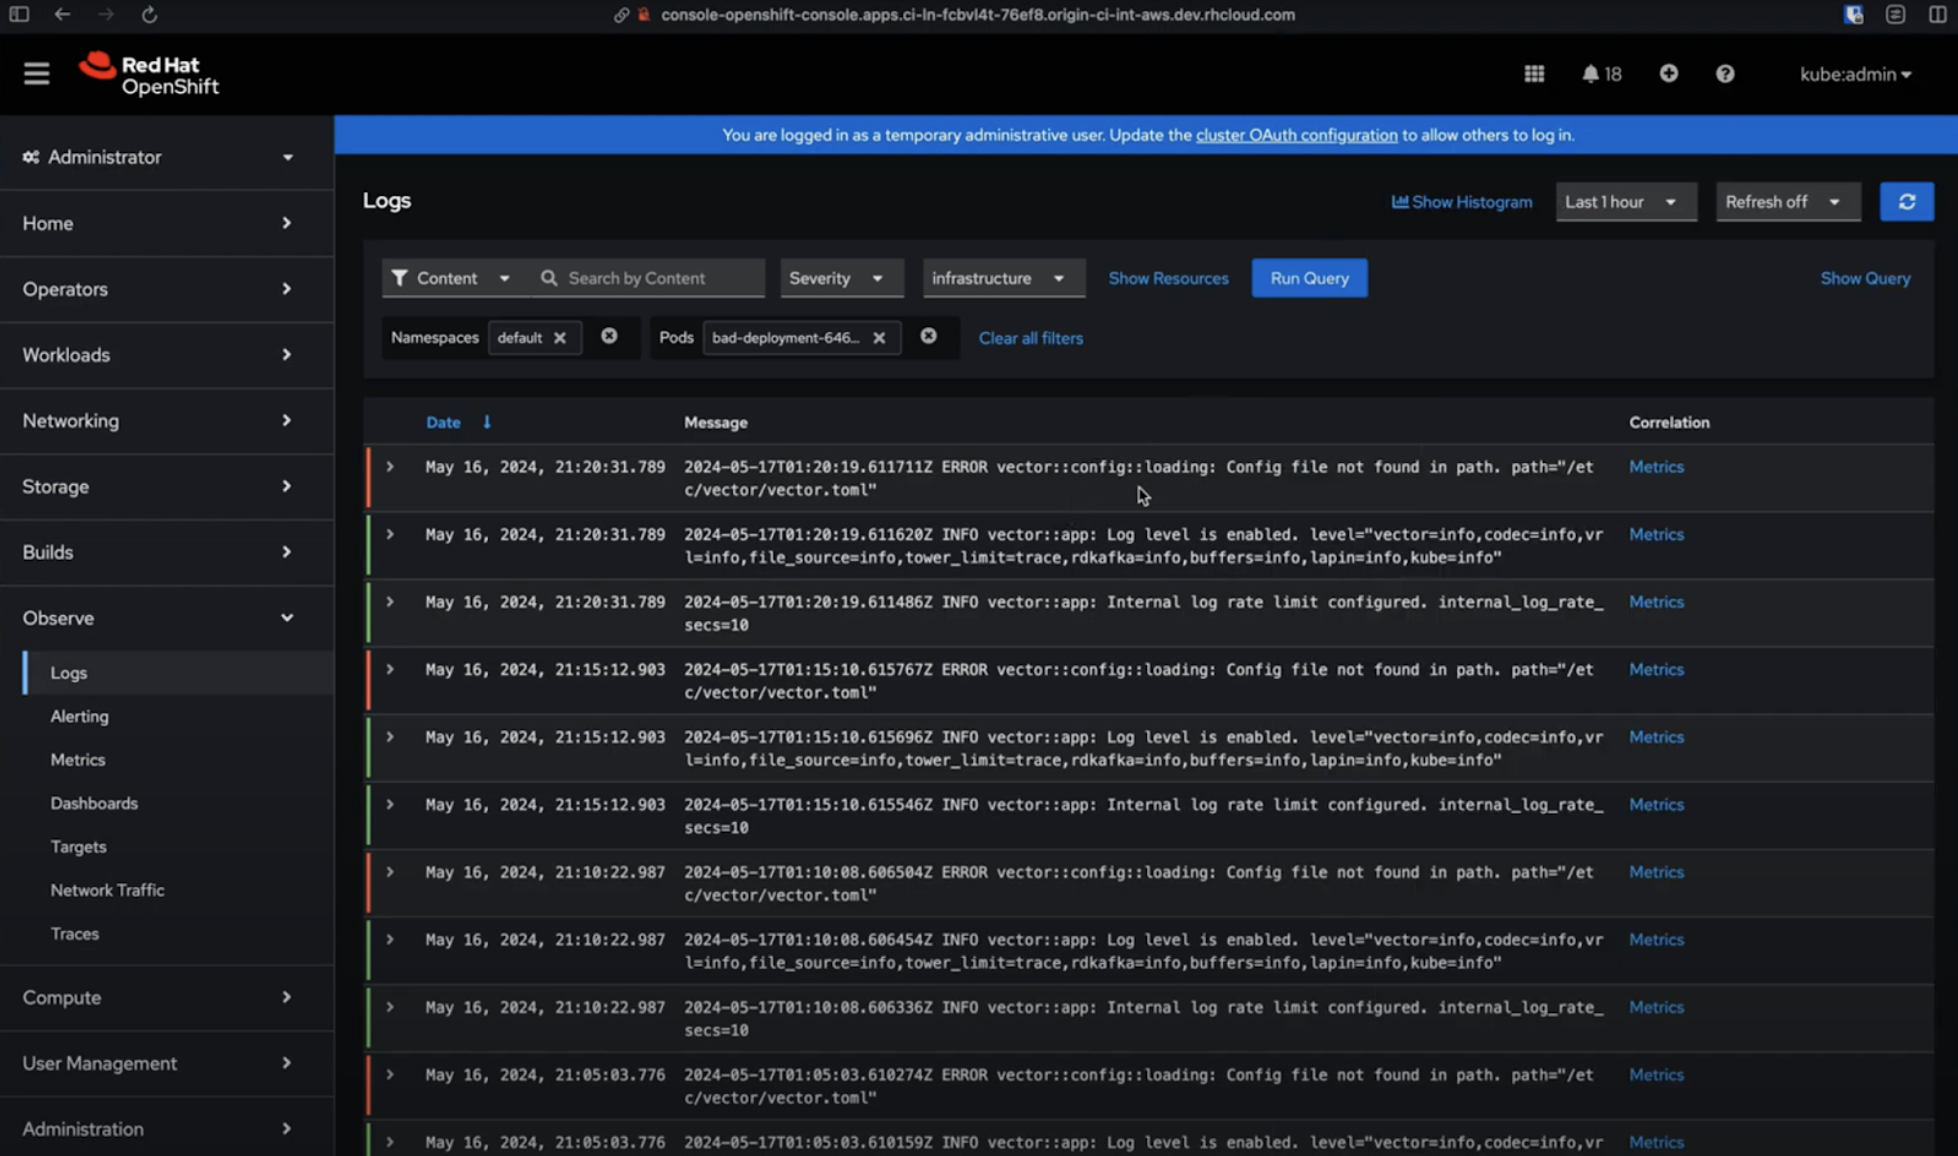
And logs (Figure 9).

From an alert to logs
Figure 9: Corresponding Logs.

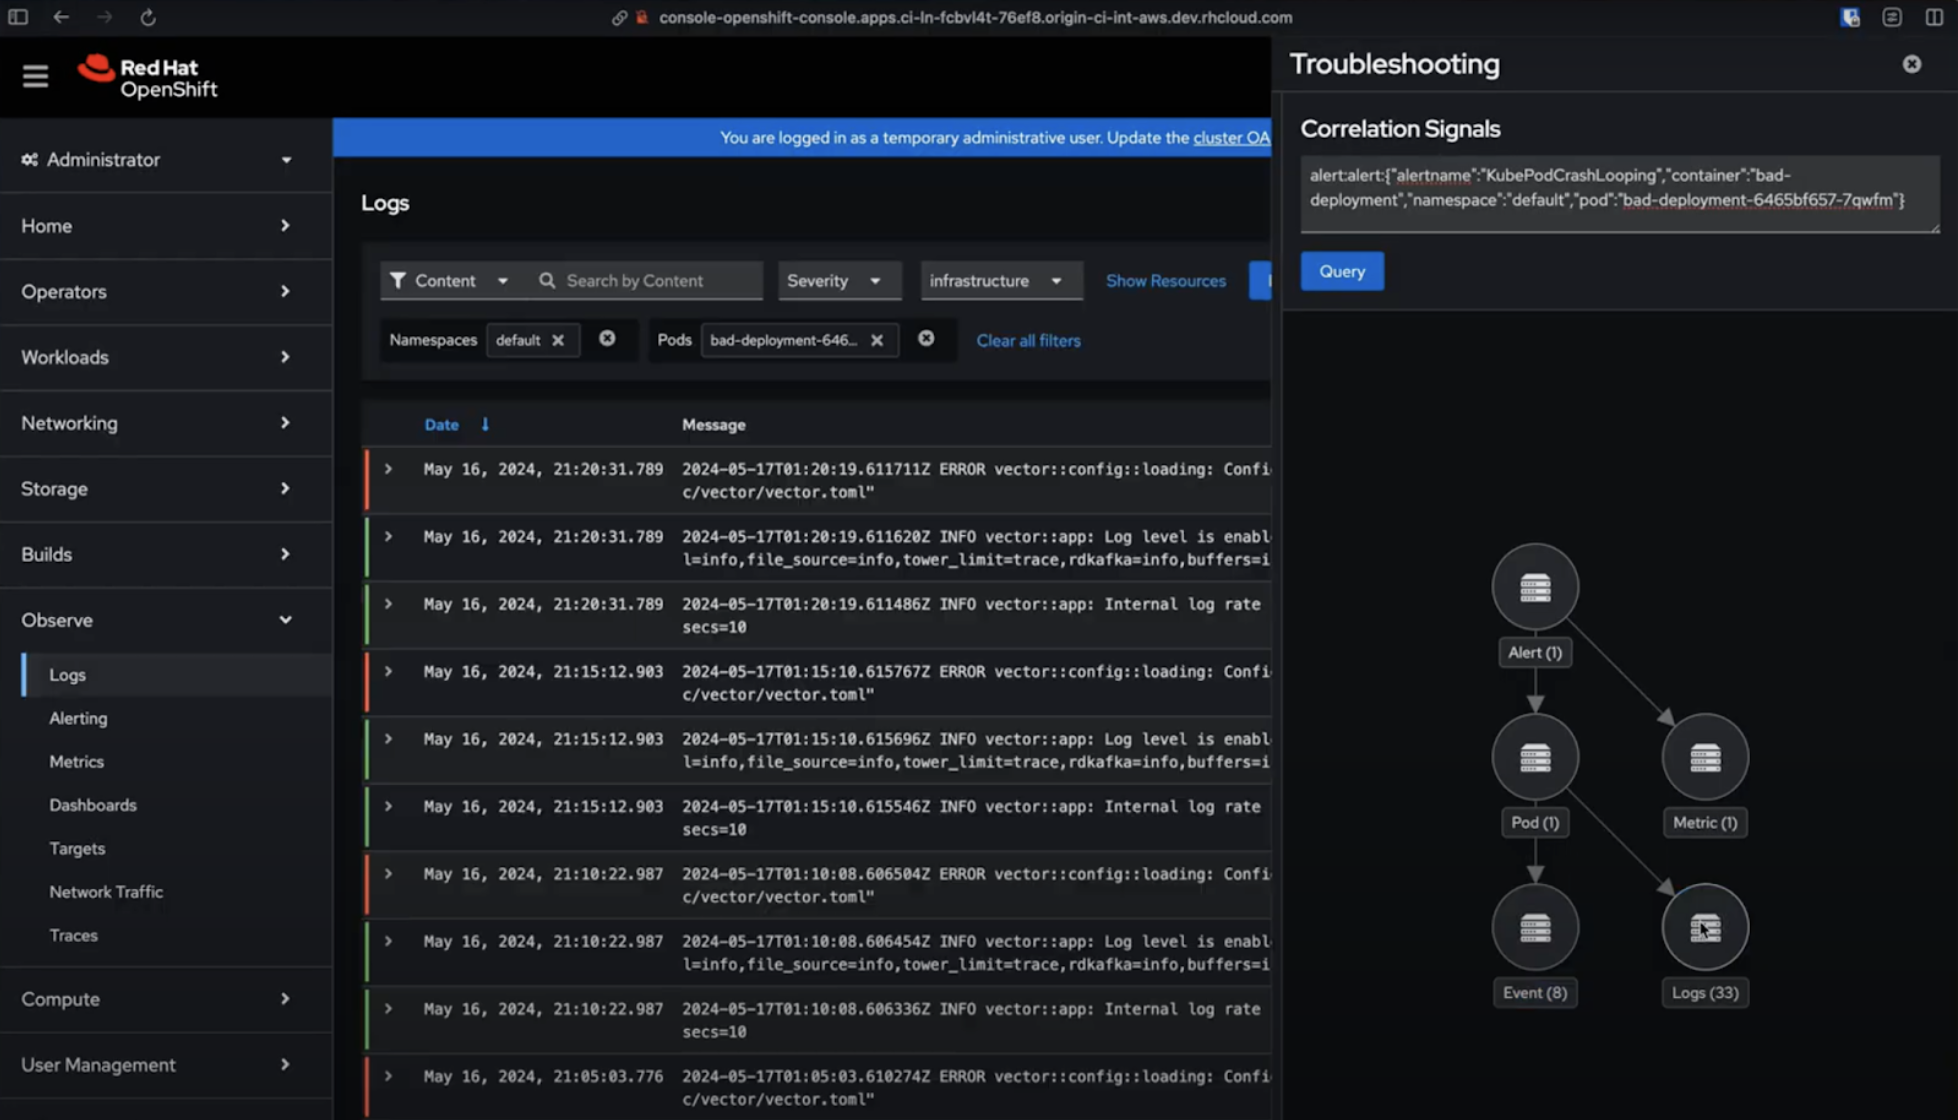
There, I can easily take a look at the cause behind that starting alert (Figure 10).

Overview of logs
Figure 10: Overview of Logs and cause of starting alert.

What's next?

Observability signal correlation for Red Hat OpenShift is part of the Observability troubleshooting journey initiative, which is a structured approach designed to improve the efficiency and effectiveness of identifying and resolving issues within your cluster(s). The objectives of the initiative include:

  • Focusing on the diagnostic data that matters and minimizing the cognitive load required to deal with such increasing data volume and noise.
  • Facilitating the root cause analysis and reduce the mean time to detection (MTTD), and thus minimizing the time required to detect incidents.
  • Reducing the mean time to resolution (MTTR), and thus minimizing the time required to resolve issues.

More features are planned to be delivered this year, including a Technology Preview of observability signal correlation for Red Hat OpenShift and a Developer Preview of incident detection. We are looking forward to receiving your feedback. You can share your questions and recommendations with us using the Red Hat OpenShift feedback form. 

Related Posts

  • Building an observability stack for automated performance tests on Kubernetes and OpenShift (part 2)

  • Network observability with eBPF on single node OpenShift

  • Packet capture using Network Observability eBPF Agent

  • OpenTelemetry: A Quarkus Superheroes demo of observability

  • Observability in 2022: Why it matters and how OpenTelemetry can help

  • Network observability with eBPF on single node OpenShift

Recent Posts

  • More Essential AI tutorials for Node.js Developers

  • How to run a fraud detection AI model on RHEL CVMs

  • How we use software provenance at Red Hat

  • Alternatives to creating bootc images from scratch

  • How to update OpenStack Services on OpenShift

What’s up next?

Learn the foundations of OpenShift through hands-on experience deploying and working with applications, using a no-cost OpenShift cluster through the Developer Sandbox for Red Hat OpenShift.

Start the activity
Red Hat Developers logo LinkedIn YouTube Twitter Facebook

Products

  • Red Hat Enterprise Linux
  • Red Hat OpenShift
  • Red Hat Ansible Automation Platform

Build

  • Developer Sandbox
  • Developer Tools
  • Interactive Tutorials
  • API Catalog

Quicklinks

  • Learning Resources
  • E-books
  • Cheat Sheets
  • Blog
  • Events
  • Newsletter

Communicate

  • About us
  • Contact sales
  • Find a partner
  • Report a website issue
  • Site Status Dashboard
  • Report a security problem

RED HAT DEVELOPER

Build here. Go anywhere.

We serve the builders. The problem solvers who create careers with code.

Join us if you’re a developer, software engineer, web designer, front-end designer, UX designer, computer scientist, architect, tester, product manager, project manager or team lead.

Sign me up

Red Hat legal and privacy links

  • About Red Hat
  • Jobs
  • Events
  • Locations
  • Contact Red Hat
  • Red Hat Blog
  • Inclusion at Red Hat
  • Cool Stuff Store
  • Red Hat Summit

Red Hat legal and privacy links

  • Privacy statement
  • Terms of use
  • All policies and guidelines
  • Digital accessibility

Report a website issue