Foreword
Cryostat 4.0 has been released, and it’s an especially noteworthy one: this marks Cryostat’s graduation from Tech Preview to Generally Available as a supported product. With this comes some under-the-hood architectural enhancements for performance and security, as well as some significant new features.
Introduction
In this article we will examine one of the two most visible new features of Cryostat 4.0: its new OpenShift Console Plugin. The other major new feature, Agent Autoconfiguration, was previously covered on this blog.
When you install the Red Hat Build of Cryostat Operator on an OpenShift 4.15+ cluster, the Operator will also set up a Dynamic Plugin in your OpenShift Web Console. This plugin makes it even quicker and easier to access Cryostat functionality by exposing it directly within the Console UI.
Getting Started
First, ensure that your OpenShift cluster is running version 4.15+. The Cryostat Operator can be installed on clusters back to OpenShift version 4.12, but the Console Plugin is only compatible with 4.15+. If you install the Operator on a version from 4.12-4.14 then all other Cryostat functionality will be available but you will not have access to the Console Plugin.
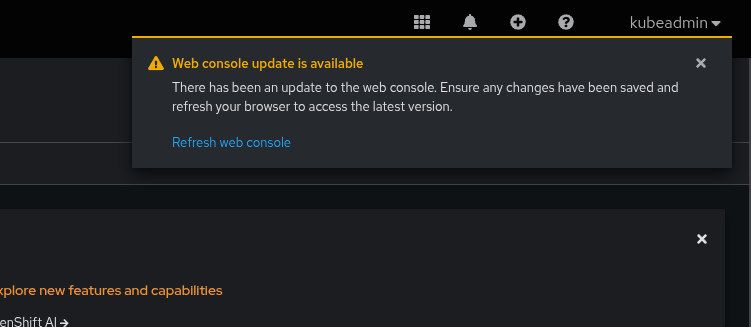
Open your Console, log in as an admin user, and go to the Administrator Perspective. From there, expand the Operators tab in the navigation panel, then go to OperatorHub. Search for Cryostat and install the Red Hat Build of Cryostat Operator 4.0. It may take some time for this operation to complete. Once it does, the Console will display a notification prompting you to refresh the page to view changes to the Console. After refreshing the page you will notice a new Cryostat tab at the bottom of the navigation panel. If you do not see the notification you can simply refresh the page after some time, until the Cryostat tab does appear.
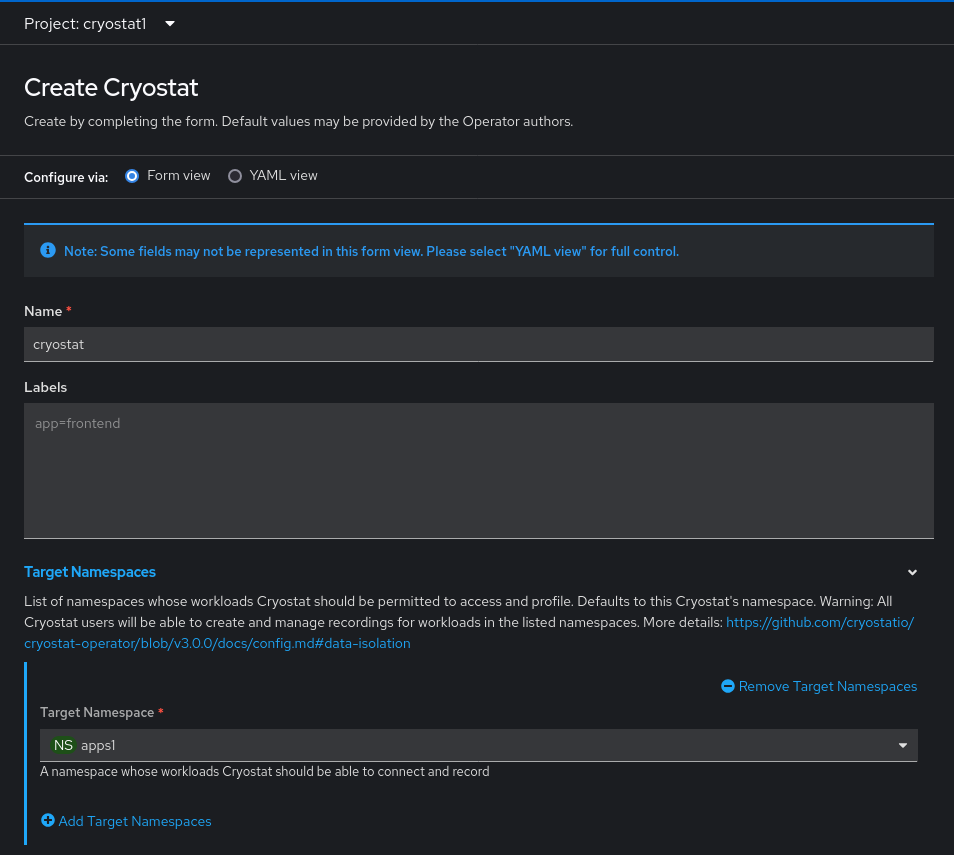
From the Operators tab, under Installed Operators, click the Cryostat item in the “Provided APIs” column for the Cryostat Operator. This will bring you to a form for creating a Cryostat Custom Resource instance. Without diving into too much detail, this Custom Resource is used to tell the Operator how to configure the Cryostat instance(s) you would like to install within the cluster. The Cryostat Console Plugin allows you to communicate with each of these instances from one centralized UI, rather than needing to visit each Cryostat’s UI separately. Go ahead and create a Cryostat Custom Resource. In this example we have a Project named cryostat1 where the Cryostat instance will be installed, and a Project named apps1 where our workload application is installed.
Using the Console Plugin
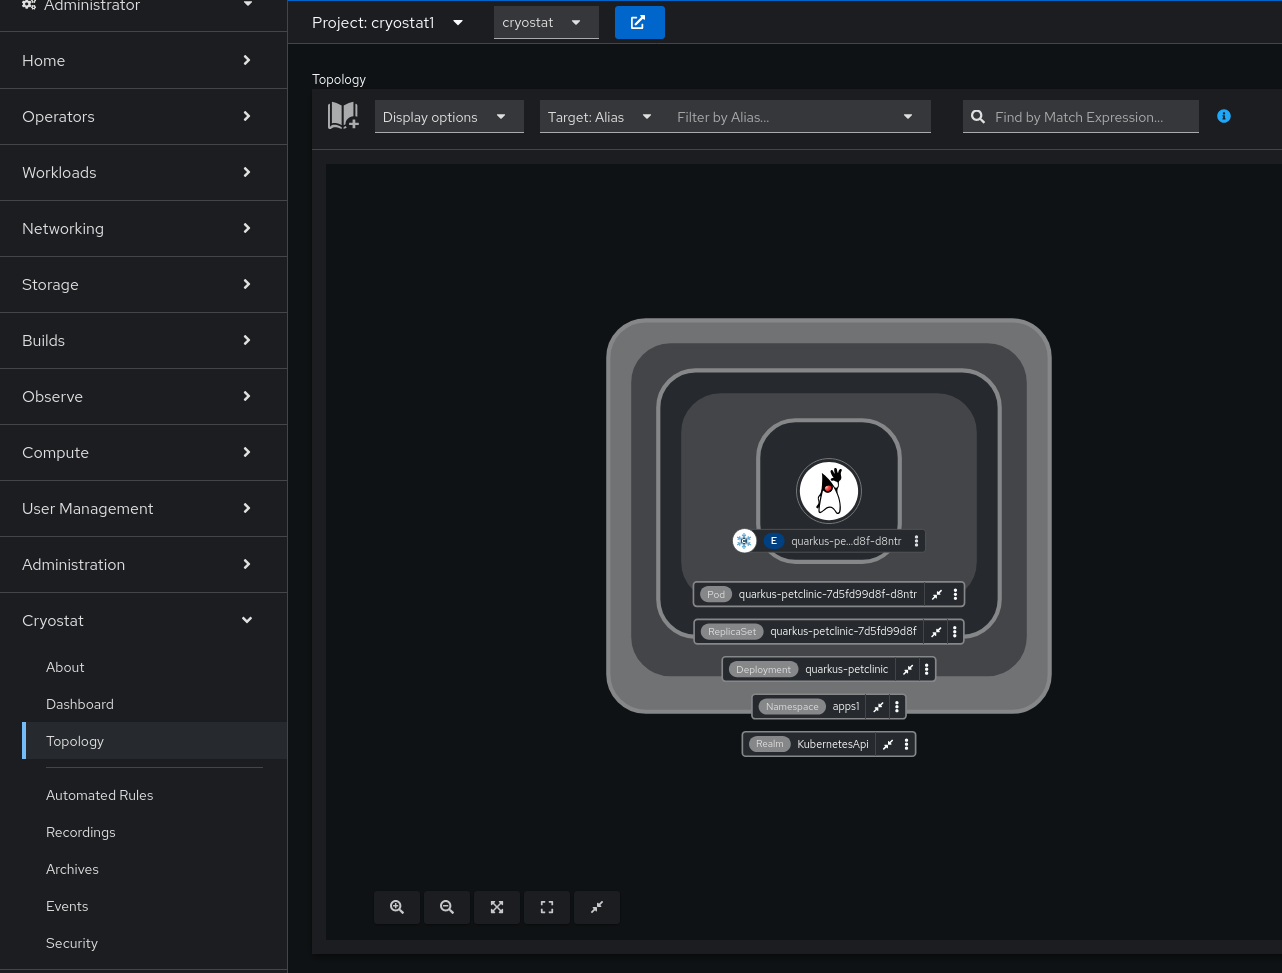
Once we have everything created and at least one Cryostat instance ready, we can check out the new Cryostat Console Plugin UI. Here we see a familiar Project Context Selector bar at the top of the view, and beside that a Cryostat instance selector. We can select “All Projects” in the Project selector so that every Cryostat instance is available for selection, or we can narrow our selection to a single Project to see only the Cryostat instances within that Project. This way we can quickly and accurately move between Cryostat instances. Let’s select the cryostat1 Project and the cryostat instance within it which we just created.
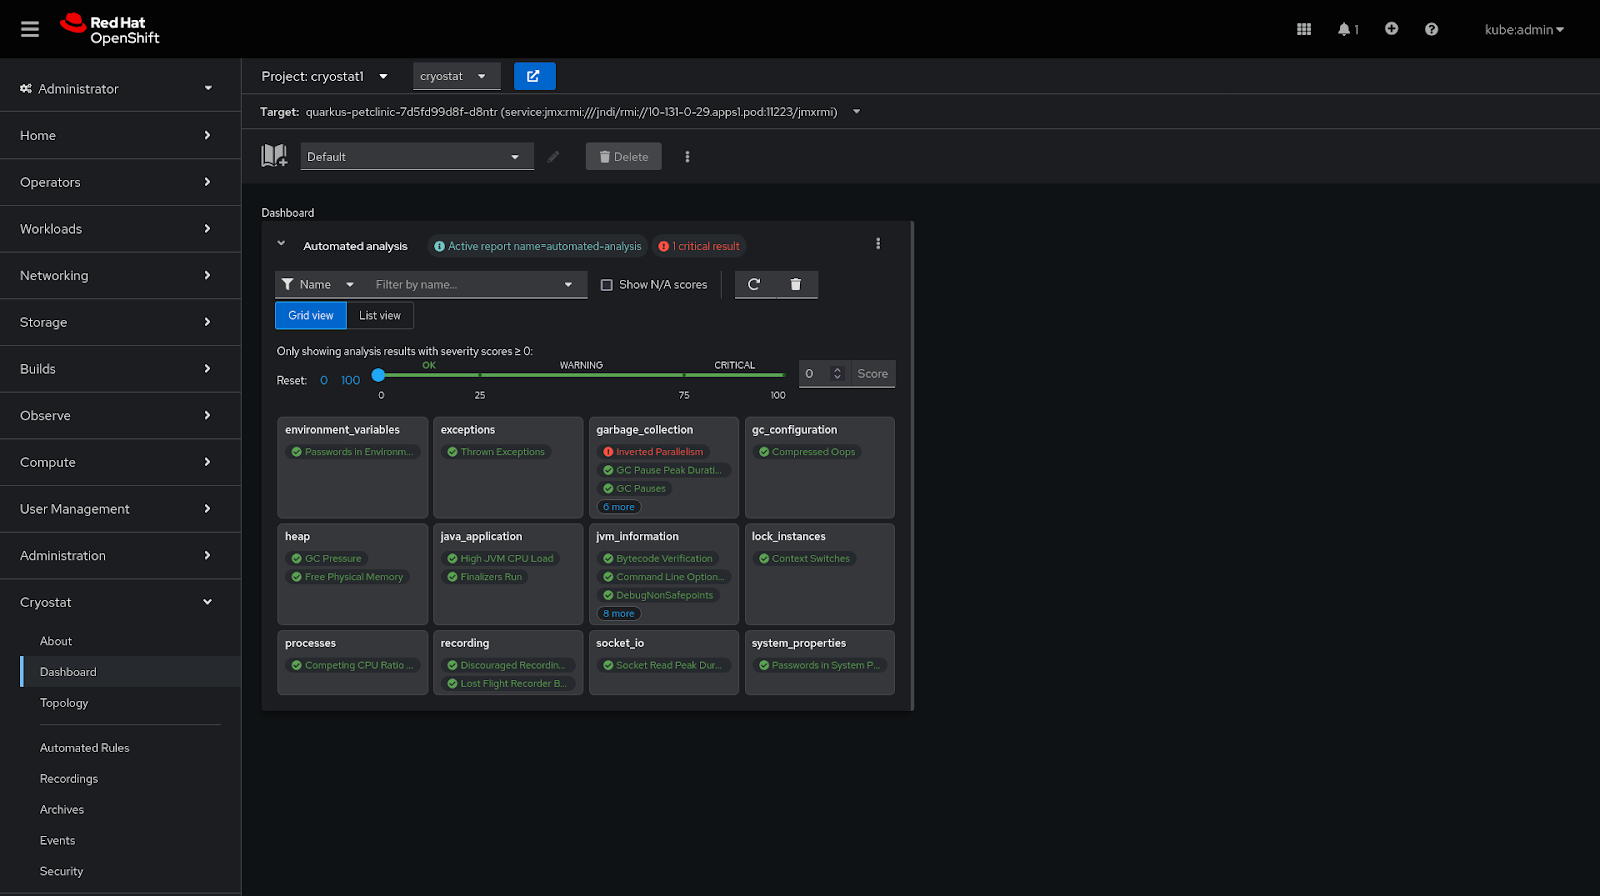
Now, the sub-tabs within the Cryostat Plugin UI can be used in much the same way that we would use the standalone Cryostat Web UI. For more information about Cryostat features, check out its Red Hat Product Page or the upstream documentation website. The Topology view, for example, can show us all of the target applications that our selected Cryostat instance is aware of. The Recordings and Events views can give us information about the JDK Flight Recorder events and recordings present in any of those target applications, and the Automated Rules view can be used to set up rules for the Cryostat instance to capture data from target applications as they are discovered. The Dashboard can be used to quickly evaluate the performance of your applications, including automated analysis of Flight Recorder data to highlight potential issues.
There are only a few differences between the Cryostat Plugin UI and the standalone Cryostat Web UI. There is a button on the project selector bar that opens the standalone Cryostat Web UI in a new tab, which you can use in any of the following cases:
- File uploads are only possible in the standalone Cryostat Web UI. If you have a JFR file that you’d like to upload into the Cryostat archives, or an Automated Rules JSON definition file to create, or a
.jfcCustom Event Template to define, you will need to open the Cryostat Web UI to do so. - Advanced settings are only available in the standalone Cryostat Web UI. This includes settings for tailoring which notifications appear, or setting defaults for the Automated Analysis dashboard card, or setting the dark/light theme.
- The Cryostat Plugin UI does not have its own notification drawer and does not integrate into the Console notification drawer. Cryostat Plugin UI notifications will appear as popups and will time out or can be manually cleared, but cannot be reviewed after they have disappeared.
Conclusion
The new Cryostat OpenShift Console Plugin 4.0 gives you direct, convenient access to all of your Cryostat instances within a single UI, with no additional authentication/authorization step, so that you can spend less time gathering and finding your JDK application observability metrics and more time analyzing and responding to them. For more information about what kind of information you can obtain and analyses you can perform using Cryostat, check out its Red Hat Product Page or the upstream documentation website.