In the fast-paced world of application development and deployment, monitoring plays a crucial role in ensuring the reliability and performance of applications. Red Hat OpenShift, a Kubernetes-based container platform, provides a robust environment for deploying and managing containerized applications. In this post, we'll explore how to set up effective application monitoring using Event-Driven Ansible automation and Alertmanager on OpenShift.
The process includes the following steps:
- Access the OpenShift cluster.
- Deploy the Quarkus application, Event-Driven Ansible, Prometheus, and Alertmanager.
- Test the Event-Driven Ansible functionality.
Why Event-Driven Ansible matters
Traditional Ansible playbooks are typically executed on a schedule or triggered manually. In contrast, an event-driven approach enables Ansible to respond to specific events, such as alterations in the infrastructure or the deployment of a new application. This facilitates a more dynamic and responsive automation process.
The fundamental principle of event-driven automation follows the source-rule-action formula, and its blueprint is maintained in the rulebook.yml.
Prerequisites
- OpenShift or Kubernetes cluster.
- Admin access to the cluster.
- Knowledge of following components:
- OpenShift or Kubernetes.
- Ansible and Event-Driven Ansible.
- Prometheus and Alertmanager.
1. Access the OpenShift cluster
To access the cluster, log in using the command provided below in the command-line interface (CLI):
$ oc login --token=<token> --server=https://api.crc.testing:6443
After successful login, you will find yourself in the default namespace/project.
Verify the logged-in user on the cluster:
$ oc whoami
admin
2. Deploy the Quarkus app, Event-Driven Ansible, Prometheus, and Alertmanager
To execute the process in this article, you must first have the Prometheus Operator installed in the default namespace (Figure 1).
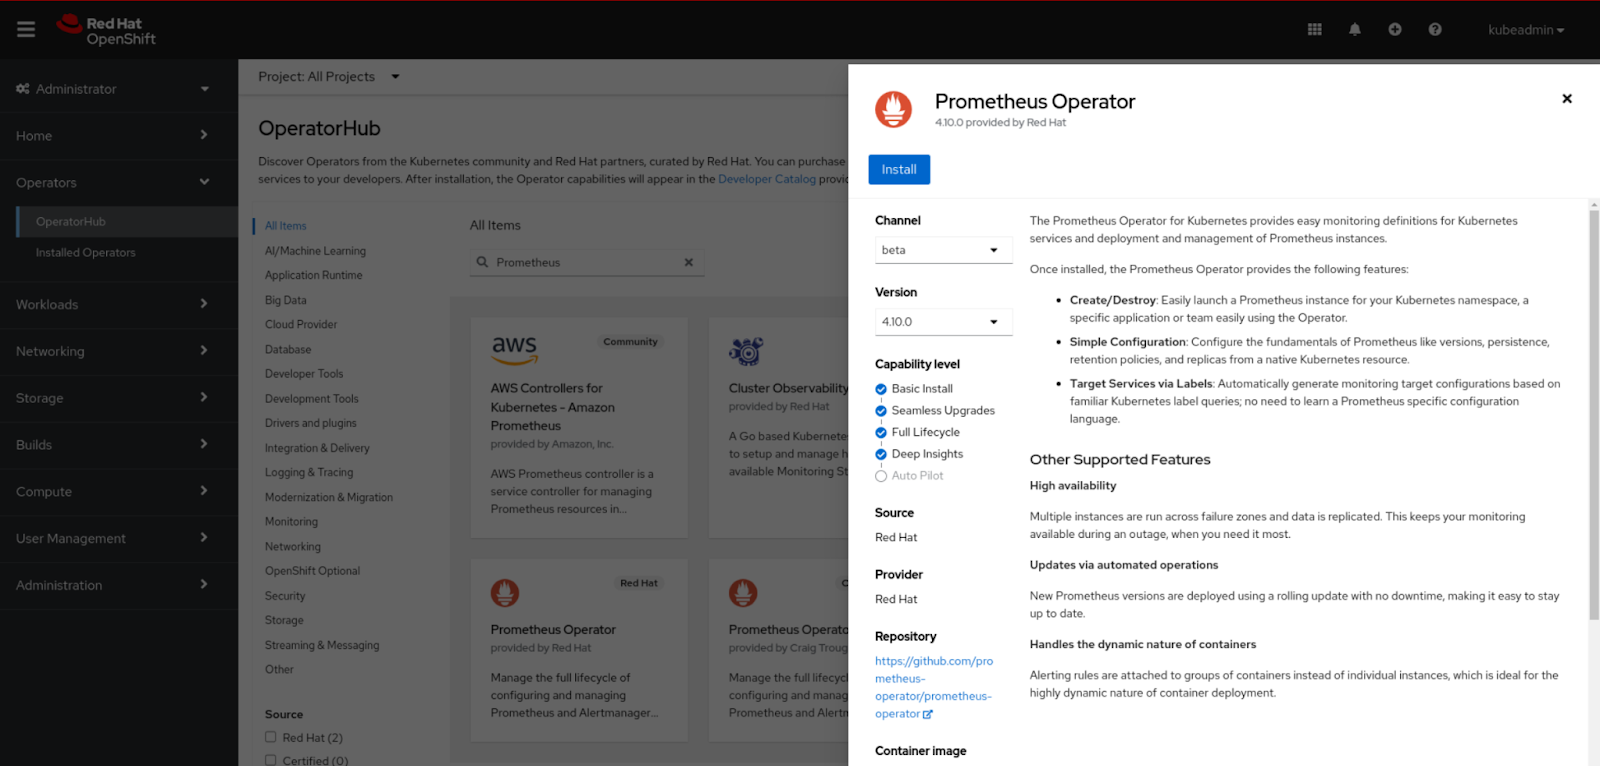
-
Install Prometheus using the Operator Hub:
- Log in to the Administrator perspective in the OpenShift cluster.
- From the left menu, select Operators.
- Search for Prometheus and click on Install.
- Choose the namespace for installation; for this article, it's
default.
-
Deploy the Quarkus application in the default namespace. You can use a sample Quarkus application from the below repo:
$ git clone https://github.com/redhat-developer-demos/ansible-eda-alertmanager.gitNavigate to the
kubernetesdirectory to initiate the deployment of the application:$ cd kubernetesUtilize the
occommand to create a resource for the Quarkus application using the manifest file:$ oc create -f 1-quarkus-monitor-kubernetes.yml service/quarkus-monitor created route.route.openshift.io/quarkus-monitor created deployment.apps/quarkus-monitor created -
Deploy the application service monitor resource to scrape metrics within the Kubernetes/OpenShift cluster, as illustrated below:
$ oc create -f 2-quarkus-monitor-servicemonitor.yaml servicemonitor.monitoring.coreos.com/quarkus-monitor created -
Deploy the Ansible EDA pod, which includes the rulebook and the action playbook:
$ oc create -f 3-ansible-eda-debug-kubernetes.yaml serviceaccount/ansible-eda created role.rbac.authorization.k8s.io/ansible-eda created rolebinding.rbac.authorization.k8s.io/ansible-eda created service/ansibleeda created deployment.apps/ansible-eda created -
Deploy the Alertmanager and Prometheus with help of manifest files, as shown below:
$ oc create -f 4-alertmanager.yaml
alertmanagerconfig.monitoring.coreos.com/config-example created
alertmanager.monitoring.coreos.com/example created
service/alertmanager-example created
route.route.openshift.io/alertmanager-example created
$ oc create -f 5-prometheus.yaml serviceaccount/prometheus created clusterrole.rbac.authorization.k8s.io/prometheus created clusterrolebinding.rbac.authorization.k8s.io/prometheus created prometheusrule.monitoring.coreos.com/prometheus-example-rules created prometheus.monitoring.coreos.com/prometheus created service/prometheus created
To gain access to the Prometheus dashboard, you need to create a route using the following command:
$ oc expose svc prometheus
Verify the status of all pods in your cluster using the oc command, as demonstrated below:
$ oc get pods
NAME                                   READY   STATUS    RESTARTS   AGE
alertmanager-example-0                 2/2     Running   0          16m
ansible-eda-b6b975d99-q8vmw            1/1     Running   0          19m
prometheus-operator-69cd6d678c-58xds   1/1     Running   0          21m
prometheus-prometheus-0                2/2     Running   0          12m
quarkus-monitor-86785b999-ll8n2        1/1     Running   0          25m
quarkus-monitor-86785b999-xf45f        1/1     Running   0          4m4s
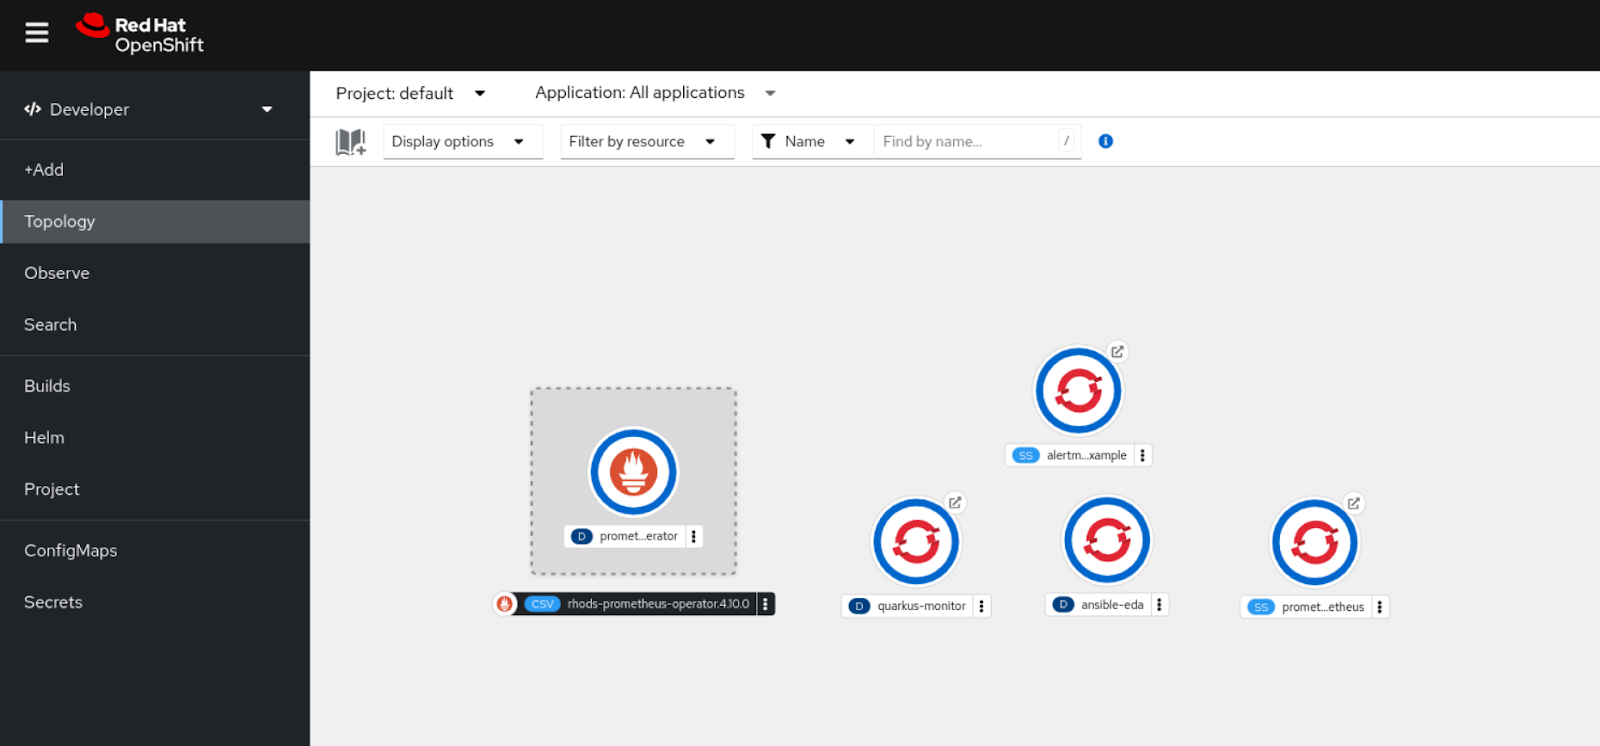
After deploying all resources, you will find the following five pods running in the Topology view (Figure 2).
3. Test Event-Driven Ansible functionality
Initially, navigate to the Topology view and click on the route icon ↗ associated with the Quarkus sample application pod. The application operates on API requests; when a request is sent to https://<route-url>/hello/consume/<input>, it adjusts the memory consumption of the pod within the cluster. Examining the Alertmanager rule, it is configured to a threshold of 20.
Upon exceeding this limit, it will trigger an alert in the Alertmanager, based on the input from Prometheus metrics.
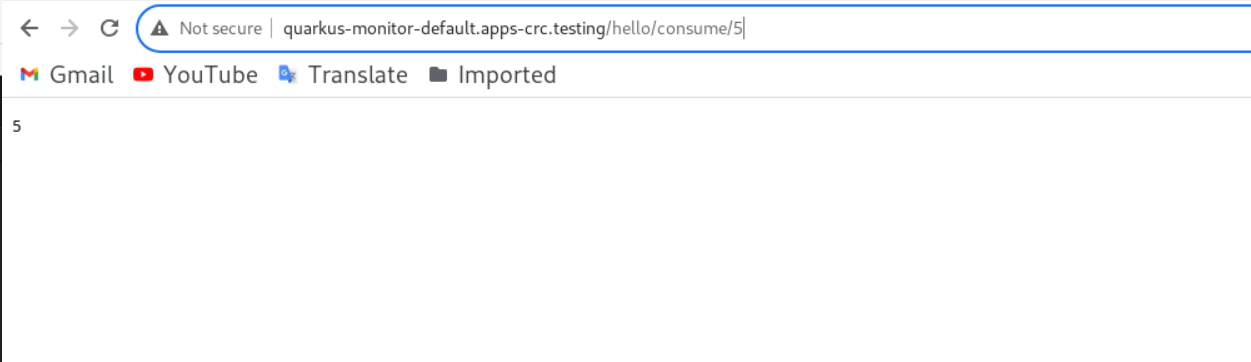
As demonstrated in Figure 3, initiate an API request from your browser with a value of 5 using the following URL:
https://quarkus-monitor-default.apps-crc.testing/hello/consume/5
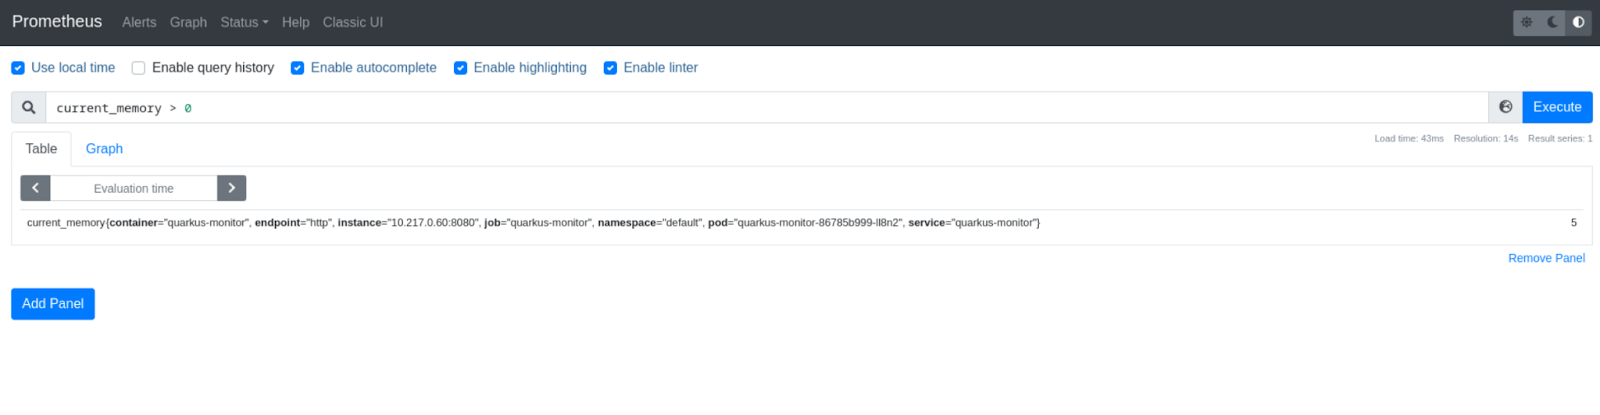
To confirm the functionality of the Quarkus application from the Prometheus dashboard, enter a query in the search box (see Figure 4):
Current_memory > 0
On the same Quarkus application, make an API request with a value of 25. This will add to the previous value, resulting in a total of 30. As this exceeds the memory limit of 20, we anticipate receiving an alert in the Alertmanager. Refer to Figure 5 for guidance on injecting the value into the application.
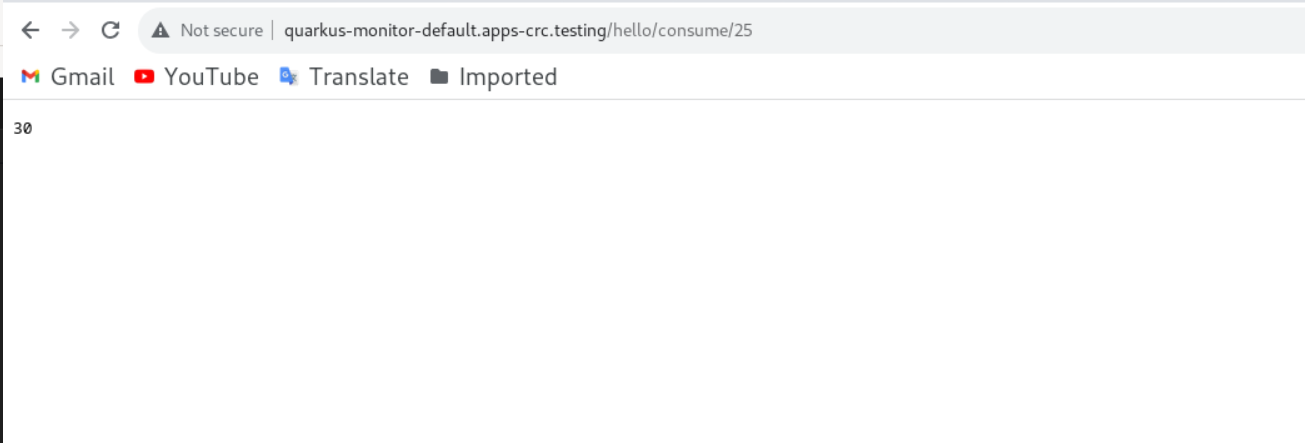
Inspect the Prometheus dashboard to confirm that the injected value is accurately reflected.
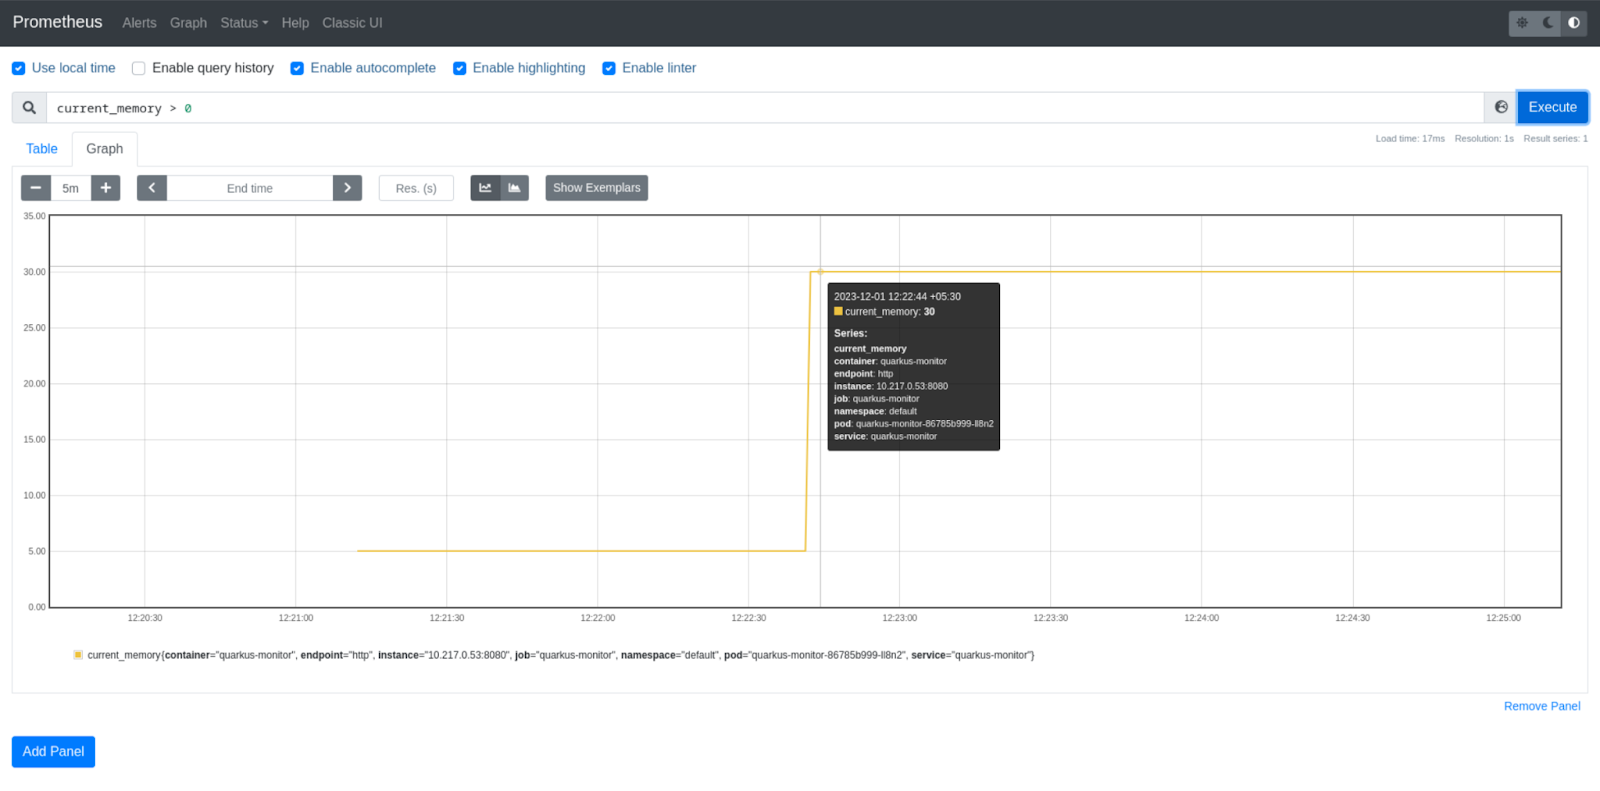
Consult the graph in Prometheus to validate the injected data, as shown in Figure 6.
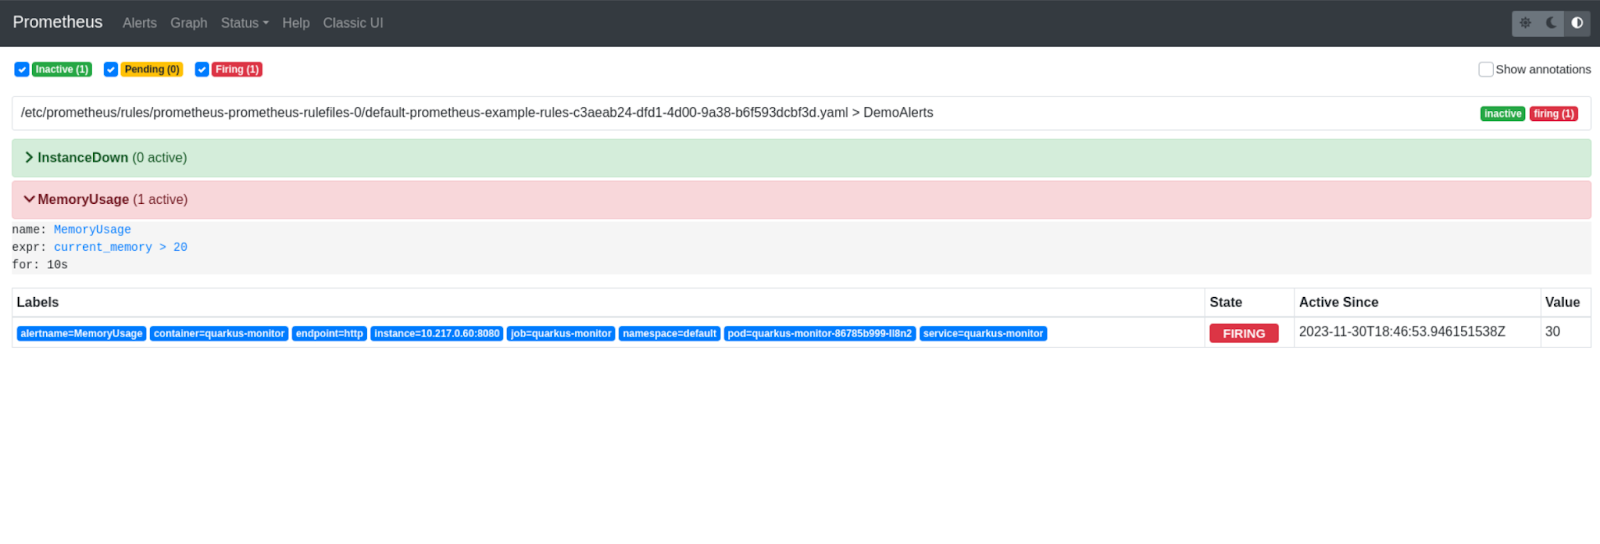
After surpassing the defined memory limit in Alertmanager, it's time to verify if the alert has been successfully triggered. Navigate to the Prometheus dashboard and inspect the alerts, as illustrated in Figure 7.
Ideally, after the alert, the Ansible EDA is expected to trigger. To confirm this, we should examine the logs of the running ansible-eda pod, as demonstrated below.
$ oc logs ansible-eda-b6b975d99-q8vmw

2023-11-30 18:47:54,296 - ansible_rulebook.rule_set_runner - INFO - action args: {'name': 'eda-playbook-alertmanager.yml'}
2023-11-30 18:47:54,297 - ansible_rulebook.builtin - INFO - running Ansible playbook: eda-playbook-alertmanager.yml
2023-11-30 18:47:54,317 - ansible_rulebook.builtin - INFO - ruleset: Listen for events from Alertmanager, rule: Debug Hello event
2023-11-30 18:47:54,318 - ansible_rulebook.builtin - INFO - Calling Ansible runner

PLAY [Playbook reacting to Alertmanager Event] *********************************

TASK [Scale app] ***************************************************************
changed: [localhost]

PLAY RECAP *********************************************************************
localhost                  : ok=1    changed=1    unreachable=0    failed=0    skipped=0    rescued=0    ignored=0
2023-11-30 18:48:13,101 - ansible_rulebook.builtin - INFO - Ansible Runner Queue task cancelled
2023-11-30 18:48:13,110 - ansible_rulebook.builtin - INFO - Playbook rc: 0, status: successful
2023-11-30 18:48:13,116 - ansible_rulebook.rule_set_runner - INFO - Task action::run_playbook::Listen for events from Alertmanager::Debug Hello event finished, active actions 0
Upon closer inspection of the logs, you will find a sample playbook triggered, named eda-playbook-alertmanager.yml. This exemplifies the functionality of an Event-Driven Ansible system.
Summary
In this article, we explored the integration of Event-Driven Ansible and Alertmanager with Prometheus, offering a proactive, event-driven approach. This enhances application visibility and reduces downtime in the OpenShift and Kubernetes environments.
Explore the Event-Driven-Ansible lab for practical implementation. Download Ansible Automation Platform at no cost and begin your automation journey.