In the automotive industry, safety and compliance requirements demand a level of predictability in compute workloads. In support of this, our Red Hat Performance and Scale team is constantly working with customers and partners to ensure they can rely upon robust real-time capabilities in embedded systems.
In a recent study, we found ourselves exploring unexpected periodic latency spikes reported by a partner. This was a puzzling symptom, since every second a low-priority, real-time process briefly affected a high-priority, real-time process on the same CPU. This is explicitly counter to the design of the scheduler's process prioritization. Our team dove in for analysis. With excellent collaboration among various experts, we not only quickly dissected the root cause, but also provided the partner with insight into real-time application design considerations and found a design flaw with a test.
This article discusses CPU throttling and risks as well as Red Hat Enterprise Linux for Real Time.
Real-time process scheduling
Let's begin with a primer on real-time process scheduling so that we are on the same page. For the scope of this study, we are concerned about only two of the available scheduler policies: SCHED_FIFO and SCHED_OTHER (a.k.a., SCHED_NORMAL serviced by the completely fair, or CF, scheduler). SCHED_OTHER acts as the default policy and uses dynamic prioritization that allows the scheduler to share the CPU among processes.
The user exerts some control over which processes get a higher or lower share of the CPU using nice values ranging from -20 to 19, the lowest nice value in this case offering the highest priority and therefore highest portion of access to the CPU (the default nice value is 0). SCHED_FIFO, on the other hand, uses a fixed priority value between 1 and 99, with (confusingly versus SCHED_OTHER's nice values) the highest value being the highest priority.
It's important to understand that a SCHED_FIFO process of any priority will always be considered higher priority than a SCHED_OTHER process and will therefore take precedence, and a SCHED_FIFO process will not share the CPU while it is active. It can only yield the CPU explicitly (via a sleep action or I/O activity) or be preempted by a higher-priority real-time process.
The image in Figure 1 illustrates the relative process priorities within and between SCHED_NORMAL and SCHED_FIFO.

SCHED_NORMAL and SCHED_FIFO.Read more about scheduler policies in the Red Hat Enterprise Linux for Real Time documentation.
Diagnosing the latency problem
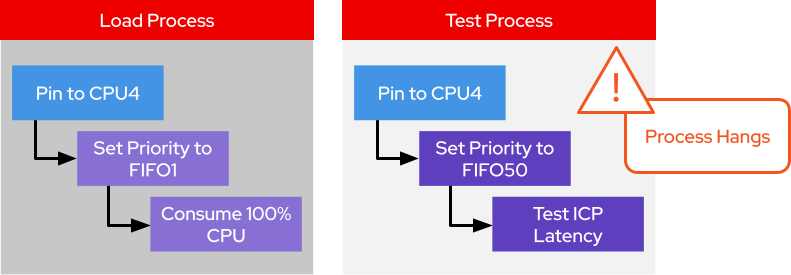
The design of our partner's test scenario is to intentionally cause an extreme case of competition between SCHED_FIFO processes on a target CPU. First, a load process is run, which is a simple C application designed to pin the process to a given CPU, set its FIFO priority, and then run an empty while() loop. (We'll use FIFO1 in the examples here.) This is an effective tactic for consuming 100% of a single CPU.
Next, a test workload starts at a higher FIFO priority (we'll use FIFO50) that performs a loop of basic IPC (inter-process communication) operations pinned to the same CPU and reports the latency per test iteration. The expectation is that the higher-priority test process will preempt the lower-priority load process, and therefore the latencies reported for all test iterations will remain consistent and low. However, the observation leading to the reported concern is that every second a spike of about 50ms of latency is reported.
The image in Figure 2 shows the steps taken by the load and test processes, and illustrates the latency observed in the test process.

Tracing with ftrace (via trace-cmd) allowed us insight into the CPU activity during that one-second cadence of latency spikes. On cue, we consistently see a sched_switch from our infinite_loop_f load process to ksoftirqd, followed by 50ms of <idle>-0 activity, and then a sched_switch back to infinite_loop_f.
Given that the scheduler is expected to run the highest priority task for the CPU, it's particularly interesting to see <idle>-0 here since it represents the lowest priority task on the system, the idle state that spins when nothing else is scheduled. This interruption to our higher-priority tasks can be caused only directly by the kernel itself and not by our load or test processes.
The following is the input:
# trace-cmd record -e 'rcu_dyntick' -f 'CPU == 4' \
                 -e 'irq_handler*' -f 'CPU == 4' \
                 -e 'softirq*' -f 'CPU == 4' \
                 -e 'hrtimer*' -f 'CPU == 4' \
                 -e 'sched_switch' -f 'CPU == 4' \
                 -e 'sched_wakeup' -f 'CPU == 4' \
                 -e 'sched_migrate_task' -f 'CPU == 4' \
                 -e 'sched_wake_idle_without_ipi' -f 'cpu == 4'
# trace-cmd report >& trace-cmd.out
This is an annotated excerpt of the output:
 ...
 infinite_loop_f-2053  [004] 44501.327174: softirq_raise:        vec=7 [action=SCHED]
 infinite_loop_f-2053  [004] 44501.327176: hrtimer_expire_exit:  hrtimer=0xffff4a20be78e240
 infinite_loop_f-2053  [004] 44501.327176: irq_handler_exit:     irq=10 ret=handled
 infinite_loop_f-2053  [004] 44501.327177: hrtimer_start:        hrtimer=0xffff4a20be78e240 function=tick_nohz_highres_handler/0x0 expires=255607970000000 softexpires=255607970000000
>>> Here we see CPU4 context switch from our load app running at FIFO1 to ksoftirqd and then to idle.
>infinite_loop_f-2053  [004] 44501.327179: sched_switch:         infinite_loop_f:2053 [98] R ==> ksoftirqd/4:62 [120]
>    ksoftirqd/4-62    [004] 44501.327181: softirq_entry:        vec=7 [action=SCHED]
>    ksoftirqd/4-62    [004] 44501.327183: softirq_exit:         vec=7 [action=SCHED]
>    ksoftirqd/4-62    [004] 44501.327184: sched_switch:         ksoftirqd/4:62 [120] S ==> swapper/4:0 [120]
>         <idle>-0     [004] 44501.327185: rcu_dyntick:          Start 1 0 0xacc
          <idle>-0     [004] 44501.337206: rcu_dyntick:          End 0 1 0xad4
          <idle>-0     [004] 44501.337209: rcu_dyntick:          ++= 4000000000000000 4000000000000002 0xad4
          <idle>-0     [004] 44501.337217: irq_handler_entry:    irq=10 name=arch_timer
          <idle>-0     [004] 44501.337219: hrtimer_cancel:       hrtimer=0xffff4a20be78e240
          <idle>-0     [004] 44501.337219: hrtimer_expire_entry: hrtimer=0xffff4a20be78e240 now=255607970046180 function=tick_nohz_highres_handler/0x0
          <idle>-0     [004] 44501.337225: hrtimer_expire_exit:  hrtimer=0xffff4a20be78e240
          <idle>-0     [004] 44501.337226: irq_handler_exit:     irq=10 ret=handled
          <idle>-0     [004] 44501.337230: rcu_dyntick:          --= 4000000000000002 4000000000000000 0xad4
          <idle>-0     [004] 44501.337232: hrtimer_start:        hrtimer=0xffff4a20be78e240 function=tick_nohz_highres_handler/0x0 expires=255607980000000 softexpires=255607980000000
          <idle>-0     [004] 44501.337233: rcu_dyntick:          Start 1 0 0xad4
          <idle>-0     [004] 44501.347181: rcu_dyntick:          End 0 1 0xadc
          <idle>-0     [004] 44501.347182: rcu_dyntick:          ++= 4000000000000000 4000000000000002 0xadc
          <idle>-0     [004] 44501.347182: irq_handler_entry:    irq=10 name=arch_timer
          <idle>-0     [004] 44501.347183: hrtimer_cancel:       hrtimer=0xffff4a20be78e240
          <idle>-0     [004] 44501.347183: hrtimer_expire_entry: hrtimer=0xffff4a20be78e240 now=255607980011121 function=tick_nohz_highres_handler/0x0
          <idle>-0     [004] 44501.347183: hrtimer_expire_exit:  hrtimer=0xffff4a20be78e240
          <idle>-0     [004] 44501.347184: irq_handler_exit:     irq=10 ret=handled
          <idle>-0     [004] 44501.347185: rcu_dyntick:          --= 4000000000000002 4000000000000000 0xadc
          <idle>-0     [004] 44501.347185: hrtimer_start:        hrtimer=0xffff4a20be78e240 function=tick_nohz_highres_handler/0x0 expires=255607990000000 softexpires=255607990000000
          <idle>-0     [004] 44501.347185: rcu_dyntick:          Start 1 0 0xadc
          <idle>-0     [004] 44501.357186: rcu_dyntick:          End 0 1 0xae4
          <idle>-0     [004] 44501.357186: rcu_dyntick:          ++= 4000000000000000 4000000000000002 0xae4
          <idle>-0     [004] 44501.357187: irq_handler_entry:    irq=10 name=arch_timer
          <idle>-0     [004] 44501.357188: hrtimer_cancel:       hrtimer=0xffff4a20be78e240
          <idle>-0     [004] 44501.357188: hrtimer_expire_entry: hrtimer=0xffff4a20be78e240 now=255607990016396 function=tick_nohz_highres_handler/0x0
          <idle>-0     [004] 44501.357189: hrtimer_expire_exit:  hrtimer=0xffff4a20be78e240
          <idle>-0     [004] 44501.357189: irq_handler_exit:     irq=10 ret=handled
          <idle>-0     [004] 44501.357191: rcu_dyntick:          --= 4000000000000002 4000000000000000 0xae4
          <idle>-0     [004] 44501.357191: hrtimer_start:        hrtimer=0xffff4a20be78e240 function=tick_nohz_highres_handler/0x0 expires=255608000000000 softexpires=255608000000000
          <idle>-0     [004] 44501.357191: rcu_dyntick:          Start 1 0 0xae4
          <idle>-0     [004] 44501.367183: rcu_dyntick:          End 0 1 0xaec
          <idle>-0     [004] 44501.367183: rcu_dyntick:          ++= 4000000000000000 4000000000000002 0xaec
          <idle>-0     [004] 44501.367184: irq_handler_entry:    irq=10 name=arch_timer
          <idle>-0     [004] 44501.367184: hrtimer_cancel:       hrtimer=0xffff4a20be78e240
          <idle>-0     [004] 44501.367185: hrtimer_expire_entry: hrtimer=0xffff4a20be78e240 now=255608000013046 function=tick_nohz_highres_handler/0x0
          <idle>-0     [004] 44501.367185: hrtimer_expire_exit:  hrtimer=0xffff4a20be78e240
          <idle>-0     [004] 44501.367185: irq_handler_exit:     irq=10 ret=handled
          <idle>-0     [004] 44501.367187: rcu_dyntick:          --= 4000000000000002 4000000000000000 0xaec
          <idle>-0     [004] 44501.367188: hrtimer_start:        hrtimer=0xffff4a20be78e240 function=tick_nohz_highres_handler/0x0 expires=255608010000000 softexpires=255608010000000
          <idle>-0     [004] 44501.367188: rcu_dyntick:          Start 1 0 0xaec
          <idle>-0     [004] 44501.377191: rcu_dyntick:          End 0 1 0xaf4
          <idle>-0     [004] 44501.377192: rcu_dyntick:          ++= 4000000000000000 4000000000000002 0xaf4
          <idle>-0     [004] 44501.377194: irq_handler_entry:    irq=10 name=arch_timer
          <idle>-0     [004] 44501.377195: hrtimer_cancel:       hrtimer=0xffff4a20be78e240
          <idle>-0     [004] 44501.377195: hrtimer_expire_entry: hrtimer=0xffff4a20be78e240 now=255608010023029 function=tick_nohz_highres_handler/0x0
          <idle>-0     [004] 44501.377197: hrtimer_expire_exit:  hrtimer=0xffff4a20be78e240
          <idle>-0     [004] 44501.377197: irq_handler_exit:     irq=10 ret=handled
          <idle>-0     [004] 44501.377199: rcu_dyntick:          --= 4000000000000002 4000000000000000 0xaf4
          <idle>-0     [004] 44501.377199: hrtimer_start:        hrtimer=0xffff4a20be78e240 function=tick_nohz_highres_handler/0x0 expires=255608020000000 softexpires=255608020000000
          <idle>-0     [004] 44501.377200: rcu_dyntick:          Start 1 0 0xaf4
          <idle>-0     [004] 44501.377216: rcu_dyntick:          End 0 1 0xafc
          <idle>-0     [004] 44501.377217: rcu_dyntick:          ++= 4000000000000000 4000000000000002 0xafc
          <idle>-0     [004] 44501.377218: irq_handler_entry:    irq=1 name=IPI
          <idle>-0     [004] 44501.377218: irq_handler_exit:     irq=1 ret=handled
          <idle>-0     [004] 44501.377219: rcu_dyntick:          --= 4000000000000002 4000000000000000 0xafc
>>> 50ms after CPU4 switched away from the load process, it switches back to it.
>         <idle>-0     [004] 44501.377222: sched_switch:         swapper/4:0 [120] R ==> infinite_loop_f:2053 [98]
>infinite_loop_f-2053  [004] 44501.377226: rcu_dyntick:          Start 1 0 0xafc
>infinite_loop_f-2053  [004] 44501.387174: rcu_dyntick:          End 0 1 0xb04
>infinite_loop_f-2053  [004] 44501.387176: irq_handler_entry:    irq=10 name=arch_timer
 ...
It quickly became apparent that we were experiencing a feature, not a bug. The kernel scheduler for real-time FIFO processes includes a throttling mechanism, which is specifically intended to ensure that a FIFO process cannot monopolize a CPU.
By default in Red Hat Enterprise Linux, this limits FIFO processes to 95% of a CPU with an accounting period of one second. This is exactly the one-second cadence of latency that we were observing and aligns with the <idle>-0 time reported in the ftrace output. The limit and period are defined in microseconds by the sched_rt_runtime_us and sched_rt_period_us parameters, respectively:
# cat /proc/sys/kernel/sched_rt_runtime_us
950000
# cat /proc/sys/kernel/sched_rt_period_us
1000000
Now we know that the scheduler interrupted our load and test FIFO processes once every second because our load process is attempting to use 100% of the CPU. We can calculate that the 5% of processing time reserved for non-FIFO processes on the CPU over one second equates to 50 ms (1000ms * 0.05), also aligning perfectly with our observations of latency spikes.
Our first takeaway is that you should probably not design your real-time applications this way. While the simple load process is a clever way to induce 100% load on a CPU, in real-world circumstances you are unlikely to design an application that runs this way without ever yielding the CPU either via a sleep or an I/O operation. If you have a process that needs uninhibited access to a CPU, you should also avoid scheduling other real-time processes on the same CPU.
Is that a bug?
Let's dig in a little more. What if you do have a use case that matches the test condition, and you consider the periodic latency spikes unacceptable? Can you simply turn off the throttling and allow the FIFO processes to run without interruption? Of course you can! This is a kernel runtime tunable, simply manipulated by setting the sched_rt_runtime_us value to -1:
# echo -1 > /proc/sys/kernel/sched_rt_runtime_usWith this change to disable throttling, there is no longer any CPU time reserved for non-FIFO processes, and the test process should experience no periodic latency spikes. This might normally be the end of the story, and we could close by discussing the risks of disabling throttling and possible alternative methods. But in our case, dear reader, the plot thickens.
With throttling disabled, our new observed behavior is that the test process hangs without ever running an iteration when started after the load process is already running. Now we have an even worse problem.
We fully expect our FIFO50 test process to preempt the FIFO1 load process, but instead it won't run at all. Further deepening the rabbit hole, if we start the test process before the load process, everything works fine and no latency spikes are reported. What could possibly be the difference?
The image in Figure 3 illustrates that the test process now hangs indefinitely after disabling throttling.
In Figure 4 we show that the test process succeeds with throttling disabled when it is started before the load process.
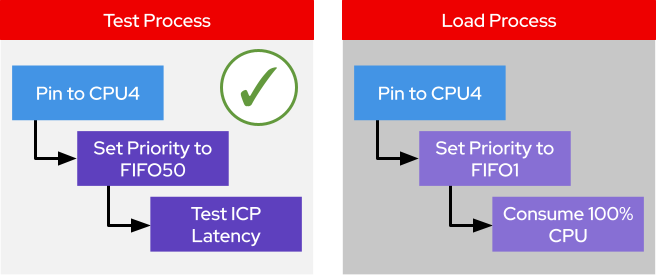
For the latter situation, where things work as expected, there is a key thing about the test process that we haven't yet shared. While the load process attempts to use 100% of the CPU with an empty while() loop, the test process on the other hand includes a 10ms sleep with each test iteration. Logically, this means that the test process frequently yields the CPU and allows the lower-priority load process to be scheduled. Thus, we continue to observe high load on the CPU during the running of the test process, which uses very little CPU itself, while the test process always takes priority, and therefore reports no latency spikes.
But when starting the load before the test, why isn't the FIFO50 test process preempting the FIFO1 load process? It turns out that this is due to a subtlety in the designs of the load and test applications (a bug). In both cases, the applications are designed to first set the CPU affinity and then set the FIFO priority. This works fine for the load application started first since it schedules on the target CPU as CF NICE0 (a non-real-time priority and therefore lower than FIFO1), and its priority is then adjusted to FIFO1. There is nothing to impede this from happening.
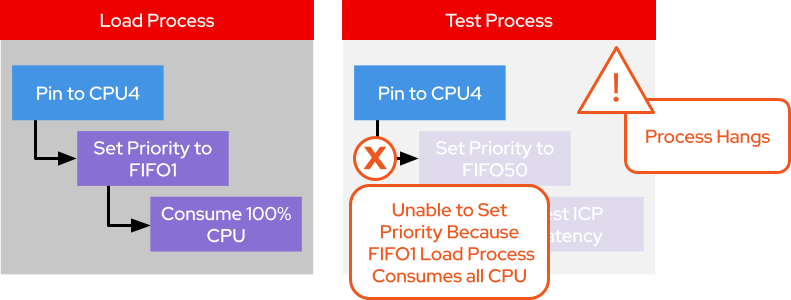
However, when the test process starts, it is first pinned to the same CPU as the load process while still prioritized as CF NICE0. Since that CPU is fully consumed by the load process, and there is no throttling to relieve it, the action to re-prioritize the test process to FIFO50 cannot be taken. Thus, the test process simply hangs indefinitely.
The image in Figure 5 shows more specifically that the test process hangs when CPU throttling is disabled because it cannot change its priority.
As you might imagine, the fix for this problem is quite simple. We adjust the code such that the FIFO scheduling priority is set for the processes before it is pinned to the CPU. Testing confirms this fix, and now with throttling disabled, we are able to run the FIFO1 load process first. Then run the FIFO50 test process, which properly preempts the load process. Hence, we no longer observe the one-second periodic latency spikes.
So, problem solved. But wait—let's get back to those previously mentioned risks and alternatives.
The following is the broken code:
...
>>> Pinning the CPU first causes the problem.
>  pin_cpu(4);
>  set_fifo_priority(50);
  while(...) {
      ...
      usleep(10000);
  }
...
This is the fixed code:
...
>>> Reversing the order of operations to set the priority first is the fix.
> set_fifo_priority(50);
> pin_cpu(4);
  while(...) {
      ...
      usleep(10000);
  }
...
The image in Figure 6 illustrates that the test process now runs as expected when throttling is disabled because we set the process priority before we pin to the CPU.

Risks and alternatives
Disabling throttling is a global change, leaving open the possibility of real-time processes monopolizing system CPU resources in a way that can be dangerous. Throttling is a safeguard that ensures critical kernel threads and activities can always be serviced in a timely manner. Linux efficiently manages these activities itself across the available CPU resources.
If you disable throttling, you ultimately take full responsibility for dividing up the CPU resources and must leave adequate available resources for necessary system operations or risk hangs, crashes, and corruption. This level of control may be the desirable route for you, but you must accept the risks and responsibilities.
An alternative to throttling on Red Hat Enterprise Linux is stalld, a daemon that is intended to run on a housekeeping CPU, which is one reserved not to run real-time applications. The stalld actively monitors the threads on the system for those that sit on the run queue for too long (a tunable parameter) and considered stalled. It then temporarily boosts that stalled thread to a SCHED_DEADLINE policy, which can preempt all other policies and priorities including FIFO99.
The advantages of stalld over disabling throttling:
It will only interrupt a real-time process when a stall is detected, rather than periodically.
It may interrupt for a shorter period of time.
Overall, it is a more tunable solution.
Users of TuneD may be familiar with its realtime profile. It's important to note that this profile includes the disabling of throttling as previously described. So the stalld information here is also relevant to these users. TuneD is widely deployed to manage system parameters and monitor and optimize system performance for target workloads.
The TuneD realtime profile also includes isolating CPU cores (removing them from most extraneous tasks) either directly or via nohz options. TuneD and the realtime profile are generally recommended for anyone running real-time workloads with a high level of expertise.
Read more about the real-time profile for TuneD and scheduling problems and solutions in the Red Hat Enterprise Linux for Real Time documentation.
Takeaways
Red Hat's real-time enabled operating systems, including Red Hat In-Vehicle Operating System, offer powerful process scheduling control, minimize latency, and ensure consistent application performance. However, like most other Linux systems, it is generally configured out-of-the-box for greatest compatibility with the most use cases.
Tuning the system and your applications for performance can yield significant improvements. It also requires a high level of expertise and care to ensure not to introduce new problems, which could counter-intuitively add latency or risks of failure. As you make your design decisions for process separation, pinning, and prioritization, make sure to consider the nuances revealed here and always test your designs under extreme conditions to reveal the edge cases.
One of the great joys of meeting these challenges at Red Hat is the opportunity to collaborate openly with some of the most talented engineers on the planet. It always takes a group to get to these answers quickly for our customers and partners. I want to especially thank Valentin Schneider (Principal Software Engineer) and Joe Mario (Senior Principal Performance Engineer) for their contributions that helped bring this all together. I also want to thank our partner for being very open and clear when sharing their concerns and test methodologies.