The out-of-the-box monitoring stack in Red Hat OpenShift provides a comprehensive set of tools and services to monitor various aspects of your workloads, including metrics, logs, events, and traces. With this monitoring stack, you can gain valuable insights into the health and performance of your applications, identify and troubleshoot issues, and optimize resource utilization. This allows you to deliver a seamless user experience and confidently meet your business objectives.
In this article, we will explore the monitoring stack in Red Hat OpenShift and how to use it to monitor a sample application effectively using Prometheus and Grafana.
How to monitor a sample application
We will use an OpenShift cluster with version 4.10.36 in this example.
Step 1: Create a ConfigMap
Create a ConfigMap in the openshift-monitoring namespace.
In OpenShift, user workload refers to the applications and services that users deploy onto the cluster. Before we begin, we need to create a ConfigMap in the openshift-monitoring namespace to enable user workload monitoring.
apiVersion: v1
kind: ConfigMap
metadata:
  name: cluster-monitoring-config
  namespace: openshift-monitoring
data:
  config.yaml: |
    enableUserWorkload: true
Step 2: Check for Prometheus
Check openshift-user-workload-monitoring namespace for the new Prometheus server pod (Figure 1).
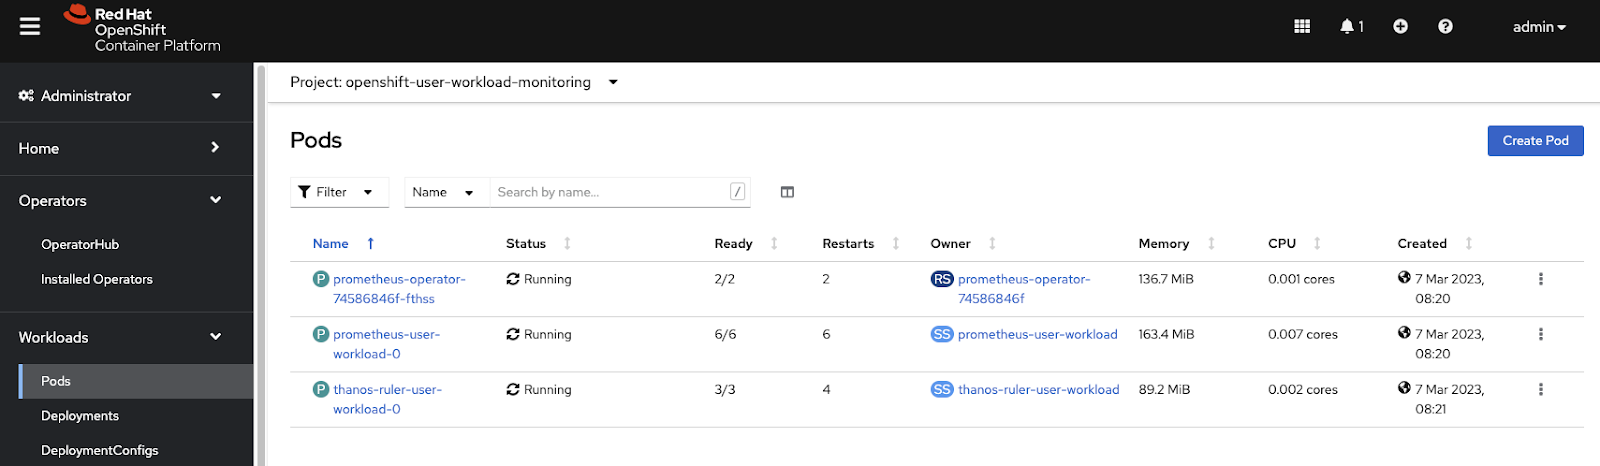
After creating the ConfigMap, check the openshift-user-workload-monitoring namespace for a new Prometheus server pod.
Step 3: Deploy Java application
Deploy the example Java application as a deployment with an OCP route.
A sample Java application has been developed that provides an API for coin-tossing. This API exposes the number of times the heads side of the coin showed, represented as a coin_heads_total metric of counter type in Prometheus. The MicroMeter Quarkus extension has been utilized to expose this metric. The metrics can be accessed via the http://localhost:8080/q/metrics endpoint if the application starts locally. The application has been containerized and is available to use under quay.io/jnirosha/coin-toss-api.
Next, deploy the coin-toss-api as a deployment with an OpenShift route. Use the following command to deploy the application:
oc new-app --name=coin-toss-api quay.io/jnirosha/coin-toss-api
oc expose svc/coin-toss-api
Step 4: Create a ServiceMonitor instance
Create a ServiceMonitor instance to register the Prometheus target.
To monitor the coin-toss-api application, we must create a ServiceMonitor instance to register the Prometheus target. Run the following command to create the ServiceMonitor:
apiVersion: monitoring.coreos.com/v1
kind: ServiceMonitor
metadata:
  name: my-service-monitor
  namespace: my-project
spec:
  endpoints:
    - interval: 5s
      path: /q/metrics
      port: 8080-tcp
      scheme: http
  namespaceSelector:
    matchNames:
      - my-project
  selector:
    matchLabels:
      app: coin-toss-api
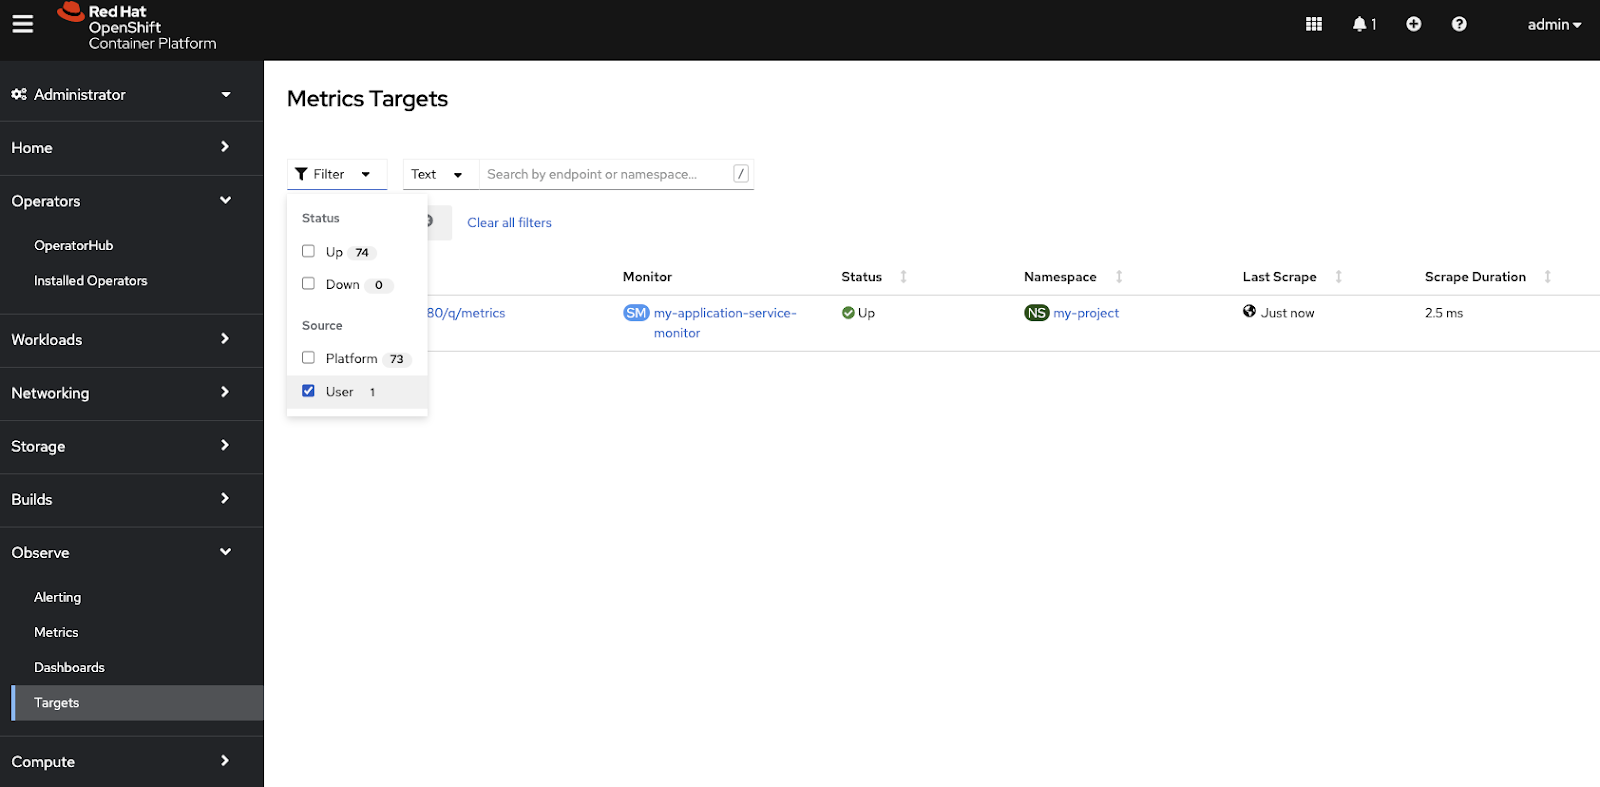
Step 5: Filter targets
After creating the ServiceMonitor, navigate to the Prometheus UI by clicking on the Observe tab in the OpenShift console. Under the Targets menu, filter the targets by the user (Figure 2).
Step 6: Observe metrics
Navigate to the Observe tab in the OpenShift console, then select Metrics options (Figure 3).
In the expressions input field, you can type coin_heads_total, which is our custom metric name.
Then click the Run queries button.
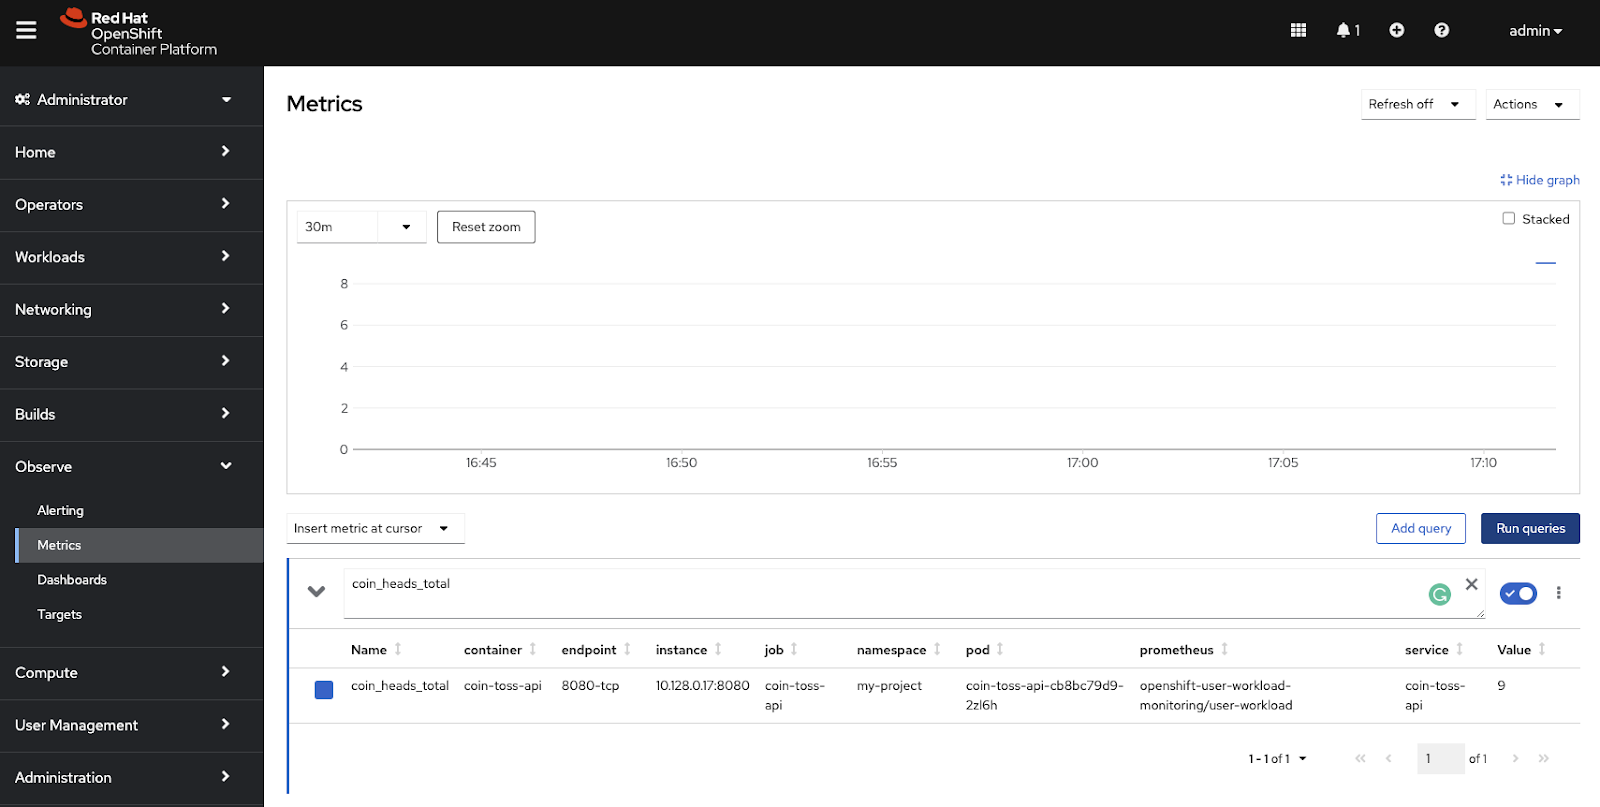
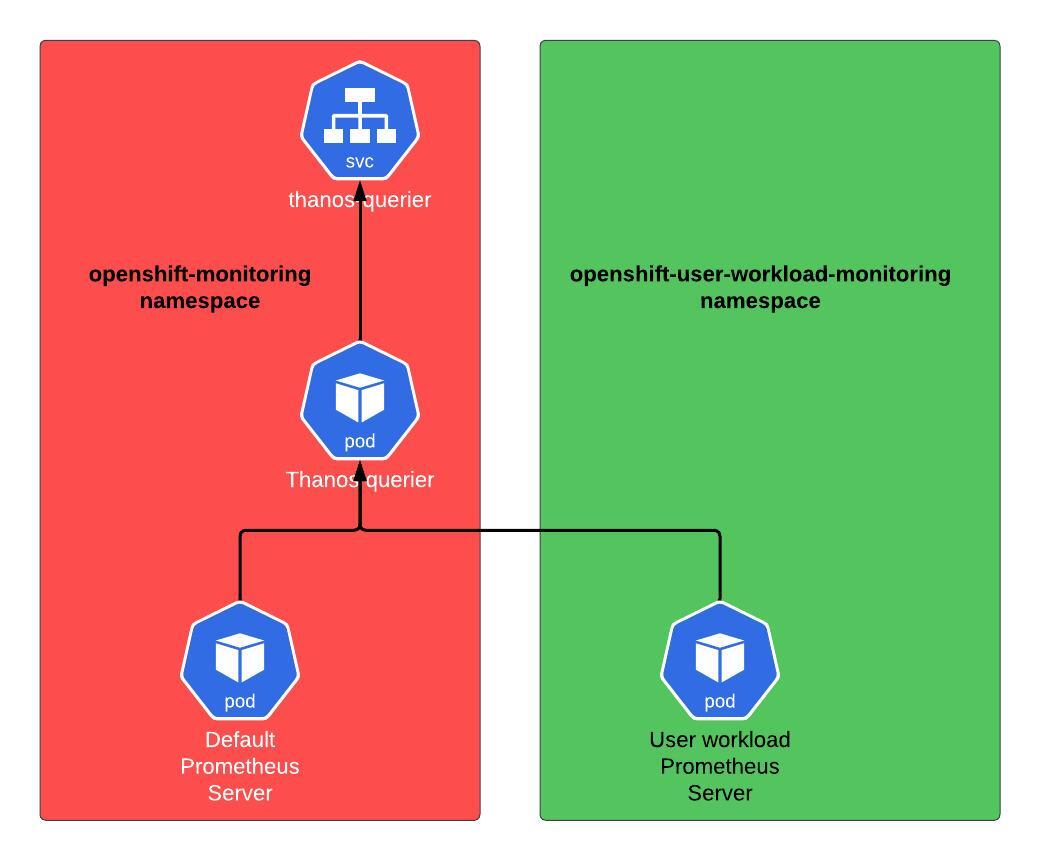
At this point, we have two different Prometheus server instances. One is for default OpenShift monitoring, and the other is for user workload monitoring. In OpenShift, to observe metrics, we can see metrics scraped through both the Prometheus server instances (Figure 4).
Step 7: Install the Grafana operator
Install the Grafana operator in a different namespace. To install the Grafana operator, we recommend creating a new namespace. Run the following command to create the namespace as follows:
oc create namespace my-grafana
Then, install the Grafana operator using OperatorHub.
Step 8: Create a Grafana instance
Create a Grafana instance from the operator.
After installing the Grafana operator (v4.9.0), create a Grafana instance by running the following command:
apiVersion: integreatly.org/v1alpha1
kind: Grafana
metadata:
  name: my-grafana
  namespace: my-grafana
spec:
  config:
    security:
      admin_user: admin
      admin_password: my-password
  dataStorage:
    accessModes:
      - ReadWriteOnce
    class: gp2
    size: 1Gi
  ingress:
    enabled: true
    tls:
      enabled: true
Configure Grafana to use an ingress with TLS enabled and setting an admin username and password. Make sure to replace "my-password" with a strong password.
Note: Please ensure that you include the available storage class in your cluster within the dataStorage section.
Step 9: Create a cluster role
Create a cluster role binding to the grafana-serviceaccount.
To allow Grafana to access monitoring data in the OpenShift cluster, we need to create a cluster role binding to the grafana-serviceaccount.
Run the following command:
oc create clusterrolebinding grafana-view --clusterrole=cluster-monitoring-view --serviceaccount=my-grafana:grafana-serviceaccount
This command creates a cluster role binding named grafana-view that provides the cluster-monitoring-view role to the grafana-serviceaccount in all namespaces.
Step 10: Generate a token
Generate a token using the grafana-serviceaccount.
To authenticate with the OpenShift API, Grafana needs a token generated from the grafana-serviceaccount. Run the following command to generate a token:
export TOKEN=$(oc create token grafana-serviceaccount -n my-grafana)
Then view the token using:
echo $TOKEN
Step 11: Create a GrafanaDataSource instance
Create a GrafanaDataSource instance from the operator.
Finally, create a GrafanaDataSource instance from the operator to connect Grafana to Prometheus. Run the following command:
apiVersion: integreatly.org/v1alpha1
kind: GrafanaDataSource
metadata:
  name: prometheus
  namespace: my-grafana
spec:
  datasources:
    - basicAuthUser: internal
      access: proxy
      editable: true
      secureJsonData:
        httpHeaderValue1: >-
          Bearer <<paste-your-generated-token-here>>
      name: Prometheus
      url: 'https://thanos-querier.openshift-monitoring.svc.cluster.local:9091'
      jsonData:
        httpHeaderName1: Authorization
        timeInterval: 5s
        tlsSkipVerify: true
      basicAuth: false
      isDefault: true
      version: 1
      type: prometheus
  name: test_name
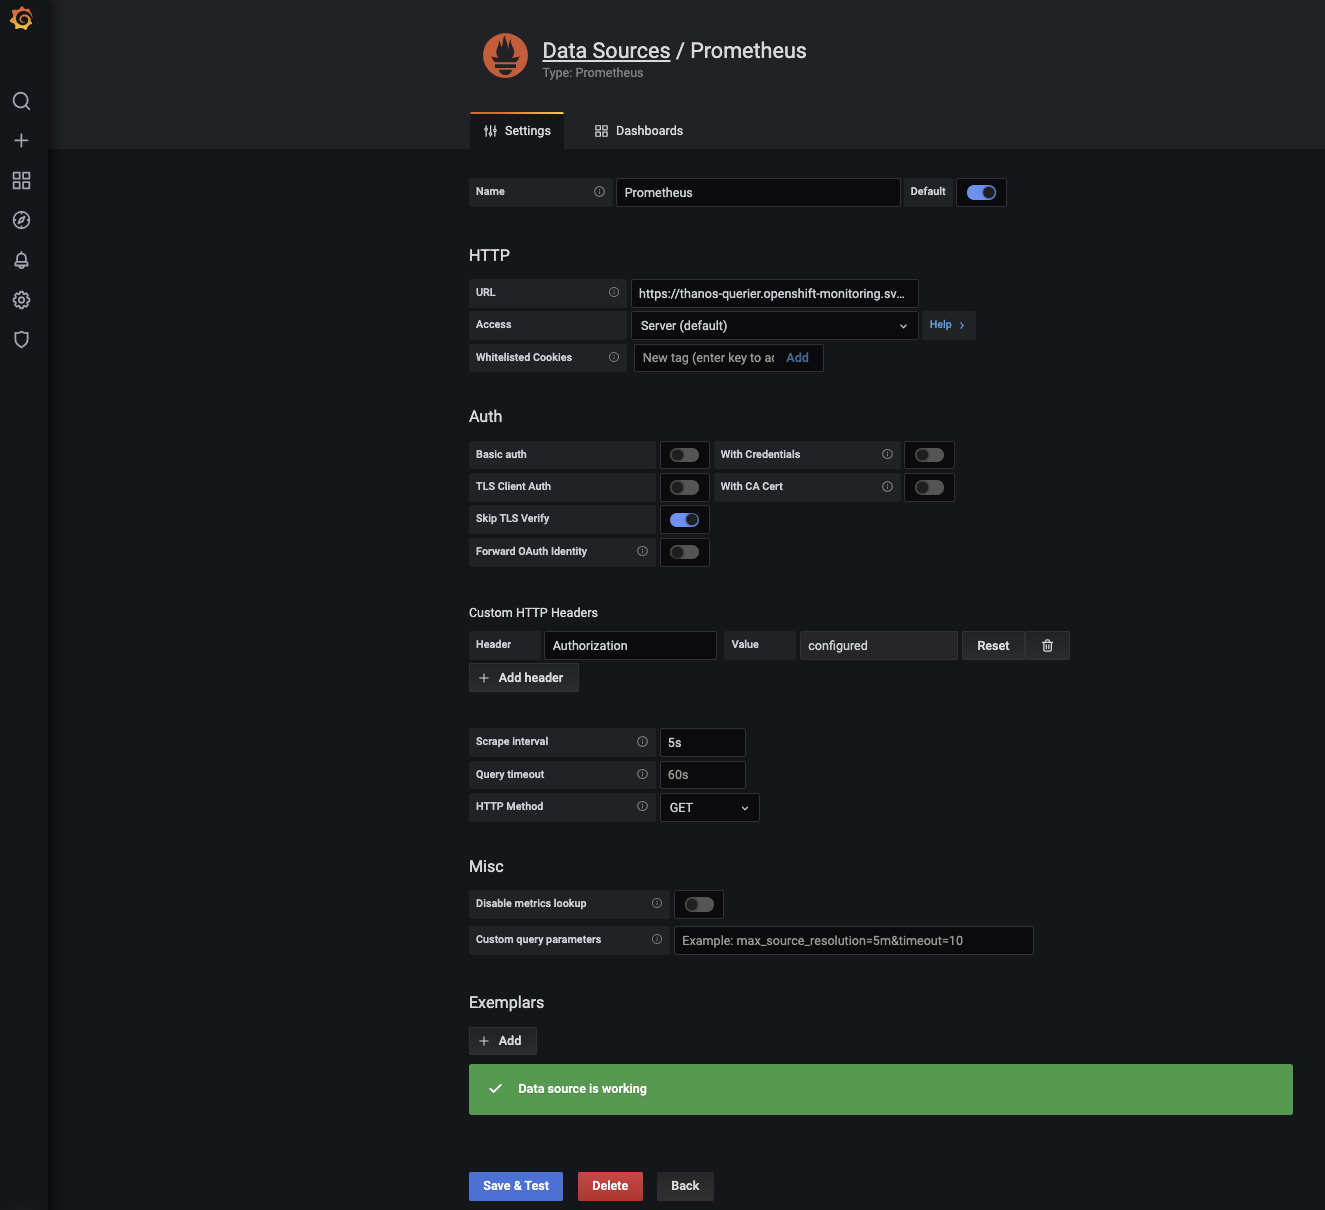
Log in to the Grafana dashboard and check data sources. You should see an entry like Figure 5. This is the data source we created using the custom resource in the operator.
Ensure that the Grafana can extract metrics from the Prometheus servers.
Once everything is working as expected, you can create your own Grafana dashboard. Figure 6 shows a simple graph I created inside the Grafana. It shows how many times the heads have appeared so far when tossing the coin in our Java application.

The OpenShift monitoring stack is easy to use
In conclusion, using a monitoring stack on the Red Hat OpenShift platform is easy and straightforward. One of the major advantages of this platform is that it comes out of the box with all the essential components necessary to enable effective monitoring of your applications and infrastructure. With just a few configuration settings, you can easily set up monitoring tools like Prometheus, Grafana, and alert manager to provide insights into the performance and health of your applications.
Overall, the OpenShift platform provides a powerful and easy-to-use monitoring stack that simplifies the process of monitoring complex applications and infrastructure. With the ability to customize and extend the platform's monitoring capabilities, you can easily create a monitoring solution that meets the specific needs of your organization.
Last updated: September 19, 2023