The Heisenberg Uncertainty Principle states that you cannot measure an object's position and velocity at the same time. If it's moving, it's not in a location. If it's in a location, then it has no velocity.
Thanks to some awesome open-source software, our microservices running in Red Hat OpenShift (using Kubernetes) can report both their performance and their health. Granted, they can't violate the Uncertainty Principle, but they can help bring certainty to your cloud-native applications. Istio brings tracing and monitoring to your system with very little effort, helping you keep things humming.
[This is part five of my ten-week Introduction to Istio Service Mesh series. My previous article was Part 4: Istio Circuit Breaker: When Failure Is an Option.]
Let's Come To Terms
First, let's agree on some basic terminology.
Tracing refers to the logging of system activity. That sounds pretty broad, but in fact, one of the basic rules of tracing is that data are dumped into a tracing data store without regard to formatting. The consumer of the data is responsible for finding and parsing the relevant data. For Istio, Jaeger is the tracing system used; it follows the OpenTracing Data Model.
Traces are the end-to-end data that make up a request, or unit of work. For example, from the moment a user clicks the button on the web page until the data are returned, and all the microservices in between. One trace represents (or models) that round trip. In the Jaeger UI, traces are displayed with a time axis. An analogy might be an entire chain, made up of individual links. Traces are made up of one or more spans.
Spans are the slices of time represented by the beginning to the end of a unit of work. Using our chain analogy, each span represents a link in the chain. Spans can have zero, one, or many child spans. At the root level, the initial span's elapsed time will equal the elapsed time of the trace that owns it.
Monitoring is the act of watching your system, by a UI and/or automation. Tracing data drives monitoring. Monitoring in Istio is provided by Prometheus and includes a UI. Prometheus supports automated monitoring via Alerts and Alert Managers.
Dropping Breadcrumbs
To implement tracing, the application needs to create a collection of "Spans". Those "Spans" will be exported to Jaeger, so it can create the visualization of the tracing. A "Span" marks, among other data, an operation name, a start timestamp, a finish timestamp. The propagation of the "Span" is done by forwarding Jaeger specific HTTP Request Headers from inbound requests to outbound requests. Depending on your development language and/or your approach, this may require a small modification to your source code. The following Java (using Spring Boot) code gives an example of adding B3 (Zipkin-style) headers to your request in the Spring configuration class:
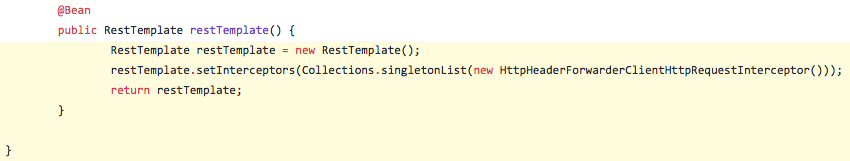
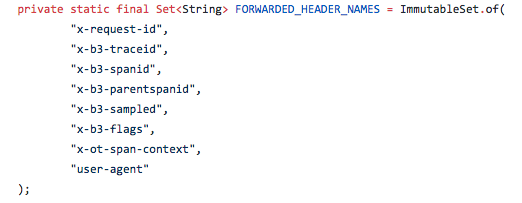
Here are the header settings used:
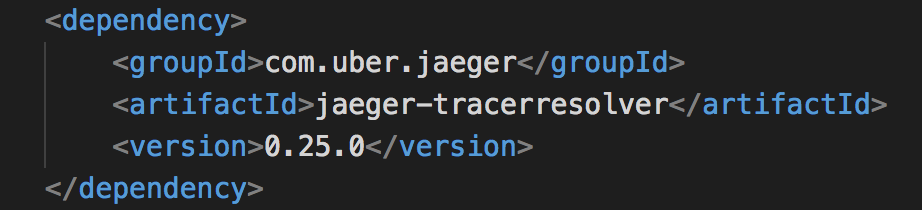
If you're using Java, there is a no-code approach that simply requires a few lines added to your Maven POM file and setting some environment variables. These lines added to your POM.XML file will inject the Jaeger Tracer Resolver:
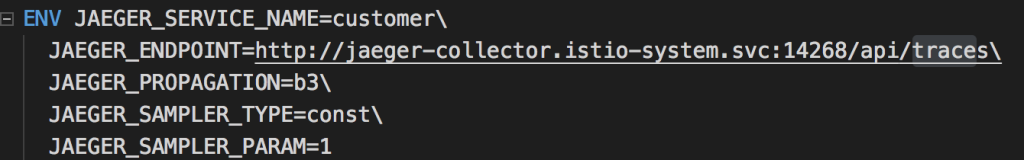
In the docker build configuration file (Dockerfile), the environment variables are set:
Now that everything is wired up, our microservices will start emitting tracing data.
Paradise By The Dashboard: Lite
A simple dashboard, built using Grafana, is included with your Istio installation. With everything up and running in our Red Hat OpenShift PaaS (for this blog post I'm using minishift to run Red Hat OpenShift and Kubernetes) we can open the dashboard by running this command:
open "$(minishift openshift service grafana -u)/d/1/istio-dashboard?refresh=5&ordId=1"
The Grafana Istio dashboard gives you quick insight into how your system is doing. Here's a screen capture of just a small part of the dashboard:
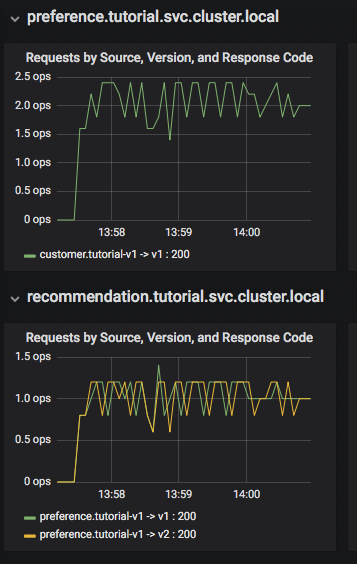
We can see that the "customer" microservice is calling to "preference" version 1, and preference is calling to both version 1 and version 2 of "recommendation". The information available on the Grafana dashboard includes a Dashboard Row with high-level metrics (e.g. Global Request Volume, success rates, 4xx errors), a Server Mesh view with charts for each service, and a Services row with details about each container for each service.
Dig A Little Deeper In The Well
With the proper tracing in place, Istio's out-of-the-box experience allows us to dive deeper into our system's performance. Using the Jaeger UI, we can view traces, see how far and deep they go, and get an idea of where performance might be lagging. Again, using minishift to run Red Hat OpenShift, I was able to use the following command to get to see the Jaeger UI:
minishift openshift service jaeger-query --in-browser
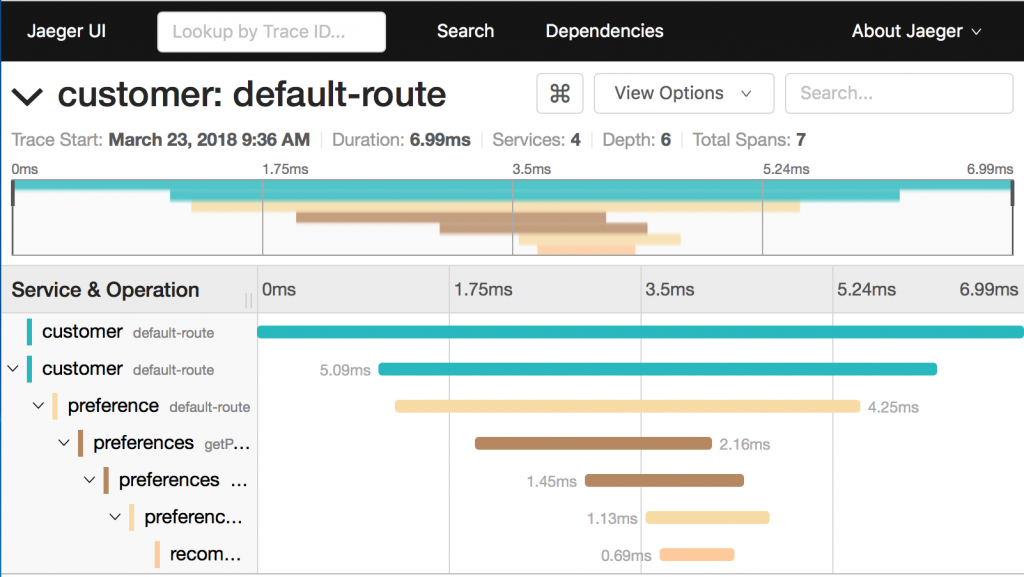
Examining this trace, we can see:
- Seven spans.
- A total elapsed time of 6.99ms.
- The last service in the chain, "recommendation", took .69ms.
This type of graph gives you a visible understanding how just one underperforming service in a chain can hobble your entire system.
Things get very interesting when you run multiple instances of a microservice. I ran the command oc scale --replicas=2 deployment/recommendation-v2 to get two "recommendation:v2" microservices running. Here are my pods after the command:
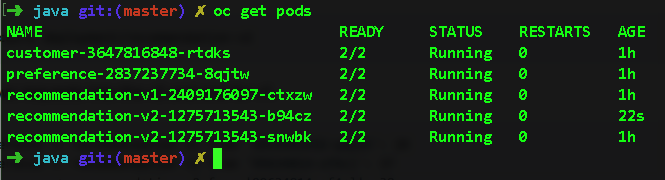
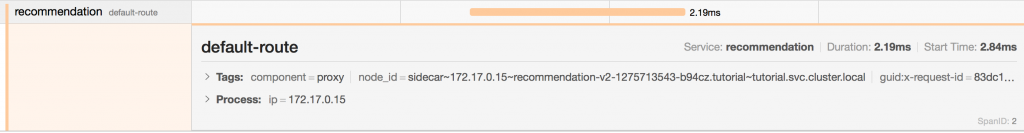
Back at the Jaeger UI, if I expand the "recommendation" span, I can see the exact pod that is being routed to. This is information you want to know in the event that a particular pod is underperforming. Notice the node_id in this panel:
Where's Everybody Going?
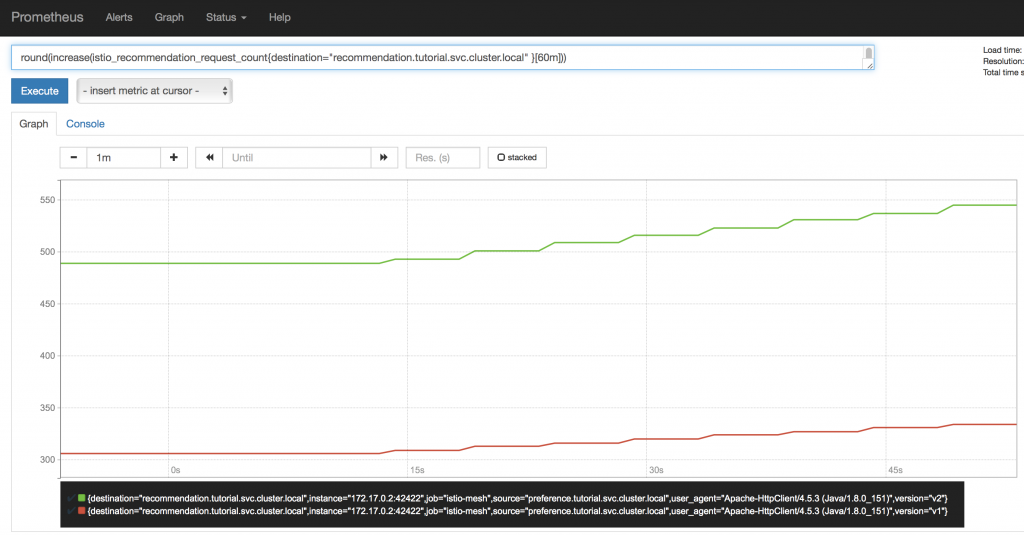
Finally, using the Prometheus UI, I can see what I expect: two out of three requests are being routed to v2 of the recommendation pods; they outnumber the v1 by 2:1 at this point, so this makes sense. As pods are scaled up and down, this graph will display the results. This graph will be particularly helpful when you're performing a Canary Deployment (that will be covered in this blog three weeks from now).
We're Just Getting Started
This is just (as they say) scratching the surface. Jaeger, Grafana, and Prometheus have depths of information that can fill books. This blog post is simply intended to get you headed in the right direction and to let you know what is possible using Istio.
Remember: all this comes built into Istio. Depending on your language (Java, for example) and framework (Spring Boot), you could implement all this with no changes to your source code. Other languages (I'm looking at you, Nodejs, and C#) may require some small code changes. But since tracing is a requirement of a robust cloud-native system, you're going to be making those changes whether you use Istio or not. Why not leverage your effort? For free.
Then you'll know just where you are, and how fast you're going.
With certainty.
All articles in the "Introduction to Istio" series:
- Part 1: Introduction to Istio; It Makes a Mesh of Things
- Part 2: Istio Route Rules: Telling Service Requests Where to Go
- Part 3: Istio Circuit Breaker: How to Handle (Pool) Ejection
- Part 4: Istio Circuit Breaker: When Failure Is an Option
- Part 5: Istio Tracing & Monitoring: Where Are You and How Fast Are You Going?
- Part 6: Istio Chaos Engineering: I Meant to Do That
- Part 7: Istio Dark Launch: Secret Services
- Part 8: Istio Smart Canary Launch: Easing into Production
- Part 9: Istio Egress: Exit Through the Gift Shop
- Part 10: Istio Service Mesh Blog Series Recap
