A Multi-cluster Alerting UI is now available as a developer preview on the Red Hat Advanced Cluster Management console. A unified UI is a game changing feature. It includes a centralized way to monitor and manage alerts across multiple clusters, enhancing the alert management and troubleshooting experience by providing:
- Better visibility: There is no need to switch between dashboards and CLI tools.
- Faster incident response: You can plan and take action more efficiently.
- Consistent alert management: Manage alerting rules and silences under one UI.
Everything you need to know
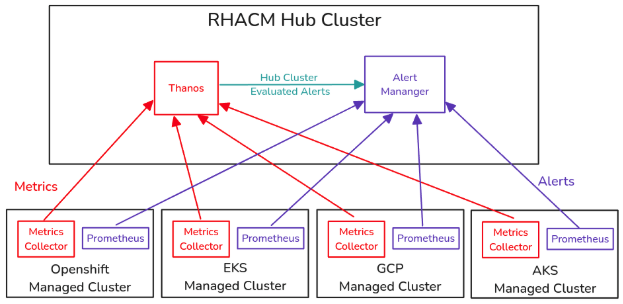
The developer preview of Multi-Cluster Alerting UI for Red Hat Advanced Cluster Management utilizes the ACM Observability components to view alerts from each managed cluster in a single location. ACM Observability alerts can come from one of two places:
- Forwarded alerts from the managed clusters to the Hub Clusters Alertmanager.
- Evaluated alerts from the Hub Clusters Thanos, which are based on forwarded metrics from the managed clusters.
Note that the current developer preview release focuses on displaying the second type of alerts. You can create custom rules in the ACM Observability configuration, as shown in Figure 1.
Installation
To test the developer preview of the brand new Alerting UI in the Red Hat Advanced Cluster Management console, install the cluster observability operator version 1.0.0, now generally available.
Once installed, create a UIPlugin custom resource which contains the URL of the Alertmanager and Thanos querier for your ACM Observability installation.
apiVersion: observability.openshift.io/v1alpha1
kind: UIPlugin
metadata:
  name: monitoring
spec:
  type: Monitoring
  monitoring:
  acm:
  enabled: true
    alertmanager:
      url: 'https://alertmanager.open-cluster-management-observability.svc:9095'
    thanosQuerier:
      url: 'https://rbac-query-proxy.open-cluster-management-observability.svc:8443'
Create custom rules based on forwarded metrics from the managed cluster. The following rule shows a warning for any memory overestimation over 10%.
apiVersion: v1
kind: ConfigMap
metadata:
  name: thanos-ruler-custom-rules
  namespace: open-cluster-management-observability
data:
  custom_rules.yaml: |
	groups:
  	- name: cluster-health
    	rules:
    	- alert: ClusterMemoryOverestimation
      	annotations:
        	summary: Notify when Memory Overestimation is high
        	description: "The cluster has a a greater than 10% overestimation of memory usage: {{ $value }} overestimation for {{ $labels.cluster }} {{ $labels.clusterID }}."
      	expr: |
        	topk(50, cluster:memory_requested:ratio - ignoring(usage) cluster:memory_utilized:ratio) * on(clusterID, cluster) group_left(memory_requested) count_values without() ("memory_requested", cluster:memory_requested:ratio) * on(clusterID, cluster) group_left(memory_utilized) count_values without() ("memory_utilized", cluster:memory_utilized:ratio) > 0.1
      	for: 5s
      	labels:
        	cluster: "{{ $labels.cluster }}"
        	severity: warning
UI features
Once the installation steps are complete:
- View alerts across clusters from a single page with easy filtering and sorting.
- Create and manage silences acting on all alerts, including the creation of cross-cluster silences.
- Benefit from an additional cluster column, which is available on the Alerts List and Silences List pages for alerts and silences with a cluster label.
Learn more from this interactive demo:
What's next?
We are currently working on a technology preview release of the Multi-Cluster Alerting UI that would allow users to view and interact with forwarded alerts. This feature will help bring a single pane of glass for all cluster alerts to an Red Hat OpenShift native UI.
We continue to work on enhancements that provide greater flexibility and usability for OpenShift users. We are looking forward to receiving your feedback. You can share your questions and recommendations with us using the Red Hat OpenShift feedback form.
Last updated: May 20, 2025