Network observability is the ability to easily identify and answer questions about your network in real-time, and use the information to make informed decisions to manage and optimize network resources. To facilitate and dig deeper with more insights into an ongoing network flow in real-time, we present Packet Capture Agent (PCA), an extension to the Network Observability eBPF Agent (netobserv-agent).
Historically, network observability data constituted of flow logs. A flow log record captures network flow, essentially layer 4 and 5 data. While this is useful and is extensively used for making network decisions, the question we ask is: can we do better? Is there still information hiding that we have not been able to collect/use for observability?
We argue that significant additional network information exists in network payload and that data is currently not extracted and used. For instance, in a DNS data packet the layer 4 and 5 data is the same as any other packet of the application. While looking into the packet payload, a great deal of observability information can be extracted. Example:
- Requested URLs
- Responses—i.e., success/failures
- DNS server contacted
To this end, we extended the Network Observability eBPF Agent with a Packet Capture Agent. NetObserv Operator is a Red Hat OpenShift / Kubernetes operator for network observability. It deploys a monitoring pipeline to collect and enrich network flows.
A real life scenario using packet capture capabilities
When an application is deployed, the higher level network observability focuses on the overall health of the network. Over due course of time, when a potential problem in the network is detected, it is now up to the users to take assessment and preventive actions. Assessment actions involve understanding the source of the problem.
As a first step, the netobserv flow operator can be used to identify the flows that are behaving erratically. At this point, though individual flows or a bunch of flows have been identified the real problem is still at large. But the flow information could be used to further zoom into the data plane. For example, if all the flows from a certain interface are in error, capturing packets from the interface would provide with information enough to detect the problem.
As another example, if all erring flows are through a certain port (say 53), then only visualizing packets via that port number would provide detailed information. Now since, we turn this feature on only as and when needed and the eventual packet capture is a subset of all the packets, the resource overhead is manageable.
To enable packet capture capabilities, an environment variable does the trick. Packet capture being resource intensive is turned off by default; you can turn it on with export ENABLE_PCA=true. This is followed by setting up the filters and the port that packet capture server listens to. The capture starts only when a client (receiver) connects to it. The filter is set using environment variable PCA_FILTER and port using PCA_SERVER_PORT.
Packet receivers
- Wireshark: Wireshark has the ability to connect to a sender over an interface. We set Wireshark options to connect to the netobserv server and once Wireshark connects, the capture begins (Figure 1). The capture filters need to be set in advance, and Wireshark receives the PCAP stream.
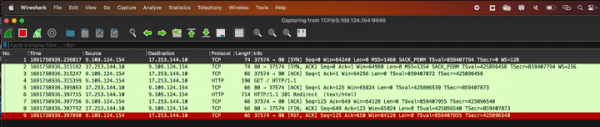
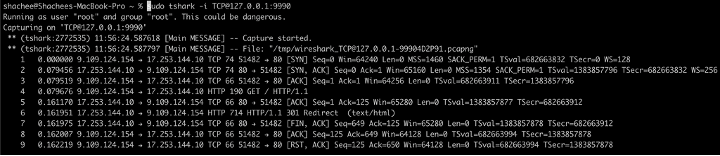
Figure 1: Wireshark with Packet Capture Agent. - Tshark: Tshark is a network protocol analyzer. It lets you capture packet data from a live network, or read packets from a previously saved capture file, either printing a decoded form of those packets to the standard output or writing the packets to a file. See Figure 2.

Figure 2: Tshark with Packet Capture Agent. - Zeek: Zeek (formerly Bro) is a network monitoring tool. It accepts as an input a server address to connect to. We were able to connect to the netobserv-agent via Zeek and receive packets in PCAP stream.
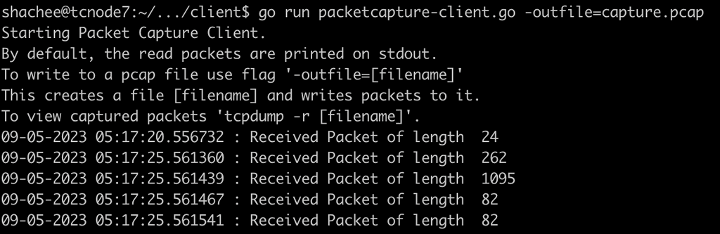
- Custom client: In order to test packet capture agent with a modifiable client, we wrote a simple client that connects to netobserv. The packets received from the capture agent could be written to file or displayed on screen. See Figure 3.

Figure 3: Custom client with Packet Capture Agent.

Types of filters supported
The current implementation of the agent supports filters that extract a subset of protocol (TCP/UDP/SCTP) and a combination with a port number. If the packet capture is enabled with no filters specified, all the packets through the specified interface are captured and streamed to the receiver. The filter is specified by setting environment variable PCA_FILTER.
Examples for filters:
- DNS packets:
export PCA_FILTER=udp,53 - TCP HTTP:
export PCA_FILTER=tcp,80 - TLS:
export PCA_FILTER=tcp,443 - SSL:
export PCA_FILTER=tcp,22
As a follow up, we plan to extend our filter library to include more complex and sophisticated specifications, including:
- fixed number of packets that begin each flow (e.g, first 12)
- sample of packets from a flow (e.g., 1 in N)
Resource usage
Capturing packets within the kernel and streaming them out to a client consumes resources. However, the packet capture agent is designed in a way to grab and stream packets from within the kernel using eBPF. Thus, the resource overheads only sustain for the time the capture is happening. In order to enumerate these overheads, we performed 2 sets of experiments: one for getting the memory consumption, and another for CPU usage. Both these experiments were done over a Red Hat OpenShift cluster.
In order to quantify how the resource consumption changed over different usage scenarios, we performed 6 different changes to workloads and captured them in a time series.
- Simple netobserv-agent without the PCA plug-in.
- PCA added netobserv-agent with PCA not enabled.
- PCA added netobserv-agent. PCA enabled with invalid filters.
- PCA added netobserv-agent. PCA enabled with filter set to <tcp,80>.
- PCA added netobserv-agent. PCA enabled with filter set to <udp,53>.
- PCA added netobserv-agent. PCA enabled with filter set to <tcp,443>.
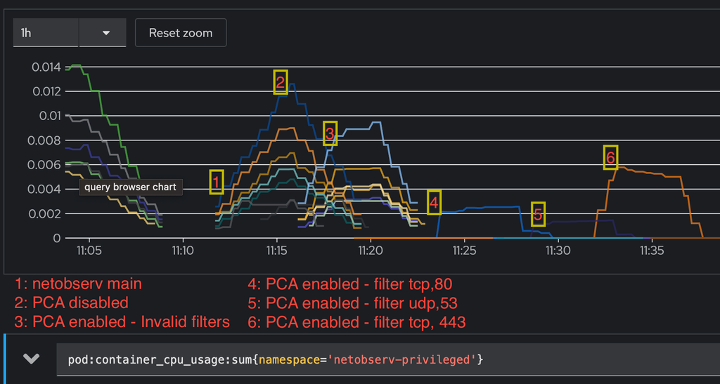
CPU usage
As you can see in Figure 4, the graph has been annotated with 6 labels, one for each usage scenario. The CPU usage increases with PCA enabled while the agent starts; this is because the eBPF-enabled kernel sets the filters up, but as you can see from labels 4, 5, and 6, the increase in marginal when the actual filtering is on. Since we expect most traffic in scenario 6 (<tcp,443>) due to higher volume of packet processing, the CPU usage is higher but reduces as soon as the capture agent is stopped.
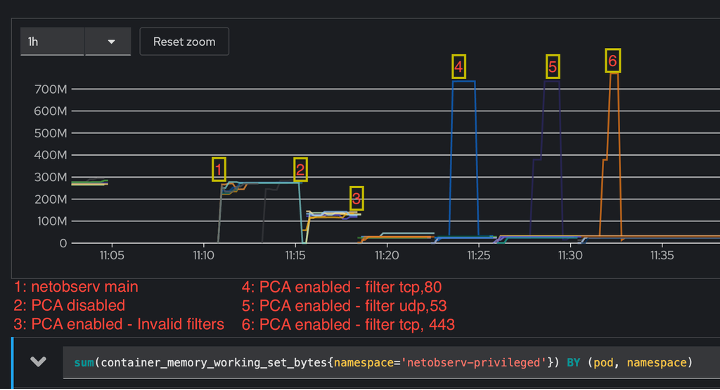
Memory usage
While measuring the memory usage, OpenShift limits memory used by a pod to around 800 MB. When PCA was either not present or not enabled, the usage stays the same, while it changes when PCA is enabled but with invalid filters. In such case, the memory occupied by the map structure that holds the packets is set to its minimal value. In the other cases (1 and 2), it is initialized to the number of CPUs by default for a perf-event array. So, even if the map is not used, it occupies space. For the filtering scenarios 4, 5, 6, the map is continuously filled with packets that are exported to PCAP stream, thus the memory usage is high and limited by the memory available to the pod. See Figure 5.
Conclusion
We created Packet Capture Agent as an extension for Network Observability eBPF Agent. The packet capture agent is disabled by default and the application manager can choose to enable it as and when required. The agent can take in simpler filters like protocols and port numbers to identify the subset of packets to be exported. The packets are exported as a PCAP stream and thus any end-point client capable of consuming PCAP over IP can be used as a receiver.
We tested with a wide range of clients including a simple Go-based receiver, Tshark, Wireshark, and Zeek. We performed thorough resource consumption analysis and empirically show that though the memory usage during the capture is high, which is expected behavior, the overhead in terms of compute resources and memory is minimal.
The source for netobserv-agent can be found at https://github.com/netobserv/netobserv-ebpf-agent.