Installing an entire observability stack can be hard to handle and not worth the effort in some cases. That's why we are introducing the Network Observability CLI as a technical preview.
What is the Network Observability CLI?
The Network Observability CLI (oc netobserv) is a lightweight flow and packet visualization tool. It deploys a NetObserv eBPF agent and flowlogs-pipeline on your Kubernetes cluster to collect flows or packets from nodes network interfaces and streams data to a single collector for analysis and visualization. This first version of the tool allows users to capture flows or packets running a simple command. It reuses the NetObserv components without the need to install and configure operator(s).
Architecture
Figure 1 depicts the Network Observability CLI architecture.
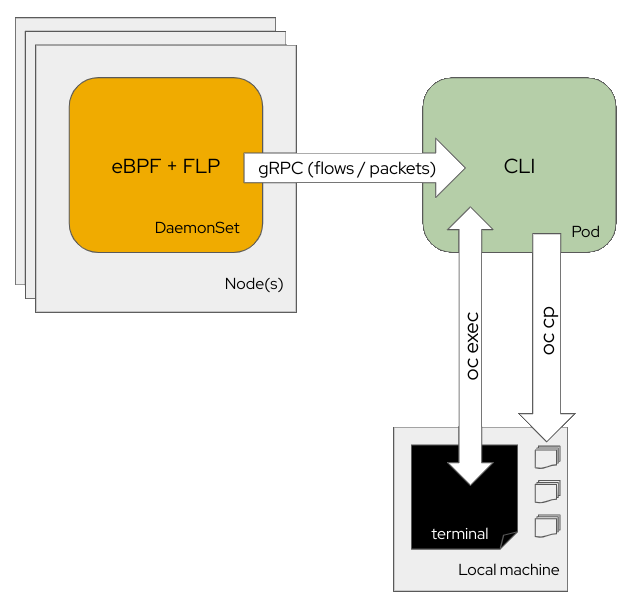
The CLI deploys eBPF agents as a DaemonSet embedding flowlogs pipeline in the same pods. These collect either flows or packets and send these data to a collector pod. The collector pod displays the collected content during the capture. Flows are stored as JSON and SQLite database files and packets are stored as PCAP file(s).
Behind the scene, your local terminal calls oc run to deploy the collector and then oc exec for a distant terminal access. Finally, when you exit a capture using Ctrl+C, the CLI runs the oc cp command to copy the output files to your local machine.
A different approach for each scenario
Let's first compare which deployment methods of the network observability stack best fit with these example scenarios in Table 1.
Deployment method | Configuration | Short debug session | Overall observability over short period of time | Long-term observability | Per-flow details | Packet capture (PCAP) |
CLI | Flows | 🗸 Best for enriched content | ✗ | ✗ | 🗸 | ✗ |
Packets | 🗸 Best for data analysis | ✗ | ✗ | ✗ No enrichment | 🗸 | |
Operator | Loki | ✗ | 🗸 | ✗ Unsatisfactory metrics performances | 🗸 | ✗ |
Prometheus | ✗ | 🗸 | 🗸 | ✗ | ✗ | |
Using both | ✗ | 🗸 | 🗸 | 🗸 | ✗ |
It's not worth installing the operator and dependent storage(s) for a short debug session or to get a preview of what eBPF agents can capture, whereas it makes sense for a long run scenario where you aim to keep history of logs or metrics for several days.
To see flows in detail, both the CLI and Operators allow you to deep dive into the Kubernetes-enriched fields (node/owner/pod/service names + zones) and featured fields such as bytes, packets drops, DNS IDs, latencies, and round-trip time.
How to install it
kubectl and oc CLIs allow installation of plug-ins that extend their capabilities with additional commands. A plug-in is mainly a script placed in your PATH and prefixed with the corresponding <cli+command>, name such as oc-netobserv. Read more about kubectl-plugins and oc-plugins.
For the purpose of this article, the following commands assume you are using oc.
The krew way
Krew itself is a kubectl plug-in that is installed and updated via Krew (yes, Krew self-hosts).
Follow the installation instructions on krew.sigs.k8s.io official website. Once installed, run the following command to install netobserv:
oc krew install netobservEnsure you have the latest version listed in github here as some upstream versions may be unstable.
From tar archive
Download the latest version either from GitHub releases or mirror.openshift.com.
Then follow the instructions on installing and using CLI plug-ins in the OpenShift documentation.
These should resume as the following commands using /usr/local/bin as the PATH folder:
tar xvf netobserv-cli-linux-amd64.tar.gz
chmod +x ./oc-netobserv
sudo mv ./oc-netobserv /usr/local/bin/
Verify the installation
To ensure the installation completed correctly, simply run the following command:
oc netobserv versionIt should print netobserv CLI version XXX with the version you picked earlier.
Usage
Use the following command to display the help:
oc netobserv helpWarning: this blog article was written for the first release of netobserv CLI. Features and filtering has been improved since. You may need to adapt the usage accordingly.
The output will look like this:
Netobserv allows you to capture flow and packets from your cluster.
Find more information at: https://github.com/netobserv/network-observability-cli/
Syntax: netobserv [flows] [filters]
options:
  flows      Capture flows information. Use options below for features / filtering.
        Options:
          --interfaces: interfaces to monitor
          --enable_pktdrop: enable packet drop (default: false)
          --enable_dns: enable DNS tracking (default: false)
          --enable_rtt: enable RTT tracking (default: false)
          --enable_filter: enable flow filter (default: false)
          --direction: flow filter direction
          --cidr: flow filter CIDR (default: 0.0.0.0/0)
          --protocol: flow filter protocol
          --sport: flow filter source port
          --dport: flow filter destination port
          --port: flow filter port
          --sport_range: flow filter source port range
          --dport_range: flow filter destination port range
          --port_range: flow filter port range
          --icmp_type: ICMP type
          --icmp_code: ICMP code
          --peer_ip: peer IP
          --action: flow filter action (default: Accept)
  packets    Capture packets from a specific protocol/port pair such as 'netobserv packets tcp,80'.
  cleanup    Remove netobserv components.
  version    Print software version.
As you can see, the CLI currently offers two capture options
Flows to get network flows containing enriched information
On top of this command, you can add extra features and filters. Example to capture round-trip time of TCP flows using port 80:
oc netobserv flows --enable_filter=true --protocol=tcp --port=80 --enable_rtt=trueFigure 2 depicts the terminal display when running the flow capture (Figure 2).
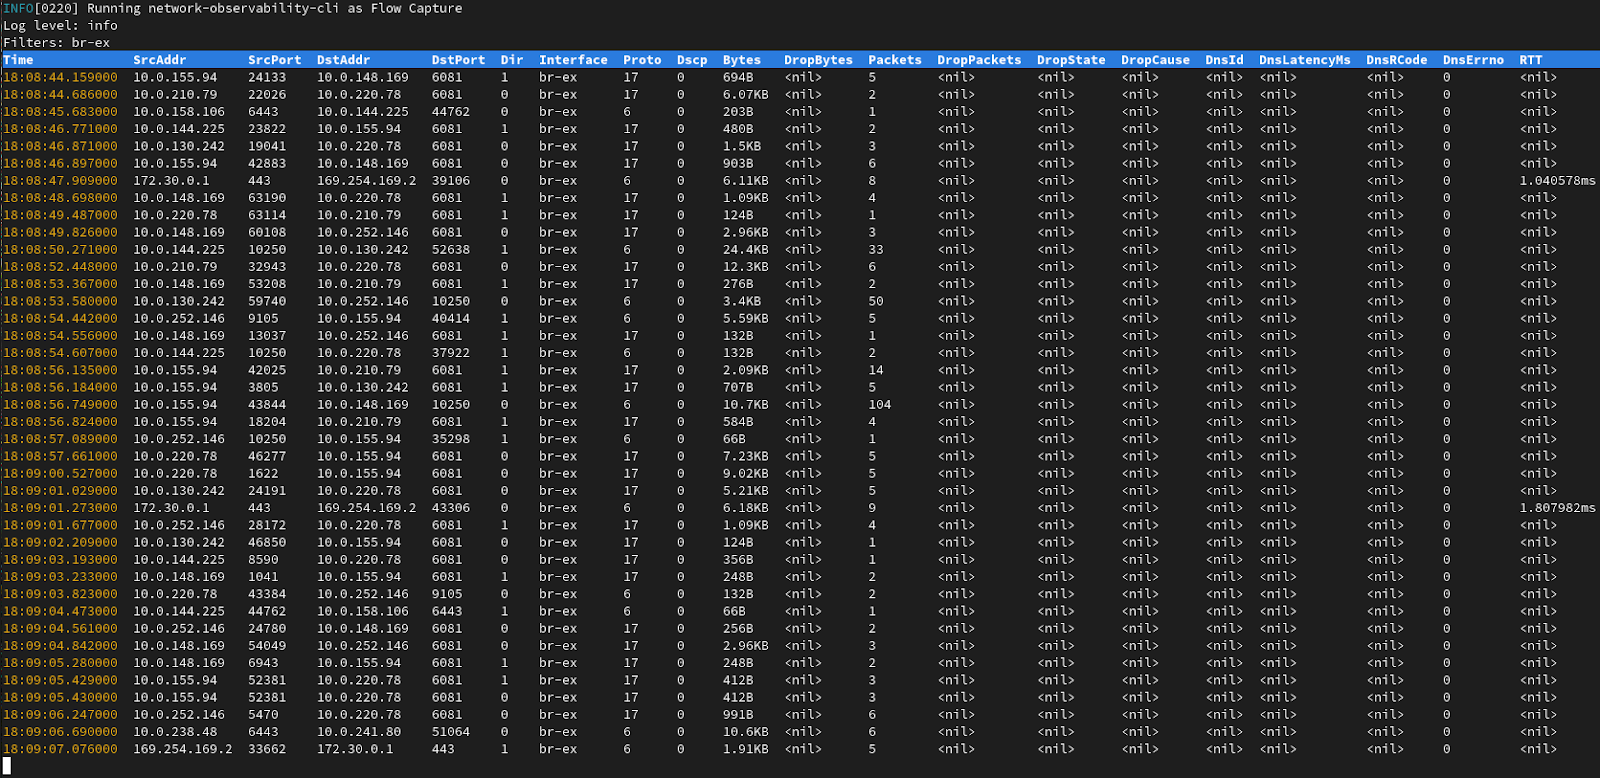
It will display a table view with latest flows collected and write data under output/flow directory. To stop capturing, press Ctrl+C.
This will write data into two separate files:
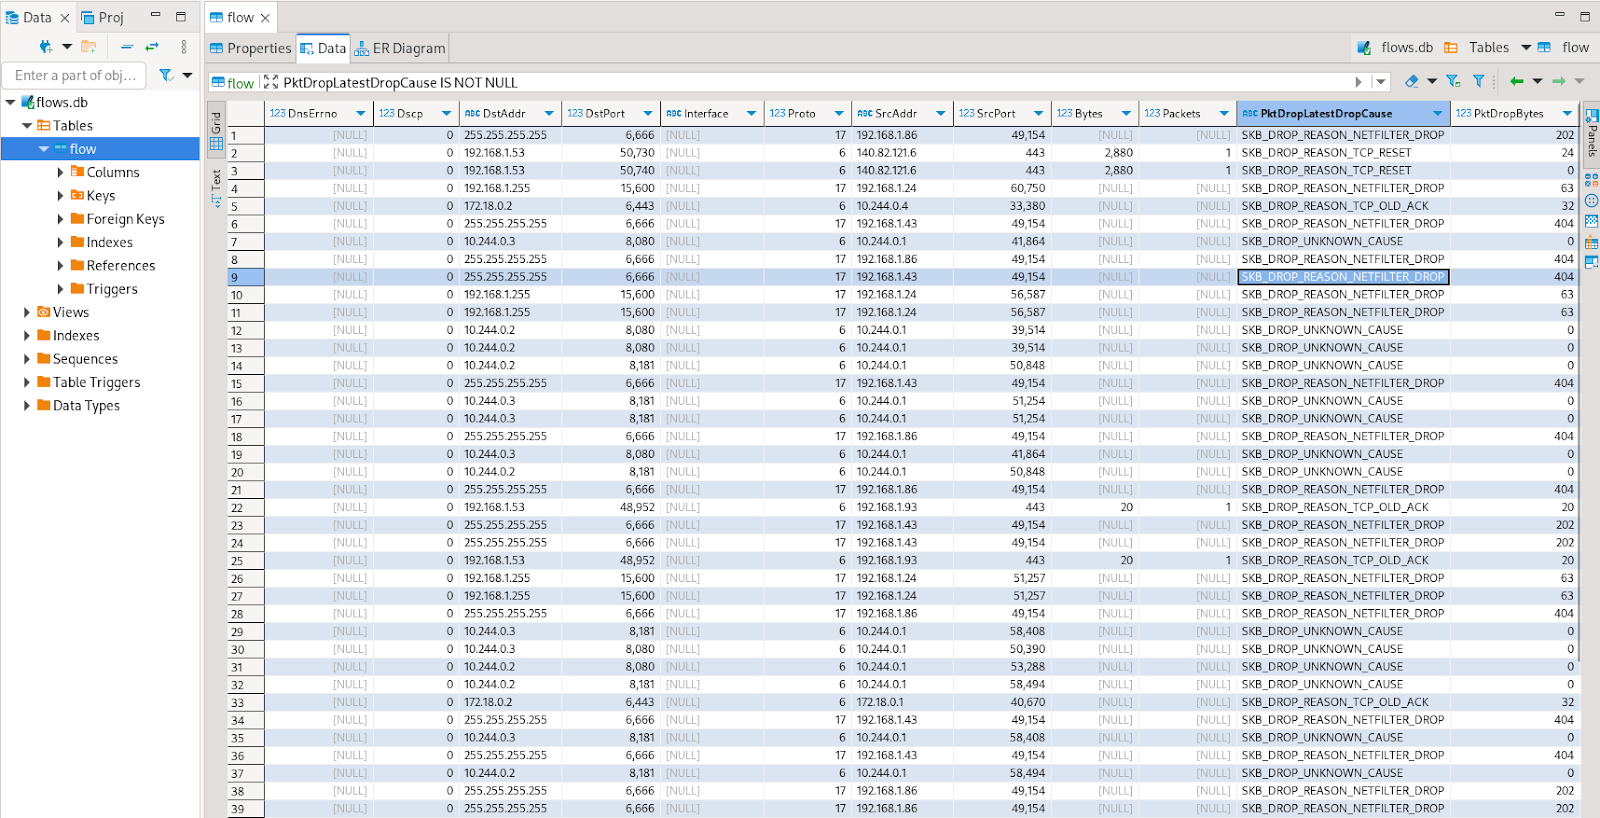
./output/flow/<CAPTURE_DATE_TIME>.jsoncontaining JSON array of received data such as:{ "AgentIP": "10.0.1.76", "Bytes": 561, "DnsErrno": 0, "Dscp": 20, "DstAddr": "f904:ece9:ba63:6ac7:8018:1e5:7130:0", "DstMac": "0A:58:0A:80:00:37", "DstPort": 9999, "Duplicate": false, "Etype": 2048, "Flags": 16, "FlowDirection": 0, "IfDirection": 0, "Interface": "ens5", "K8S_FlowLayer": "infra", "Packets": 1, "Proto": 6, "SrcAddr": "3e06:6c10:6440:2:a80:37:b756:270f", "SrcMac": "0A:58:0A:80:00:01", "SrcPort": 46934, "TimeFlowEndMs": 1709741962111, "TimeFlowRttNs": 121000, "TimeFlowStartMs": 1709741962111, "TimeReceived": 1709741964 }./output/flow/<CAPTURE_DATE_TIME>.dbdatabase that can be inspected using SQLite3, for example:bash-5.1$ sqlite3 ./output/flow/<CAPTURE_DATE_TIME>.db SQLite version 3.34.1 2021-01-20 14:10:07 Enter ".help" for usage hints. sqlite> SELECT DnsLatencyMs, DnsFlagsResponseCode, DnsId, DstAddr, DstPort, Interface, Proto, SrcAddr, SrcPort, Bytes, Packets FROM flow WHERE DnsLatencyMs >10 LIMIT 10; 12|NoError|58747|10.128.0.63|57856||17|172.30.0.10|53|284|1 11|NoError|20486|10.128.0.52|56575||17|169.254.169.254|53|225|1 11|NoError|59544|10.128.0.103|51089||17|172.30.0.10|53|307|1 13|NoError|32519|10.128.0.52|55241||17|169.254.169.254|53|254|1 12|NoError|32519|10.0.0.3|55241||17|169.254.169.254|53|254|1 15|NoError|57673|10.128.0.19|59051||17|172.30.0.10|53|313|1 13|NoError|35652|10.0.0.3|46532||17|169.254.169.254|53|183|1 32|NoError|37326|10.0.0.3|52718||17|169.254.169.254|53|169|1 14|NoError|14530|10.0.0.3|58203||17|169.254.169.254|53|246|1 15|NoError|40548|10.0.0.3|45933||17|169.254.169.254|53|174|1
or DBeaver (Figure 3):
Packets to get a PCAP file containing full packet data
Figure 4 depicts the terminal display when running the packet capture.
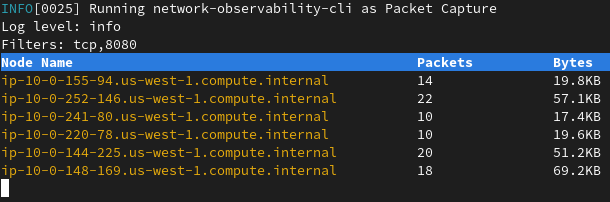
It will display a table view with the latest packets collected and write data under output/pcap directory. To stop capturing, press Ctrl+C.
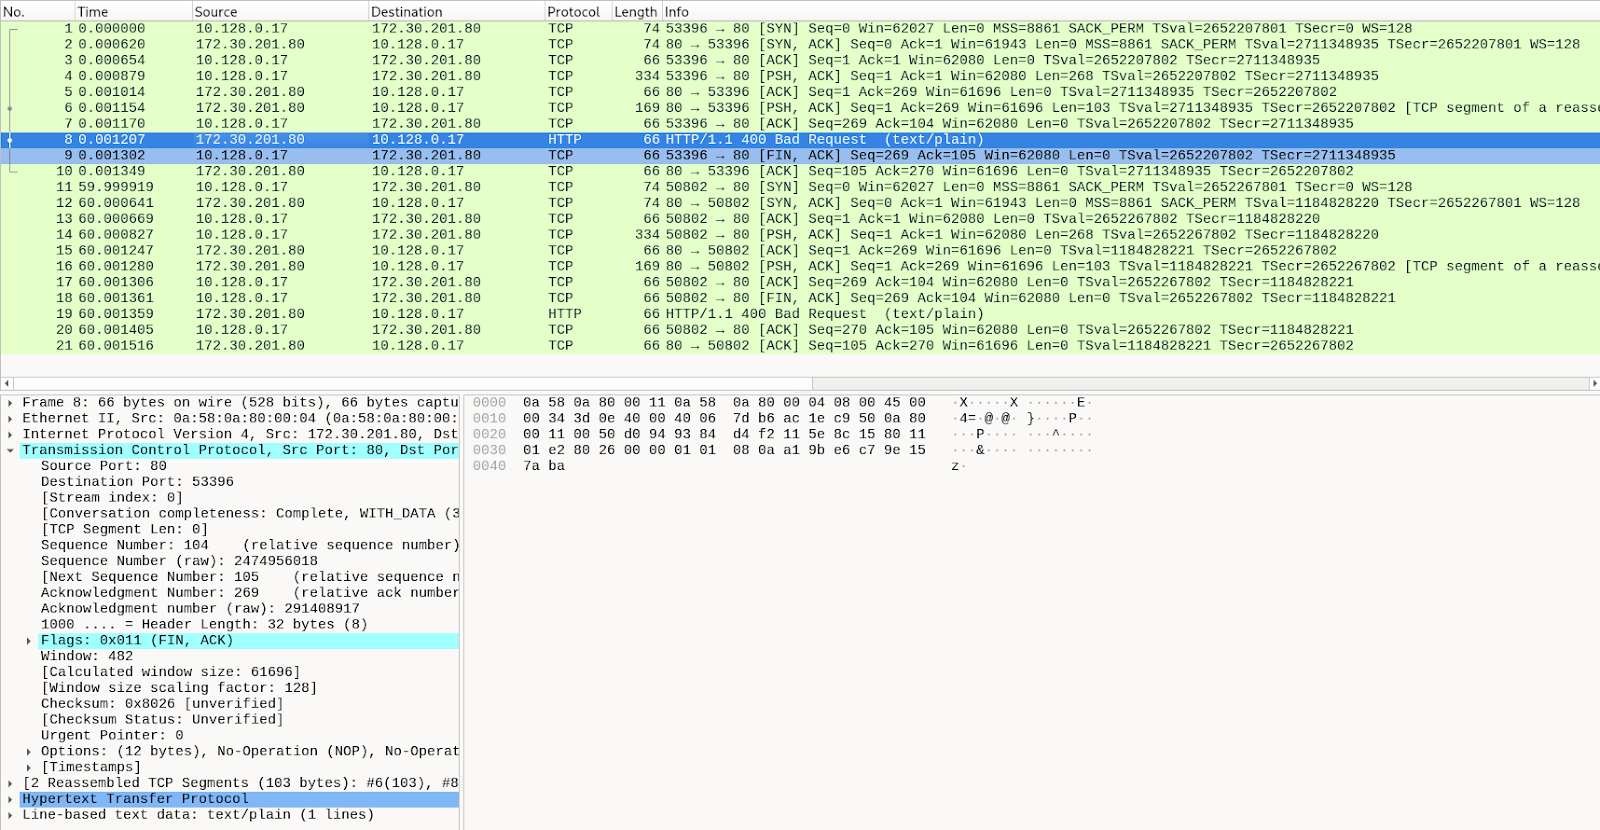
This will write PCAP into a single file located in ./output/pcap/<CAPTURE_DATE_TIME>.pcap that can be opened with Wireshark, for example (Figure 5).
This command must have both protocol and port specified to work. We will improve the packet capture filtering options in the future. Packet drop, DNS latencies, and RTT features are not available in this command.
A third option called cleanup allows you to remove any remaining netobserv component. That should not happen because this command is automatically run when exiting the capture but it might be necessary to manually execute it in case of a connectivity issue or crash.
Future improvements
For now, the Network Observability CLI is only providing capture commands such as many other observability projects. There are planned improvements to embed tools to facilitate your life as much as possible.
We plan to improve the capture process by automatically finding IP addresses and ports that match to the pods you are looking for and automatically filtering on these.
The packet capture needs to be improved to align with flows filter capabilities and facilitate decryption of traffic. We are also investigating ways to embed enriched information inside the PCAP file format.
Also, the CLI could hold additional functionalities, such as installing and configuring the Network Observability Operator in a step-by-step setup, including Loki and Prometheus configurations.
It could become yet another toolset of observing and debugging tools such as inspektor-gadget but fully tested and supported by Red Hat as part of the OpenShift Network Observability.
Feedback
We hope you liked this article! A follow-up article with use cases is coming soon. Stay tuned.
NetObserv is an open source project available on GitHub. Feel free to share your ideas and use cases or ask the community for help.
Thanks to: Joël Takvorian and Sara Thomas for reviewing.
Last updated: January 15, 2025