Recently, the Network Observability Operator released version 1.6, which added a major enhancement to provide network insights for your Red Hat OpenShift cluster without the Loki log aggregation system. This enhancement was described in What's new in Network Observability 1.6 article, providing a quick overview of the feature. Until this release, Loki was required to be deployed alongside Network Observability to store the network flows data.
In this article, let's look at some of the advantages and trade-offs users would have when deploying the Network Observability Operator with Loki disabled. As more metrics are enabled by default with this feature, we'll also demonstrate a use case on how those metrics can benefit users for real world scenarios.
Configure Network Observability without Loki
Loki as datasource is currently enabled by default. To configure the Network Observability Operator without Loki, set the FlowCollector resource specification to disable Loki:
loki:
  enable: false
When Loki is disabled, metrics continue to get scraped by the OpenShift cluster Prometheus without any additional configuration. The Network Traffic console uses Prometheus as a source for fetching the data.
Performance and resource utilization gains
In this section, let's dive into the query performance and resource utilization differences when Network Observability is configured with Loki versus without it.
Query performance
Prometheus queries are blazing fast compared to Loki queries, but don't take my word for it. Let's look at the data from the query performance tests:
Test bench environment
- Test: We conducted 50 identical queries without any filters for 3 separate time ranges to render a topology view for both Loki and Prometheus. Such a query requests all K8s Owners for the workload running in an OpenShift cluster that had network flows associated to them.
- Test bed: 9 workers and 3 primary nodes, AWS m5.2xlarge machines (8 vCPU, 32 GB RAM).
- LokiStack size: 1x.small.
Results
The following table shows the 90th percentile query times for each table:
| Time Range | Loki | Prometheus |
| Last 5m | 984 ms | 99 ms |
| Last 1h | 2410 ms | 236 ms |
| Last 6h | > 10 s | 474 ms |
As the time range to fetch network flows gets wider, Loki queries tend to get slower or time out, while Prometheus queries are able to render the data within a fraction of a second.
Resource utilization
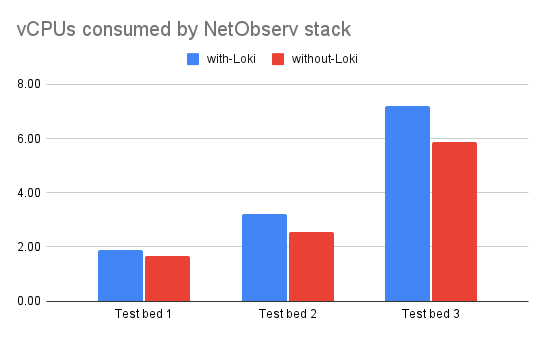
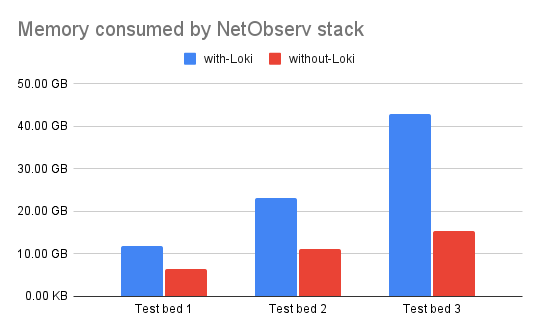
In our tests conducted on 3 different test beds with varied workloads and network throughput, when Network Observability is configured without Loki, total savings of memory usage are in the 45-65% range and CPU utilization is lower by 10-20%. (Note that actual resource utilization may depend on various factors such as network traffic, FlowCollector sampling size, and the number of workloads and nodes in a Red Hat OpenShift Container Platform cluster). Not to mention you do not need to provision and plan for additional object storage in public clouds for Loki, which overall reduces the cost and improves operational efficiency significantly.
In our perf tests, kube-burner workloads were used to generate several objects and create heavy network traffic. We used a sampling rate of 1 for all of the following tests:
- Test bed 1: 25 nodes cluster—this test takes into account the total number of namespace, pods, and services in a OpenShift Container Platform cluster, places load on the eBPF agent (component that probes and generates flows), and represents use cases with a high number of workloads for a given cluster size. For example, Test 1 consists of 76 Namespaces, 5153 Pods, and 2305 Services.
- Test bed 2: 65 nodes cluster—this test takes into account a high ingress traffic volume.
- Test bed 3: 120 nodes cluster—this test takes into account the total number of namespace, pods, and services in an OpenShift Container Platform cluster, places load on the eBPF agent on a larger scale than Test bed 1, and represents use cases with a high number of workloads for a given cluster size. For example, Test bed 3 consists of 553 Namespaces, 6998 Pods, and 2508 Services.
The following graphs (Figures 1 and 2) show total vCPU, memory, and storage usage for a recommended Network Observability stack: flowlogs-pipeline (component that enriches the flows with Kubernetes-related information to be stored as logs), eBPF-agent, Kafka, Prometheus, and optionally Loki for production clusters.
Let's look at the amount of estimated storage you need for all the network flows and Prometheus metrics that Network Observability has to store. For context, even when Loki is installed, Network Observability publishes a default set of Prometheus metrics for monitoring dashboards, and it adds additional metrics when Loki is disabled to visualize network flows. Figure 3 shows the estimated amount of storage required to store 15 days of network flows data (when configured with Loki), with Prometheus metrics and Kafka as an intermediary data streaming layer between the eBPF-agent and the flowlogs-pipeline.
The network flows rate for each test bed was 10K, 13K, and 30K flows/second respectively. The storage for Loki includes AWS S3 bucket utilization and its PVC usage. For Kafka PVC storage value, it assumes 1 day of retention or 100 GB, whichever is attained first.
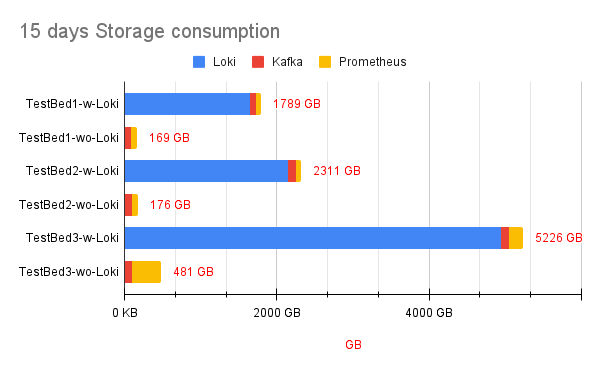
As seen across the test beds, we find a storage savings of 90% when Network Observability is configured without Loki.
Trade-offs
We saw that having Prometheus as datasource provides impressive performance gains and sub-second query times; however, it also introduces the following constraints:
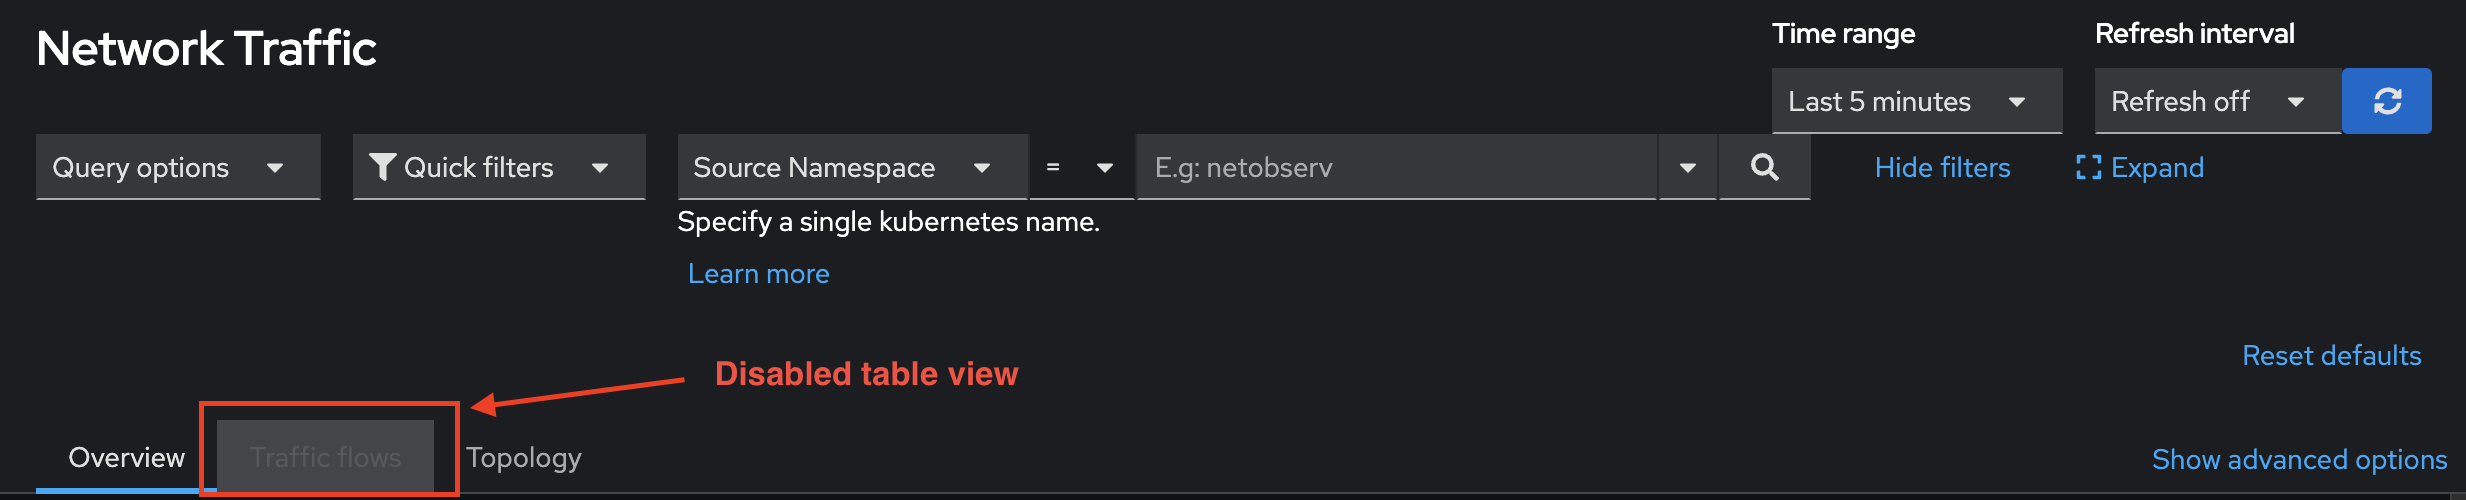
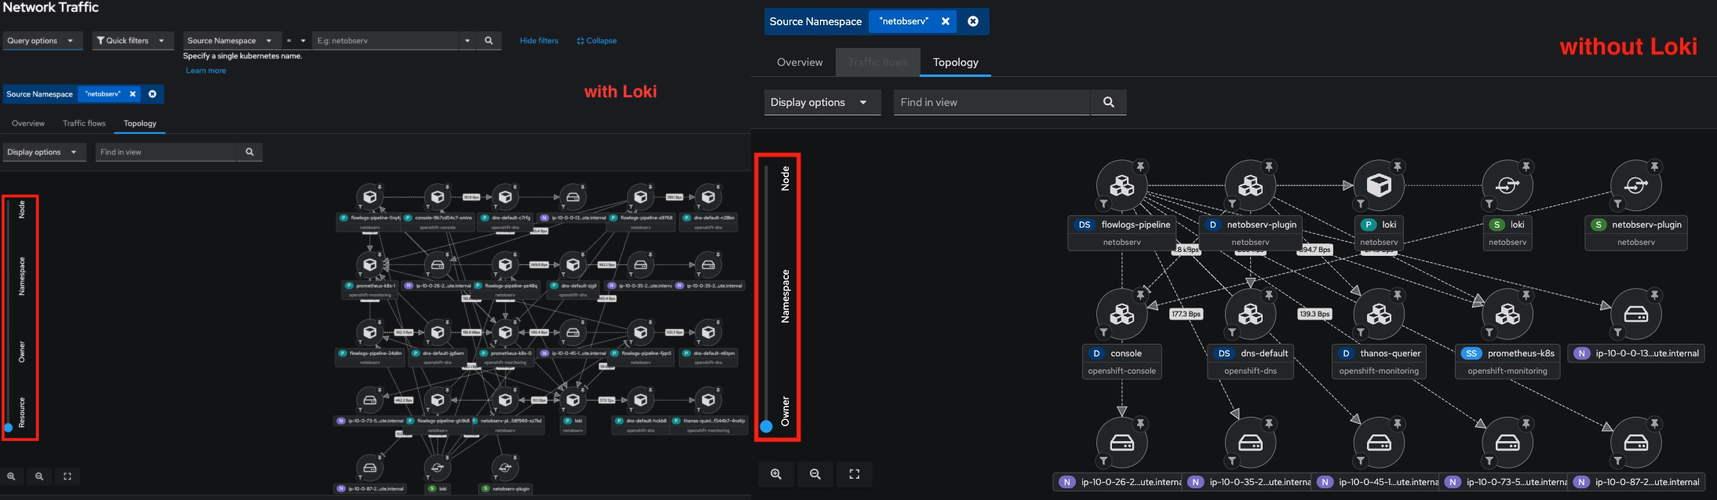
- Without storage of network flows data, the Network Observability OpenShift web console no longer provides the Traffic flows table, as shown in Figure 4.
- Per-pod level of resource granularity is not available since it causes Prometheus metrics to have high cardinality, as shown in Figure 5.
Should you need per-flow or per-pod level of granularity for diagnostic and troubleshooting, other than enabling Loki you have multiple other options available:
- Collect flowlogs into your preferred data analytics tool using the
.spec.exportersconfiguration in the FlowCollector. Currently Kafka and IPFIX are supported exporters. - In this release, Network Observability also introduced the FlowMetrics API, which lets you create custom metrics that are not available out of the box. The FlowMetrics API creates on-demand Prometheus metrics based on enriched flowlogs fields, which can be used as labels for custom Prometheus metrics.
Note
Use this option with caution, as introducing metrics that may have labels with high cardinality increases the cluster's Prometheus resource usage and might impact overall cluster monitoring.
- Restricted multitenancy: Prometheus in an OpenShift cluster currently doesn't support multitenancy in a way that Loki does. Non-admin users can be added to
cluster-monitoring-viewwhere the user can have access to view all available Prometheus metrics.
For example, the following command can be used to enable Prometheus metrics, visualizing for the testuser-0 user:
oc adm policy add-cluster-role-to-user cluster-monitoring-view testuser-0Network Observability metrics use case
Let's look at a scenario about how users can benefit from metrics published by the Network Observability Operator. Let's say you suspect an anomaly with DNS lookups in your cluster and want to investigate workloads that may be facing DNS latencies. With DNSTracking feature and enriched Prometheus metrics, you can quickly set up an alert to trigger on high DNS latencies. For example, the following alert is triggered for any workloads that experience a DNS latency > 100ms:
apiVersion: monitoring.coreos.com/v1
    kind: PrometheusRule
    metadata:
      name: dns-latency-alert
      namespace: netobserv
    spec:
      groups:
      - name: DNSLatencyAlert
        rules:
        - alert: DNSLatencyAlert
          annotations:
            message: |-
              {{ $labels.DstK8S_OwnerName }} in {{ $labels.DstK8S_Namespace }} is experiencing high DNS Latencies.
            summary: "Trigger for any workloads experiencing > than 100ms DNS Latency."
          expr: histogram_quantile(0.9, sum(rate(netobserv_workload_dns_latency_seconds_bucket{DstK8S_Namespace!=""}[2m])) by (le,DstK8S_Namespace,DstK8S_OwnerName))*1000 > 100
          for: 10s
          labels:
            severity: warning
To demonstrate this use case, I configured the CoreDNS erratic plug-in in the openshift-dns namespace to add latencies for the example.org domain using the following configuration:
example.org {
            erratic {
                delay 2 100ms
            }
    }
Configuring for DNS latencies adds a 100ms delay to every second DNS request coming in for example.org. A test pod performing DNS lookups for example.org every 1 second was created, eventually triggering the earlier configured DNSLatencyAlert in my OpenShift Container Platform cluster. See Figure 6.
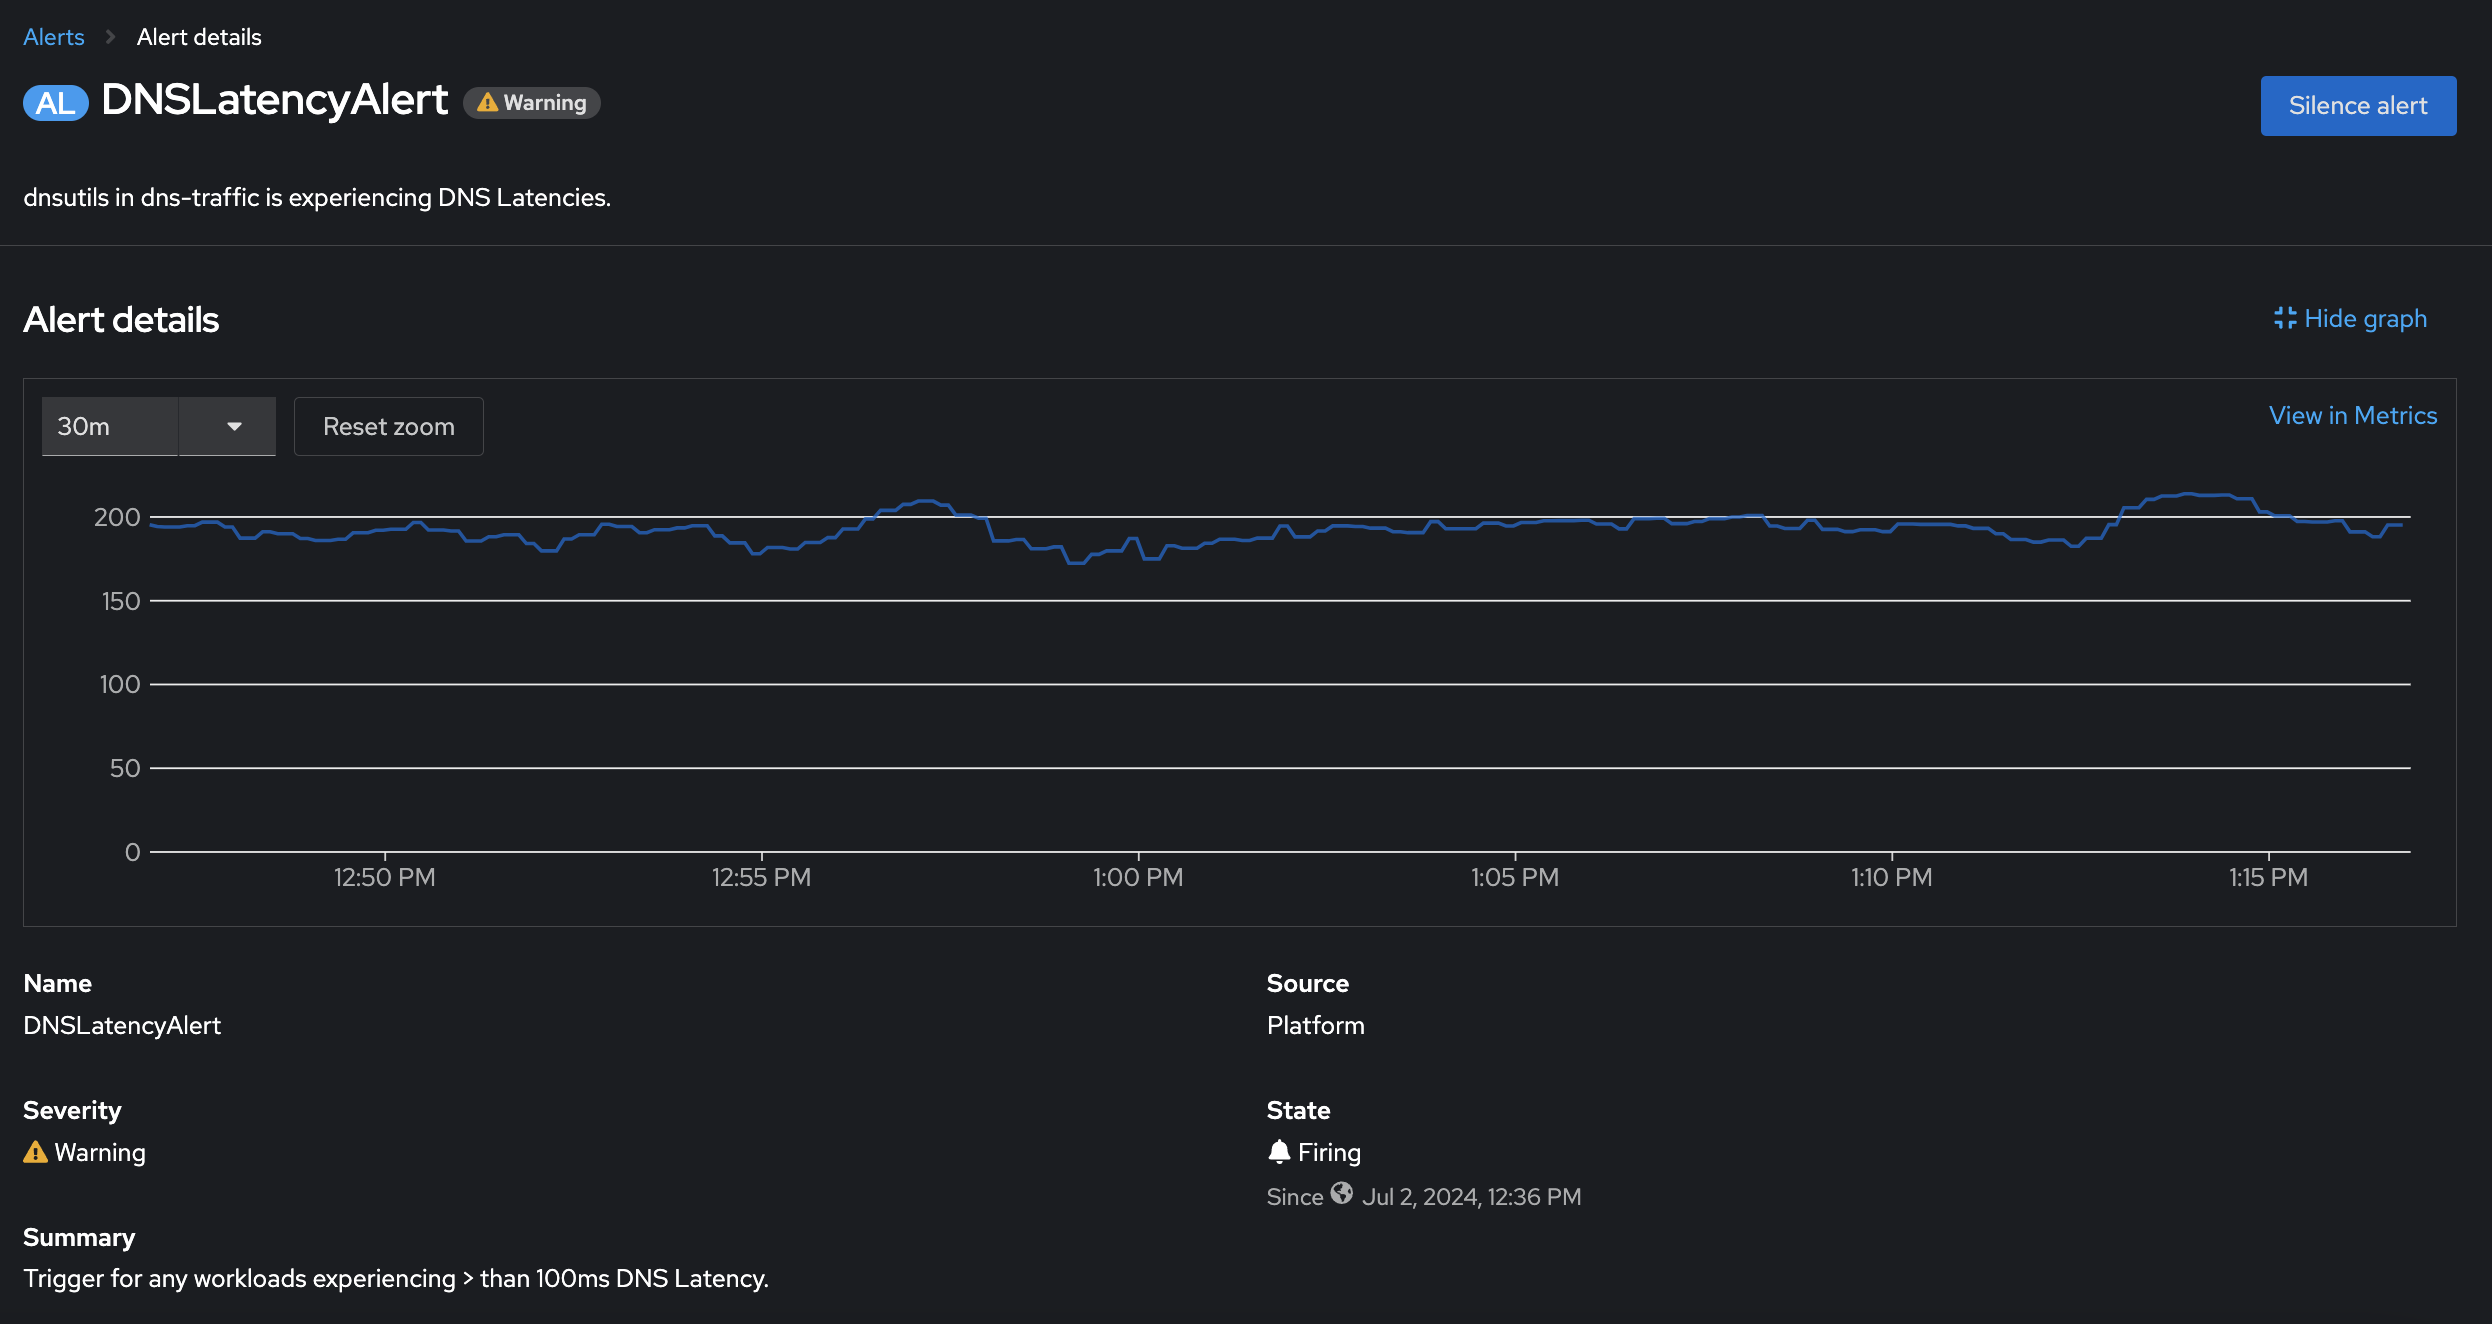
Similarly, additional alerts on different DNS response codes could be set up, for example an alert for DNS lookup failures such as DNS queries receiving NXDOMAIN or SERVFAIL responses can also be set up as flowlogs and metrics are already enriched with DNS response codes. In addition to metrics for the DNSTracking feature, Network Observability provides metrics for other features, such as round-trip-time and packet drops.
Conclusion
Network Observability operator provides the visibility you need to proactively detect issues within OpenShift cluster networking. Now with an option to disable Loki, Network Observability operator provides lightweight solution to visualize, diagnose, and troubleshoot networking issues faster and at a lower cost. Network Observability's Prometheus metrics can be leveraged to set up user defined alerts in your Red Hat OpenShift Container Platform cluster.
Whether you have already deployed or considering to deploy Network Observability, we would love to engage with you and hear your thoughts here. Thanks for reading. Special thanks to Joel Takvorian, Julien Pinsonneau, and Sara Thomas for providing information for this article.