Network Observability 1.6 was released in June 2024. Even though this is considered a minor version upgrade from 1.5, it is a significant release that could lower the barrier to adoption into production.
But before we go further, for those of you new to Network Observability, it is an optional operator that provides a slew of capabilities to track and provide insight into your network traffic flows. While it works on any Kubernetes cluster, it works even better in a Red Hat OpenShift environment, which is what I will focus on in this article. I will only discuss the new features in this release so if you want the full feature list, read the documentation on About Network Observability.
Graphs and logs without Loki and Storage
Prior to 1.4, Network Observability required an external component called Loki as well as storage, such as an S3 bucket, to store logs. These flow logs allowed Network Observability to provide a rich UI to display graphs, tables, and a topology. The CPU and memory resources required by Loki can be significant, particularly if you have lots of traffic and are sampling all data, not to mention the storage required. In 1.4 and 1.5, if you have your own observability platform and only need the flow logs data, you can simply export this data and not install Loki or provide storage. When you do this, you essentially get no UI besides some minimal flow metrics in Observe > Dashboards, because the expectation is that your platform will provide the features and the visuals.
This release changes that premise. It brings back the graphs in the Overview panel and the topology in the Topology panel. This is huge because the core of Network Observability is now fully functional at a fraction of the resources required when Loki is used. It achieves this by creating Prometheus metrics from the flows and storing them at 15-second intervals.
So what's the catch? Without storing the flow logs as JSON data, there is some impact. The most notable is that there won't be a traffic flows table, because flows are no longer stored (Figure 1).
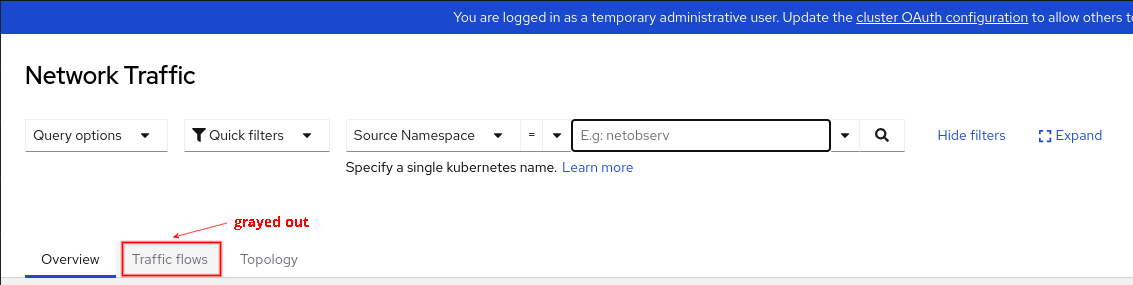
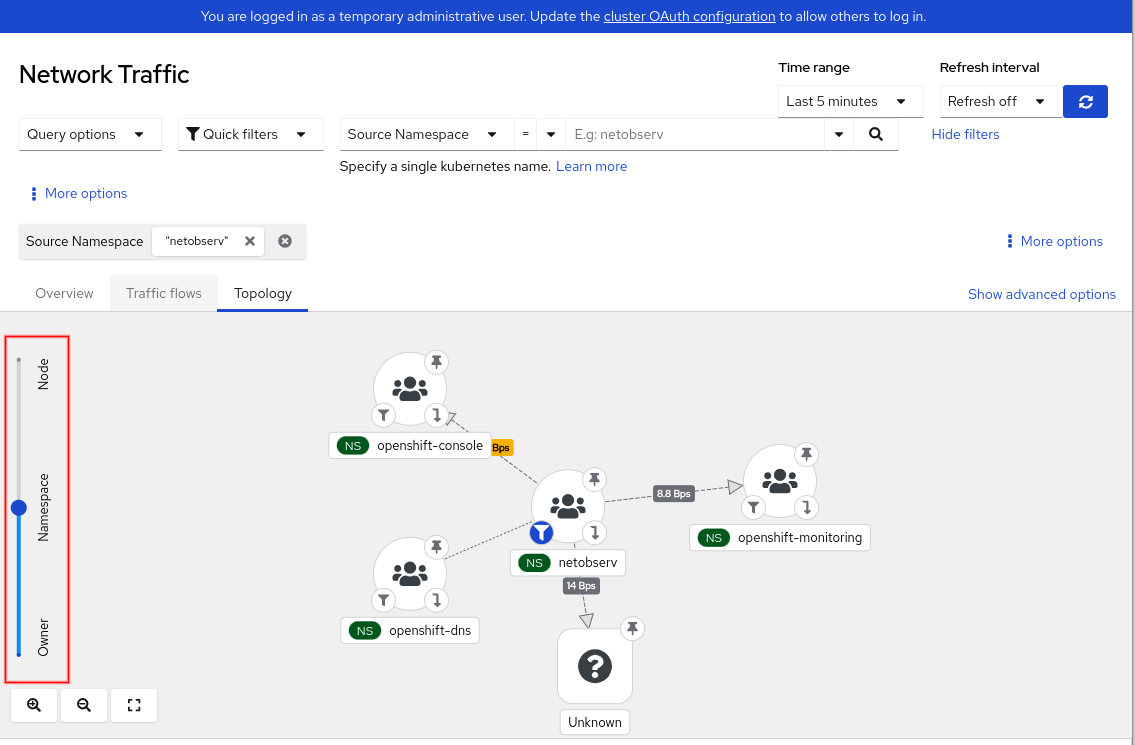
The other item is that metrics don't have information at the pod level. So for example, in the topology, the Resource scope, which shows the pod to pod/service communication, does not exist (Figure 2).
A couple of other features, namely packet drop reason and multi-tenancy, are not supported but are planned for a following release. If you need any of these capabilities, then go ahead and install Loki and provide storage as usual.
Let's walk through how to configure a Loki-less setup. First, install the Network Observability Operator. In Operators > Installed Operators, click the Flow Collector link, and then Create FlowCollector. Click Loki client settings to open this up (Figure 3).
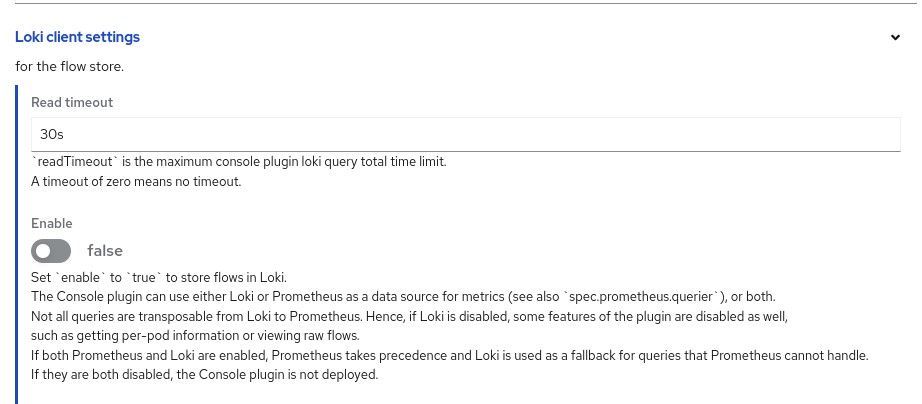
Set Enable to false, since Loki is enabled by default. That's it.
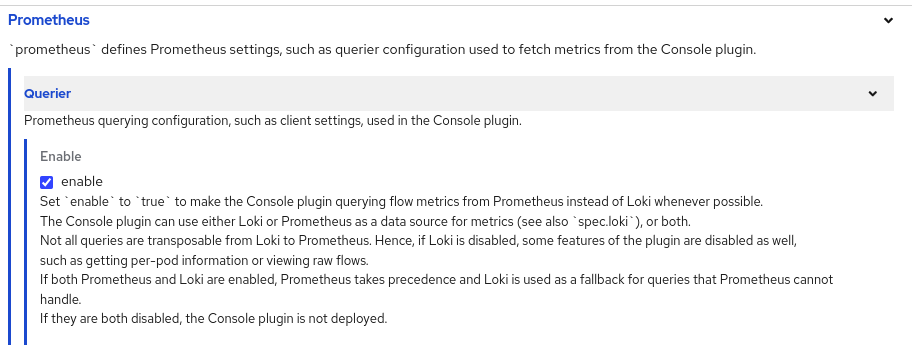
There is one other note worth mentioning: even if you do install Loki, in the Web console, Observe > Network Traffic, it favors using metrics instead of Loki for querying whenever possible. By doing this, not only is the user experience faster, but it is also possible to query data over a period of weeks or months. This behavior is configurable in the Prometheus > Querier in the Enable setting (Figure 4).
eBPF Agent enhancements
The eBPF Agent probes the network interfaces and generates flows when it sees network traffic. There were a number of eBPF Agent enhancements made. Let's go through them one-by-one.
Deploy on specific nodes
By default, the eBPF Agent is deployed on each node using a DaemonSet. If you know for sure that you do not need to run it on all nodes, you can control which nodes to deploy it on. This is actually a Kubernetes feature in the scheduler that is now implemented in the eBPF Agent. There are many ways to do this, and the following method uses node affinity to deploy the eBPF Agent only on pods with a specific label:
 agent:
   ebpf:
     advanced:
       scheduling:
         affinity:
           nodeAffinity:
             requiredDuringSchedulingIgnoredDuringExecution:
               nodeSelectorTerms:
               - matchExpressions:
                 - key: ebpf-agent
                   operator: In
                   values:
                   - "true"  # make sure this has quotes
If you have oc installed on your computer, enter oc edit flowcollector. Look for the ebpf section and add the lines above starting at advanced. You can also do this in Web console. Go to Operators > Installed Operators. Look for the Network Observability row, click the Flow Collector link and then the cluster link. Because this is an advanced feature, it is not in Form view, so click the YAML tab to edit the manifest.
Now this only deploys on nodes with the ebpf-agent=true label. Set this label by replacing "node-name" with your node name below:
oc label nodes node-name ebpf-agent=trueFlow filter at eBPF level
Network Observability always had great filtering capability in the Network Traffic panel. However, that is done at the UI level, meaning the flows are still generated and stored, and hence resources are being consumed. If resources are a major concern, consider this feature *if* the filtering fits your requirements.
To generate flows (or not generate flows) for very specific data, you can specify a single filter to do this. Here's an example to only generate flows for network traffic on TCP port 6443:
 agent:
   ebpf:
     flowFilter:
       enable: true
       action: Accept
       cidr: 0.0.0.0/0  # refers to any traffic
       ports: 6443
       protocol: TCP
Enter oc edit flowcollector. Again, look for the ebpf section and add the rest of the lines starting at flowFilter. The cidr specifies a network address and prefix. The example refers to any traffic, but for a specific network, use a value like 10.0.62.0/24. The feature is limited to one filter and many of the attributes can only have one value. For more details, see the flowFilter reference.
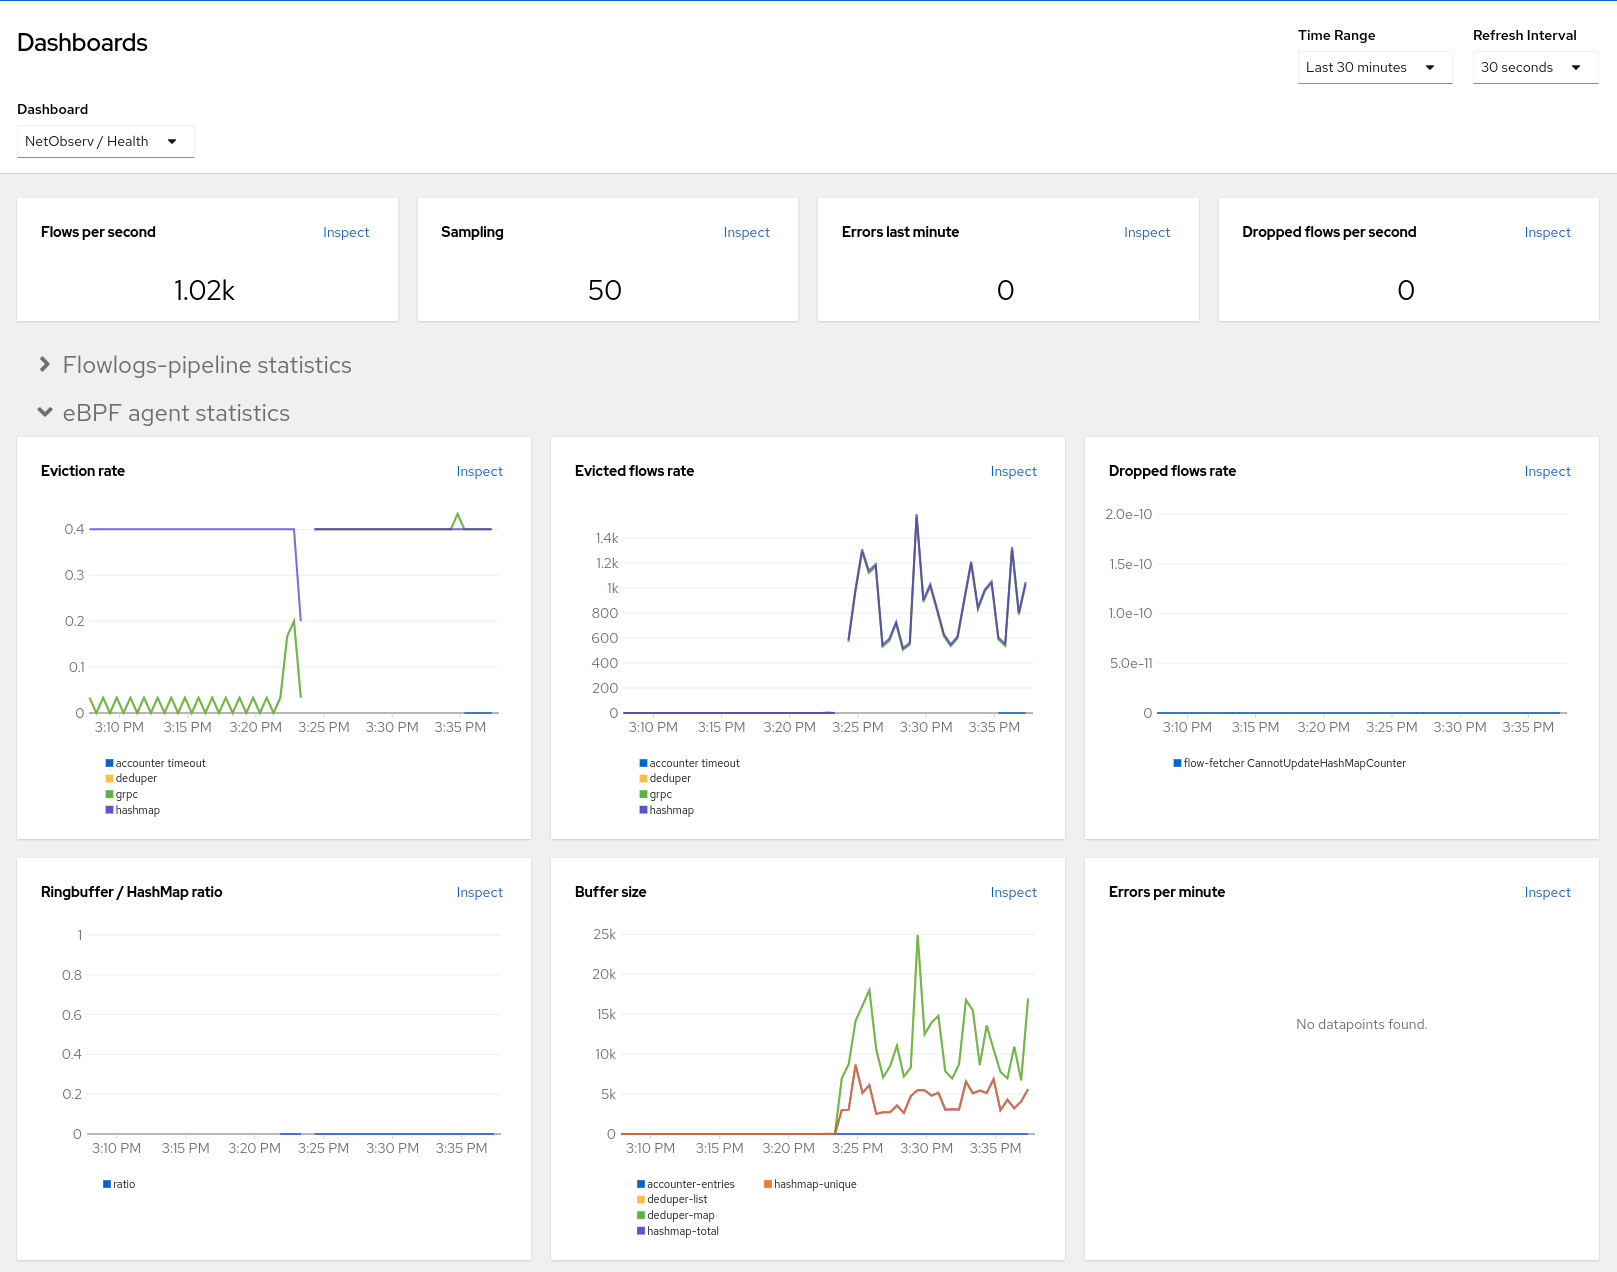
eBPF Agent metrics
You can view statistics for eBPF Agent. This is in Web console under Observe > Dashboards. Select NetObserv / Health in the Dashboard dropdown (Figure 5). There are graphs for eviction rates, dropped flow rates, and more.
Other eBPF changes
Here are a few other minor eBPF changes:
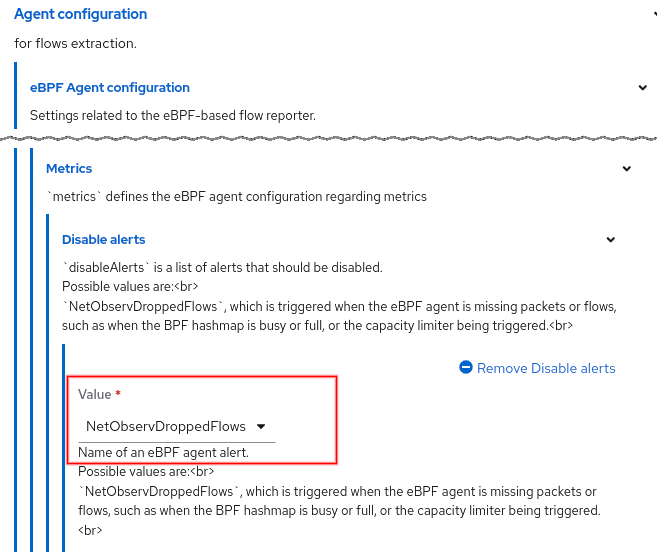
- Option to alert if it's dropping flows.
There is a new option in the Flow Collector to control whether an alert is shown if it's dropping flows (Figure 6). By default, this is enabled.
- Use enhanced TCx hook.
Internally, the eBPF Agent uses the Traffic Control (TC) hook to probe the ingress and egress traffic on the interfaces. In Red Hat OpenShift Container Platform 4.16, which upgrades Red Hat Enterprise Linux (RHEL) to 9.4, it leverages the enhanced TCx hook for performance gains. - Mapping performance improvement.
With RHEL 9.x, it leverages a new map (hash table) method for flows and packets to achieve significant performance improvement. - DNS Tracking improvement.
Previously with the DNSTracking feature, it was unlikely to generate DNS statistics if sampling was configured to be greater than 1, because the probe expected to catch both the request and the response. However, the request and response is only necessary to calculate DNS latency. Therefore, this has been improved so that it still saves the DNS id and flags even if it only receives the response. Note that there is no information saved on the request.
Flow Collector enhancements
A few enhancements were made in Flow Collector. They are:
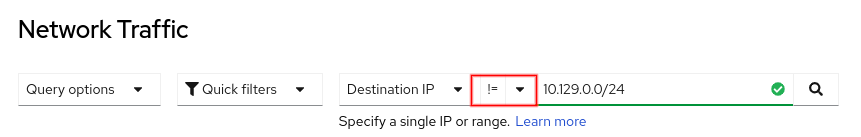
- Filter not on "ip".
In Observe > Network Traffic, for the IP-related filter fields, such as SourceIP, Destination IP, Source Node IP, and Destination Node IP, you can filter by not matching or excluding that IP or range (Figure 7).
- De-duplication of flows.
When a flow is a duplicate on another interface, instead of saving multiple copies of that flow data, only one is stored now. It keeps track of the list of interfaces that refer to the flow data. This greatly reduces the amount of storage.
The raw JSON fields have been renamed and pluralized to Interfaces and IfDirections, since the type changed to a list from a single value. Note the use of square brackets for the lists below:
     "IfDirections": [
       0
     ],
     "Interfaces": [
       "br-ex"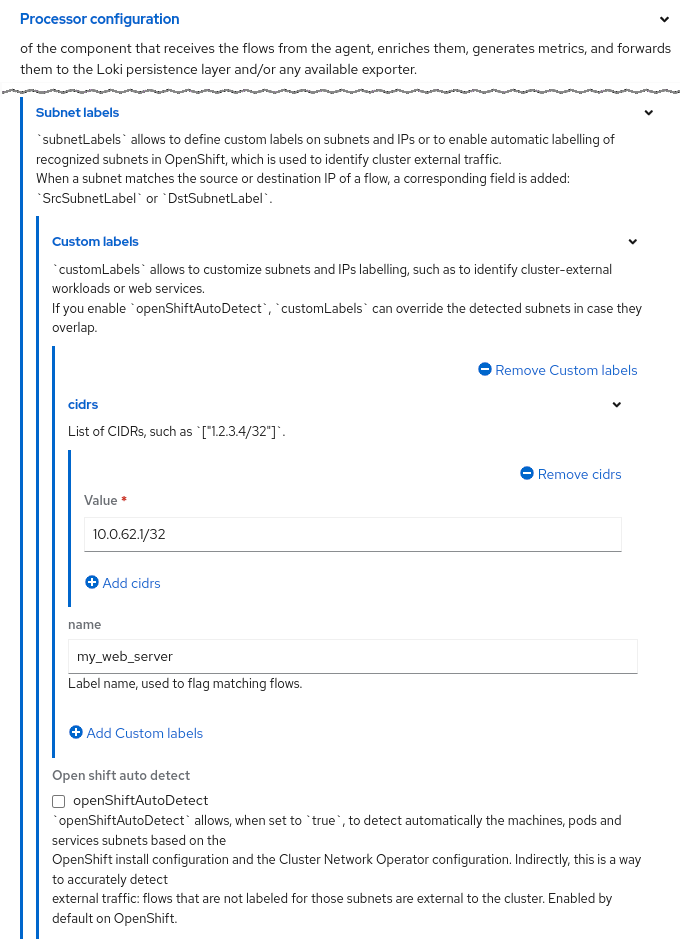
],- Subnet labels.
You can define a list of names for CIDRs (IP ranges and/or hosts). When the CIDR matches, the name appears in the flow data as theSrcSubnetLabelorDestSubnetLabelfield. Here is an example:
     processor:
       subnetLabels:
         customLabels:
         - cidrs:
           - 200.1.1.1/32  # provide a name for this host
           name: Ext_server
         openShiftAutoDetect: true  # this is the default
Enter oc edit flowcollector. Look for the processor section and add the rest of the lines starting at subnetLabels. The Form view in Web console looks like Figure 8.
By default, the OpenShift auto-detect mode is enabled to identify internal CIDRs as Pods, Services, Machines or n/a for "not applicable". While CIDRs can be internal or external, they are typically external to allow you to provide a custom name for them. If you use a naming convention such as prefixing Ext_ for all cluster-external traffic, then you can create a custom metric for this. Here's a PromQL that displays a graph of external traffic in bytes over a 1-minute period:
sum(rate(netobserv_workload_egress_bytes_total{DstSubnetLabel=~"|Ext_.*"}[1m]))This assumes the workload_egress_bytes_total metric has been included in processor.metrics.includeList. See my Network Observability 1.5 blog on how to do this.
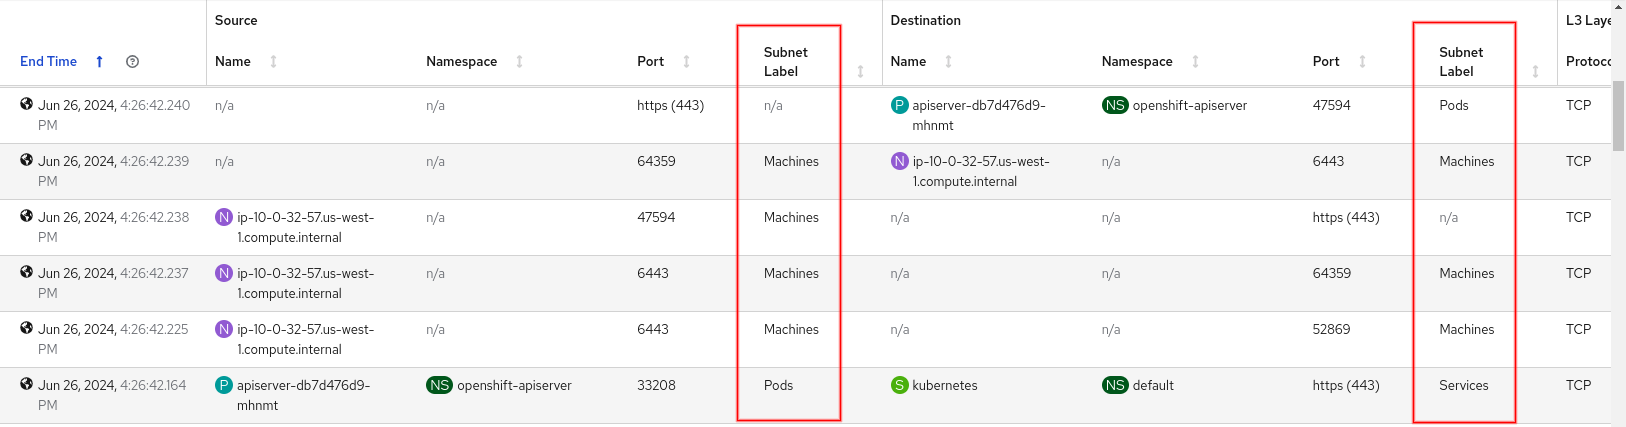
In the Traffic flow table, this is what you see if you add the Subnet Label columns (Figure 9).
Custom metrics
In my Network Observability 1.5 blog, I covered the development preview of the FlowMetrics API. While it's possible to take any flow data labels and turn it into a Prometheus metric, that web page was updated to indicate which fields can be safely used as labels to avoid high cardinality.
This feature is now GA, and includes more filtering options (see reference) and support for dashboards in OpenShift. That link also has many more examples of using custom metrics.
Network Observability CLI
This release has yet another significant technical preview feature called Network Observability CLI (NetObserv CLI). It is a kubectl plug in that effectively installs Network Observability from the command line but is text-based only. When you exit the program, it cleans up and removes itself. In other words, you can now run Network Observability on-demand!
While it reuses much of the Network Observability code, it is separate from the Network Observability Operator. This means even if you have Network Observability running, you can still run the Network Observability CLI independently. For this preview, it only supports nodes running x86_64 architecture.
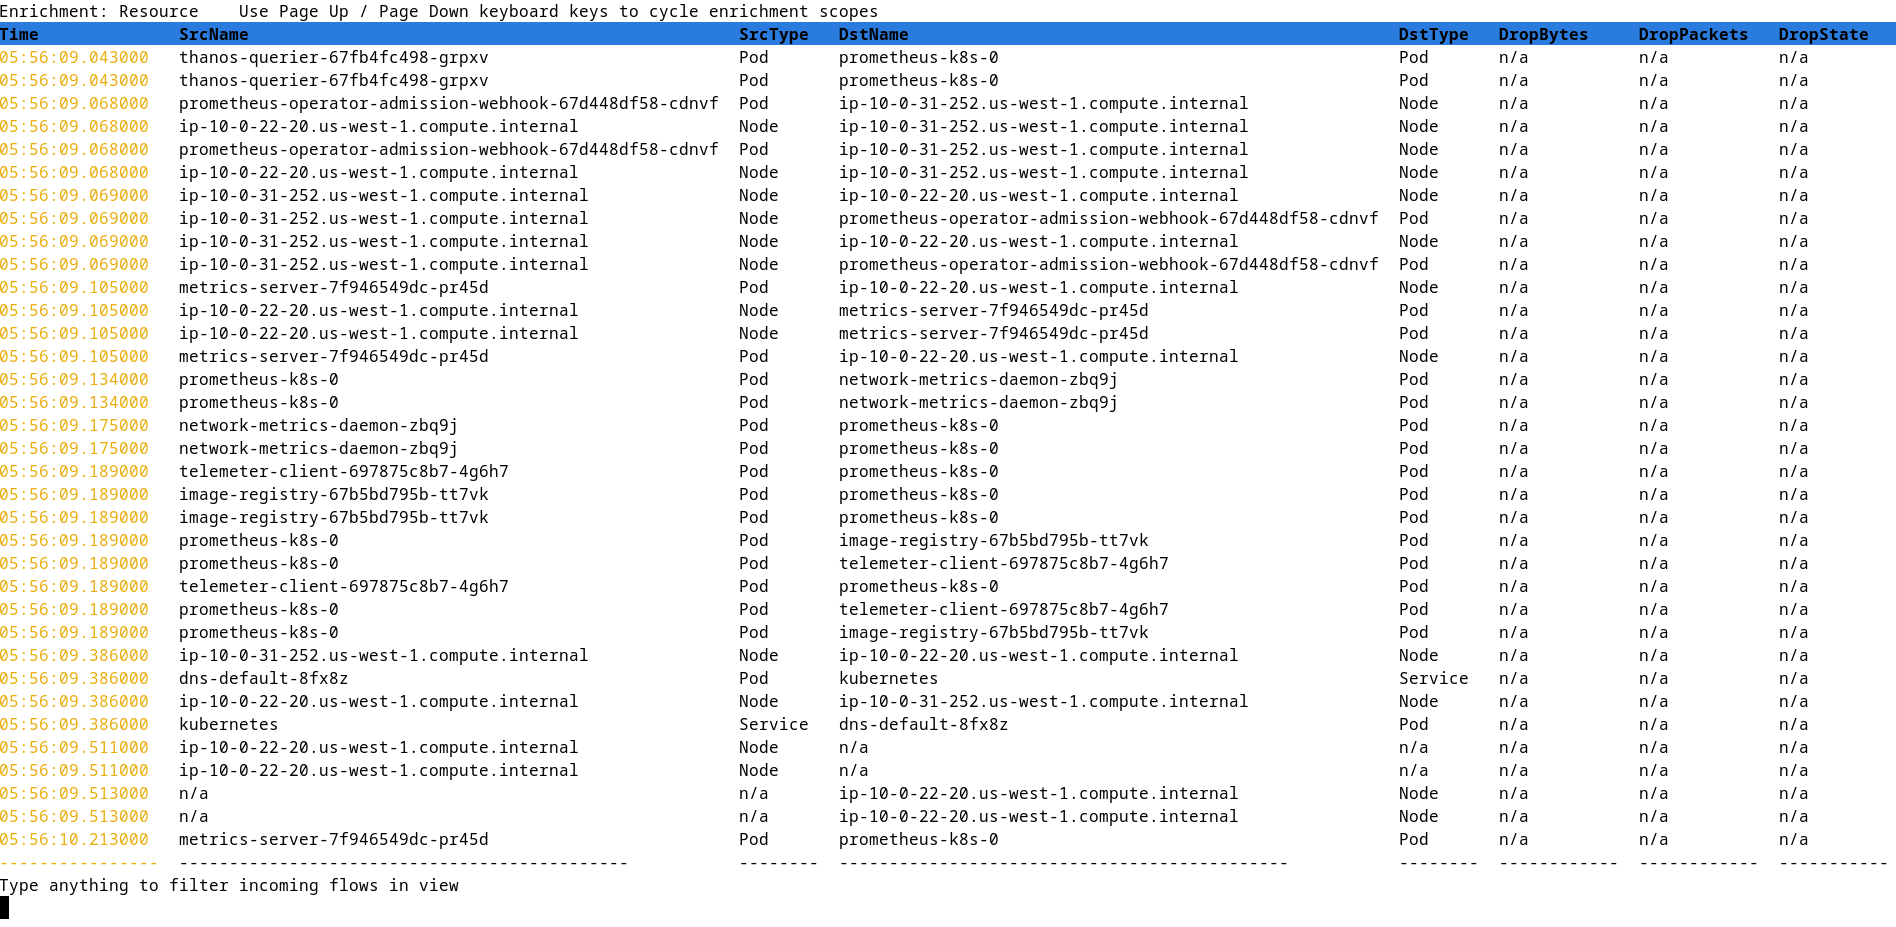
It is also not just a subset of features of the Network Observability Operator. There is an option to capture packets and save them in a PCAP file to be used by a network analysis tool like Wireshark. Here is a sample screenshot of Network Observability CLI that is filtering and displaying traffic on port 443 (Figure 10).
Follow the steps to install the Network Observability CLI.
To get help, enter:
oc netobserv helpFigure 10 was run using:
oc netobserv flows --enable_filter=true --protocol=tcp --port=443To stop the program, press ctrl-C. More information about Network Observability CLI will be provided in a future blog. In the meantime, enjoy!
Closing
If you are hesitant about deploying Network Observability, fear not. With Network Observability CLI, you can experiment and have it completely removed when you are done using it. The second option lets you install Network Observability without Loki, while still providing the majority of the features of this operator.
What are you waiting for? Give it a try, and let us know what you think on the discussion board.
Special thanks to Joel Takvorian, Julien Pinsonneau, and Sara Thomas for providing information for this article.
Last updated: September 10, 2024