The Network Observability Operator is GA (generally available) in Red Hat OpenShift 4.12. You can install it to get metrics about cluster networking, including a network topology graph of all namespaces on that cluster. You can view and monitor the network traffic data in different graphical representations. The Network Observability Operator uses eBPF technology to create the network flows.
Network Observability Operator provides many other metrics and network traffic measurements. You can find more details here.
This article demonstrates how to install and configure the Network Observability Operator on a single node OpenShift (SNO) cluster, based on the Red Hat OpenShift documentation. It includes details on configuring and using Red Hat OpenShift Data Foundation storage external to the SNO as S3 storage.
Note this work does not consider other aspects of single node OpenShift, such as adding workload partitioning or performance tuning.
Prerequisites
To install the Network Observability Operator on SNO, install and configure the following:
- One multi-node cluster with OpenShift Data Foundation installed and configured with Storage: S3 storage enabled. This is required. This article uses the Noobaa S3 object storage Class. It stores LokiStack data and metadata for the long term and is required.
- A second OpenShift cluster: An SNO (or a multi-node OpenShift cluster) where the Network Observability Operator will be installed. This demonstration uses LVMS because I am using SNO. LVMS will offer a storageClass that automatically provides LokiStack with Persistent Volume for storage (Loki pods are using it).
- You installed the
occommand line andjqtools on the computer where you are doing the installation.
Install and configure the Network Observability Operator
Next, follow the procedure provided in the documentation with some possible variations. Please read this section and the next one before installing the Operator:
- I have used a namespace called
openshift-netobservinstead of the suggestednetobservname during the installation. This is not required. It is also important to mention that the namespace/project you choose will impact the name of the privileged namespace/project where eBPF will run. All components in the original namespace (openshift-netobserv, in my case) do not need privileged access to OpenShift nodes. The operator installation process will create a namespace with the original namespace name appended with-privilegedwhere the eBPF daemons will run (they run on each node to collect the data). - My OpenShift Data Foundation cluster has the Noobaa object storage (S3 type), and I am using HTTP to access it because the clusters are in the same network and in a private lab. Also, I have not configured an official SSL certificate for the cluster to use the routes from the external world (SNO in this case).
Configure S3 storage on the OpenShift Data Foundation cluster
Before starting the Loki Stack Operator installation on SNO, configure a bucket claim on OpenShift Data Foundation. I'm using the YAML format, but you can use the OpenShift Data Foundation console to do that (Storage > Object Bucket Claims > Create ObjectBucketClaim). The namespace must be openshift-storage to avoid creating routes to the S3 storage. Apply the following YAML to the OpenShift Data Foundation cluster:
apiVersion: objectbucket.io/v1alpha1

kind: ObjectBucketClaim

metadata:

  name: netobserver-loki-obc

  namespace: openshift-storage

spec:

  generateBucketName: netobserver-loki-obc

  storageClassName: openshift-storage.noobaa.io
Now run oc create -f obc.yaml, where obc.yaml is the file with the above contents. For spec.generateBucketName, use spec.bucketName instead. You will have a constant name instead of a name auto-generated by Kubernetes (OpenShift). However, it is not recommended. Instead, use the generateBucketName. To verify the settings, run the following commands. They will show "bound" below the PHASE header.
$ oc get obc -n openshift-storageNAME STORAGE-CLASS PHASE AGE
netobserver-loki-obc openshift-storage.noobaa.io Bound 40d$ oc get ob -n openshift-storageNAME STORAGE-CLASS CLAIM-NAMESPACE CLAIM-NAME RECLAIM-POLICY PHASE AGE
obc-openshift-storage-netobserver-loki-obc openshift-storage.noobaa.io Delete Bound 40dOnce the obc is created successfully, a secret and ConfigMap (cm) are created with the same name as the obc. They have some important information. Extract that information and use it to configure the lokistack S3 secret.
Begin by running the following commands against the OpenShift Data Foundation cluster.
First, get the bucketName:
$ oc get obc netobserver-loki-obc -n openshift-storage -ojson | jq .spec.bucketName


"netobserver-loki-obc-b98cb0f6-5493-4a46-b4ce-c41f51b07768"
Next, get the access ID and secret of the obc (output scrambled):
$ oc get secret netobserver-loki-obc -n openshift-storage --template='{{index .data "AWS_ACCESS_KEY_ID" | base64decode}}' && echo


RokrXXXXXXXXXXXXXXXX
$ oc get secret netobserver-loki-obc -n openshift-storage --template='{{index .data "AWS_SECRET_ACCESS_KEY" | base64decode}}' && echo
06jFakXCKMkIwj4skLmtYFYKYYYYYYYYYYYYYYYYConfirm the bucketName is the same as the CM (optional):
$ oc get cm netobserver-loki-obc -n openshift-storage -ojson | jq .data.BUCKET_NAMEGet the hint on the route to use as an endpoint in the Loki secret:
$ oc get cm netobserver-loki-obc -n openshift-storage -ojson | jq .data.BUCKET_HOST"s3.openshift-storage.svc"You can see above that s3 is the service name in the openshift-storage namespace/project. Type the following to get the endpoint:
$ oc get routes -n openshift-storage | grep s3

s3      s3-openshift-storage.apps.my.example.org            s3    s3-https     reencrypt/Allow      None
Another way to get it is by checking the S3 server's external DNS:
$ oc get noobaa noobaa -ojson -n openshift-storage | jq .status.services.serviceS3.externalDNS[
"https://s3-openshift-storage.apps.my.example.org"
]Using the above information, populate the secret the Loki Stack will use. Be sure that the endpoint is reachable and can be looked up by DNS from your cluster (SNO, in this case) where you install Network Observability Operator.
[ core@sno1 ] # curl http://s3-openshift-storage.apps.my.example.org

...

output here without errors.
Now, create a file called loki-stack-secret with the following:
$ cat lokistack-netobserv-s3-secret.yaml

apiVersion: v1

kind: Namespace

metadata:

  name: openshift-netobserv

---

apiVersion: v1

kind: Secret

metadata:

  name: loki-s3-netobserv

  namespace: openshift-netobserv

stringData:

  access_key_id: RokrXXXXXXXXXXXXXXXX

  access_key_secret: 06jFakXCKMkIwj4skLmtYFYKYYYYYYYYYYYYYYYY

  bucketnames: netobserver-loki-obc-b98cb0f6-5493-4a46-b4ce-c41f51b07768

  endpoint: http://s3.openshift-storage.apps.my.example.org
Create those two resources (namespace and secret) on the SNO by running this command:
$ oc create -f lokistack-netobserv-s3-secret.yamlInstall the Loki Operator on SNO
Once that is done successfully, proceed with installing the Loki operator, which is a prerequisite to installing the Network Observability Operator, using these steps in the OpenShift documentation.
When creating the secret in step 2.c, use the above file/YAML. Note that the namespace must have the correct name. You will usually use the default netobserv, but you can use another name. I used openshift-netobserv in this demonstration. You must be careful to change this everywhere.
Use this command to verify the installation:
$ oc get csv -n openshift-netobservNAME DISPLAY VERSION REPLACES PHASE
loki-operator.v5.7.3 Loki Operator 5.7.3 loki-operator.v5.7.2 SucceededWhen you create the lokiStack Resource, you can follow this YAML. It adds retention rules so you do not overfill the S3 storage. Queries settings are also defined. Here is the file:
apiVersion: loki.grafana.com/v1

kind: LokiStack

metadata:

  name: lokistack-netobserv

  namespace: openshift-netobserv

spec:

  limits:

    global:

      ingestion:

        ingestionBurstSize: 40

        ingestionRate: 20

        maxGlobalStreamsPerTenant: 25000

      queries:

        maxChunksPerQuery: 2000000

        maxEntriesLimitPerQuery: 10000

        maxQuerySeries: 3000

        queryTimeout: 3m

      retention: ## retention rules

        days: 20

        streams:

        - days: 15

          priority: 1

          selector: '{log_type="audit"}'

        - days: 15

          priority: 1

          selector: '{log_type="infrastructure"}'

  managementState: Managed

  replicationFactor: 1

  rules:

    enabled: true

    namespaceSelector:

      matchLabels:

        openshift.io/cluster-monitoring: "true"

    selector:

      matchLabels:

        openshift.io/cluster-monitoring: "true"

  size: 1x.extra-small  ## sizing

  storage:

    schemas:

    - effectiveDate: "2022-06-01"

      version: v12

    secret:

      name: loki-s3-netobserv

      type: s3

  storageClassName: lvms-vg1 ## storageClass for loki PODs to allocate PVCs

  tenants:

    mode: openshift-network
There are three aspects of the above YAML worth mentioning:
spec.limits.retentionis configured based on this document. Extra configurations are in the same document. The retention configuration is highly recommended because S3 Storage on OpenShift Data Foundation (or the S3 storage infrastructure of your choice) can fill very quickly.metadata.namespacename is as I have created it and not the defaultopenshift-netobserv.storageClassNameis the local Storage Class name on the SNO and must be a StorageClass that can offer file/block storage in RWO mode. It cannot be a storage class on the remote OpenShift Data Foundation or any other storage infrastructure.
Next, create the RBAC rules according to the documentation. I have created only one clusterRole and clusterRolebinding file that combines both for my installation. Otherwise, you may see an error similar to the following:
$ oc logs -f flowlogs-pipeline-mmqmqtime=2023-05-04T02:07:40Z level=info component=client error=server returned HTTP status 403 Forbidden (403): fields.level=error fields.msg=final error sending batch host=loki-gateway-http.netobserv.svc:8080 module=export/loki status=403Here is the YAML content of the cluster role and role binding used for this installation. This is required in Network Observability Operator version 1.4 and earlier. In Network Observability Operator version 1.5 and up, this is automatic.
---

apiVersion: rbac.authorization.k8s.io/v1

kind: ClusterRole

metadata:

  name: loki-netobserv-tenant

rules:

- apiGroups:

  - loki.grafana.com

  resourceNames:

  - logs

  resources:

  - network

  verbs:

  - get

  - create

---

apiVersion: rbac.authorization.k8s.io/v1

kind: ClusterRoleBinding

metadata:

  name: loki-netobserv-tenant

roleRef:

  apiGroup: rbac.authorization.k8s.io

  kind: ClusterRole

  name: loki-netobserv-tenant

subjects:

- kind: ServiceAccount

  name: flowlogs-pipeline

  namespace: openshift-netobserv
Loki Stack takes some time to start, especially the ingester pod, which reads all the cluster logs. Do your checks by running these commands:
$ oc get lokistack lokistack-netobserv -n openshift-netobserv -ojson | jq .status$ oc get pods -n openshift-netobserv$ oc get pvc -n openshift-netobservThe output:
{

  "components": {

    "compactor": {

      "Running": [

        "lokistack-openshift-netobserv-compactor-0"

      ]

    },

    "distributor": {

      "Running": [

        "lokistack-openshift-netobserv-distributor-7874976985-s7zww"

      ]

    },

    "gateway": {

      "Running": [

        "lokistack-openshift-netobserv-gateway-85dfd466-gw67g",

        "lokistack-openshift-netobserv-gateway-85dfd466-nhmrl"

      ]

    },

    "indexGateway": {

      "Running": [

        "lokistack-openshift-netobserv-index-gateway-0"

      ]

    },

    "ingester": {

      "Running": [

        "lokistack-openshift-netobserv-ingester-0"

      ]

    },

    "querier": {

      "Running": [

        "lokistack-openshift-netobserv-querier-9598dc96f-hf4kk"

      ]

    },

    "queryFrontend": {

      "Running": [

        "lokistack-openshift-netobserv-query-frontend-86d95f77b6-klmm4"

      ]

    },

    "ruler": {

      "Running": [

        "lokistack-openshift-netobserv-ruler-0"

      ]

    }

  },

  "conditions": [

    {

      "lastTransitionTime": "2023-07-27T13:11:42Z",

      "message": "Some LokiStack components pending on dependencies",

      "reason": "PendingComponents",

      "status": "False",

      "type": "Pending"

    },

    {

      "lastTransitionTime": "2023-07-27T13:11:42Z",

      "message": "All components ready",

      "reason": "ReadyComponents",

      "status": "True",

      "type": "Ready"

    }

  ],

  "storage": {

    "schemas": [

      {

        "effectiveDate": "2022-06-01",

        "version": "v12"

      }

    ]

  }

}

------

NAME                                                            READY   STATUS    RESTARTS   AGE

flowlogs-pipeline-bdf69                                         1/1     Running   0          6d1h

lokistack-openshift-netobserv-compactor-0                       1/1     Running   0          26h

lokistack-openshift-netobserv-distributor-7874976985-s7zww      1/1     Running   0          26h

lokistack-openshift-netobserv-gateway-85dfd466-gw67g            2/2     Running   0          6d

lokistack-openshift-netobserv-index-gateway-0                   1/1     Running   0          26h

lokistack-openshift-netobserv-ingester-0                        1/1     Running   0          26h

lokistack-openshift-netobserv-querier-9598dc96f-hf4kk           1/1     Running   0          26h

lokistack-openshift-netobserv-query-frontend-86d95f77b6-klmm4   1/1     Running   0          26h

lokistack-openshift-netobserv-ruler-0                           1/1     Running   0          26h

openshift-netobserv-plugin-6cc8798bcb-kfgsx                     1/1     Running   1          6d17h


------

NAME                                                    STATUS   VOLUME                                     CAPACITY   ACCESS MODES   STORAGECLASS   AGE

storage-lokistack-openshift-netobserv-compactor-0       Bound    pvc-8b5f58d1-5ae7-476b-97a5-0a331e6dea22   10Gi       RWO            lvms-vg1       6d18h

storage-lokistack-openshift-netobserv-index-gateway-0   Bound    pvc-783fe7e3-6492-4265-8dbe-677dee0c525d   10Gi       RWO            lvms-vg1       6d18h

storage-lokistack-openshift-netobserv-ingester-0        Bound    pvc-2128ced2-bb00-4938-8dd4-fb3c0970dd8a   10Gi       RWO            lvms-vg1       6d18h

storage-lokistack-openshift-netobserv-ruler-0           Bound    pvc-b3e0fc85-6c48-41d1-be37-4dcfa0788030   10Gi       RWO            lvms-vg1       6d18h

wal-lokistack-openshift-netobserv-ingester-0            Bound    pvc-5c79e00d-d356-42a7-89fd-6d20135d9d93   10Gi       RWO            lvms-vg1       6d18h

wal-lokistack-openshift-netobserv-ruler-0               Bound    pvc-0e108024-b3dd-47c3-b877-cb8d98177e43   10Gi       RWO            lvms-vg1       6d18h
Install the Network Observability Operator
Next, install the Network Observability Operator itself. Follow the installation documentation. You can also install using the YAML files below by creating the OperatorGroup and the subscription objects in the namespace openshift-netobserv-operator.
---

apiVersion: v1

kind: Namespace

metadata:

  labels:

    openshift.io/cluster-monitoring: "true"

  name: openshift-netobserv-operator

---

apiVersion: operators.coreos.com/v1

kind: OperatorGroup

metadata:

  name: openshift-netobserv-operator

  namespace: openshift-netobserv-operator

spec:

  upgradeStrategy: Default


---

apiVersion: operators.coreos.com/v1alpha1

kind: Subscription

metadata:

  name: netobserv-operator

  namespace: openshift-netobserv-operator

spec:

  channel: stable

  installPlanApproval: Automatic #you can set this to manual if you want to control versions upgrade manually

  name: netobserv-operator

  source: redhat-operators

  sourceNamespace: openshift-marketplace
Check it by running this command:
$ oc get csv -n openshift-netobserv-operatorNAME DISPLAY VERSION REPLACES PHASE
loki-operator.v5.7.3 Loki Operator 5.7.3 loki-operator.v5.7.2 Succeeded
network-observability-operator.v1.3.0 Network Observability 1.3.0 network-observability-operator.v1.2.0 SucceededCreate the flow collector
The important part of the configuration is correctly creating the flow collector (step 4 from here). Use the YAML file from the GitHub repo 201 create flow collector. (You can find all the objects used in the installation here). The different settings are explained inline in that file and are custom to this installation (since the namespace where Loki is installed is openshift-netobserv and not netobserv).
The configuration of this Flow Collector contains the definition of quick filter, which will be applied by default when opening the console plugin Observer -> Network Traffic from the OpenShift console. These are not required and are provided as an example.
The parameter spec.processor.metrics.ignoreTags is set here to ignore metrics coming for the netobserv EBPF sources. This reduces the load on the SNO. Otherwise, you can remove them and view various interesting metrics in the Observe → Dashboard → NetObserv (Drop Down) section.
Info alert: Note
The API version v1beta1 of the FlowCollector object is as of Network Observability Operator version 1.3, and this can change in the coming versions of the operator. A newer version of FlowCollector CRD (v1beta2) will simplify this and is available with Network Observability Operator 1.5 and later.
apiVersion: flows.netobserv.io/v1beta1

kind: FlowCollector

metadata:

  name: cluster

spec:

  agent:

    ebpf:

     ...... # refer to the git repo please

    type: EBPF ## EBPF or ipfix

  consolePlugin:

    logLevel: info

    port: 9001

    .... # refer to the git repo please

    quickFilters:

    - default: true

      filter:

        dst_namespace!: openshift-,openshift-netobserv  ## openshift-netobserv: this is how you named the namespace when you installed loki

        src_namespace!: openshift-,openshift-netobserv  ## same

      name: Applications

    - filter:

        dst_namespace: openshift-,openshift-netobserv ## openshift-netobserv: this is how you named the namespace when you installed loki

        src_namespace: openshift-,openshift-netobserv ## same

      name: Infrastructure

    - default: true

      filter:

        dst_kind: Pod

        src_kind: Pod

      name: Pods network

    - filter:

        dst_kind: Service

      name: Services network

    register: true

    replicas: 1

    ...... # refer to the git repo please

  deploymentModel: DIRECT

  loki:

    authToken: FORWARD

    ...... # refer to the git repo please

    statusTls:

      caCert:

        certFile: service-ca.crt

        name: lokistack-netobserv-ca-bundle  ##  lokistack-netobserv (preceeding -ca-bundle) is the name of the lokiStack CRD.

        namespace: ""

        type: configmap

      enable: false

      insecureSkipVerify: false

      userCert:

        certFile: tls.crt

        certKey: tls.key

        name: lokistack-netobserv-query-frontend-http ##  lokistack-netobserv (preceeding -query ) is the name of the lokiStack CRD.

        namespace: ""

        type: secret

    statusUrl: https://lokistack-netobserv-query-frontend-http.openshift-netobserv.svc:3100/  ## in this url lokistack-netobserv (preceeding -query) is the name of the lokiStack CRD. openshift-netobserv (succeeding http. ) is the namespace of Loki installation

    tenantID: network

    timeout: 10s

    tls:

      caCert:

        certFile: service-ca.crt

        name: lokistack-netobserv-gateway-ca-bundle  ##  lokistack-netobserv (preceeding -gateway ) is the name of the lokiStack CRD.

        namespace: ""

        type: configmap

      enable: true

      insecureSkipVerify: false

      userCert:

        namespace: ""

    url: https://lokistack-netobserv-gateway-http.openshift-netobserv.svc:8080/api/logs/v1/network  ## in this url lokistack-netobserv (preceeding -gateway) is the name of the lokiStack CRD. openshift-netobserv (succeeding http. ) is the namespace of Loki installation

  namespace: openshift-netobserv

  processor:

    ...... # refer to the git repo please

    logLevel: info

    logTypes: FLOWS

    metrics:

      ignoreTags:

      - flows

      - bytes

      - packets

    port: 2055

    profilePort: 6060

    resources:

      limits:

        memory: 800Mi

      requests:

        cpu: 100m

        memory: 100Mi
More Network Observability Operator capabilities have been added to v1.4 after I ran this test. You can find them here.
Confirm the FlowCollector shows ready with this command:
$ oc get FlowCollector cluster

NAME      AGENT   SAMPLING (EBPF)   DEPLOYMENT MODEL   STATUS

cluster   EBPF    50                DIRECT             Ready
You also confirm the eBPF agent exists in the privileged namespace (there is one agent pod per node) with this command:
$ oc get pods -n openshift-netobserv-privileged

NAME                                   READY   STATUS    RESTARTS   AGE

openshift-netobserv-ebpf-agent-c4nm6   1/1     Running   2          6d18h
The logs from the eBPF agent look like the following output:
$ oc -n openshift-netobserv-privileged logs openshift-netobserv-ebpf-agent-c4nm6 --follow

time="2023-07-21T13:57:17Z" level=info msg="starting NetObserv eBPF Agent"

time="2023-07-21T13:57:17Z" level=info msg="initializing Flows agent" component=agent.Flows

time="2023-07-21T13:57:18Z" level=info msg="push CTRL+C or send SIGTERM to interrupt execution"

time="2023-07-21T13:57:18Z" level=info msg="starting Flows agent" component=agent.Flows

time="2023-07-21T13:57:18Z" level=info msg="Flows agent successfully started" component=agent.Flows

time="2023-07-21T13:57:18Z" level=info msg="interface detected. Registering flow ebpfFetcher" component=agent.Flows interface="{ens192 2}"

time="2023-07-21T13:57:19Z" level=info msg="interface detected. Registering flow ebpfFetcher" component=agent.Flows interface="{ens224 3}"

time="2023-07-21T13:57:19Z" level=info msg="interface detected. Registering flow ebpfFetcher" component=agent.Flows interface="{ovs-system 4}"

time="2023-07-21T13:57:19Z" level=info msg="interface detected. Registering flow ebpfFetcher" component=agent.Flows interface="{br-int 5}"

time="2023-07-21T13:57:19Z" level=info msg="interface detected. Registering flow ebpfFetcher" component=agent.Flows interface="{ovn-k8s-mp0 6}"

time="2023-07-21T13:57:19Z" level=info msg="interface detected. Registering flow ebpfFetcher" component=agent.Flows interface="{genev_sys_6081 7}"

time="2023-07-21T13:57:19Z" level=info msg="interface detected. Registering flow ebpfFetcher" component=agent.Flows interface="{br-ex 8}"

time="2023-07-21T13:57:42Z" level=info msg="interface detected. Registering flow ebpfFetcher" component=agent.Flows interface="{ff6b591c4708062 9}"

time="2023-07-21T13:57:42Z" level=info msg="interface detected. Registering flow ebpfFetcher" component=agent.Flows interface="{d0a707fc3a7a624 10}"

time="2023-07-21T13:57:42Z" level=info msg="interface detected. Registering flow ebpfFetcher" component=agent.Flows interface="{3984acb1525df97 11}"

time="2023-07-21T13:57:42Z" level=info msg="interface detected. Registering flow ebpfFetcher" component=agent.Flows interface="{5177e649df121a7 12}"

time="2023-07-21T13:57:42Z" level=info msg="interface detected. Registering flow ebpfFetcher" component=agent.Flows interface="{778957ccf671299 13}"
Check the final result on the console
This is a lab test SNO cluster, so a console is available for these checks. In a production environment, you will probably disable the console and not see this information. Instead, you can forward it to another system, such as Prometheus or Splunk, using the Kafka forwarder described in the documentation. Here is what the OpenShift console shows.
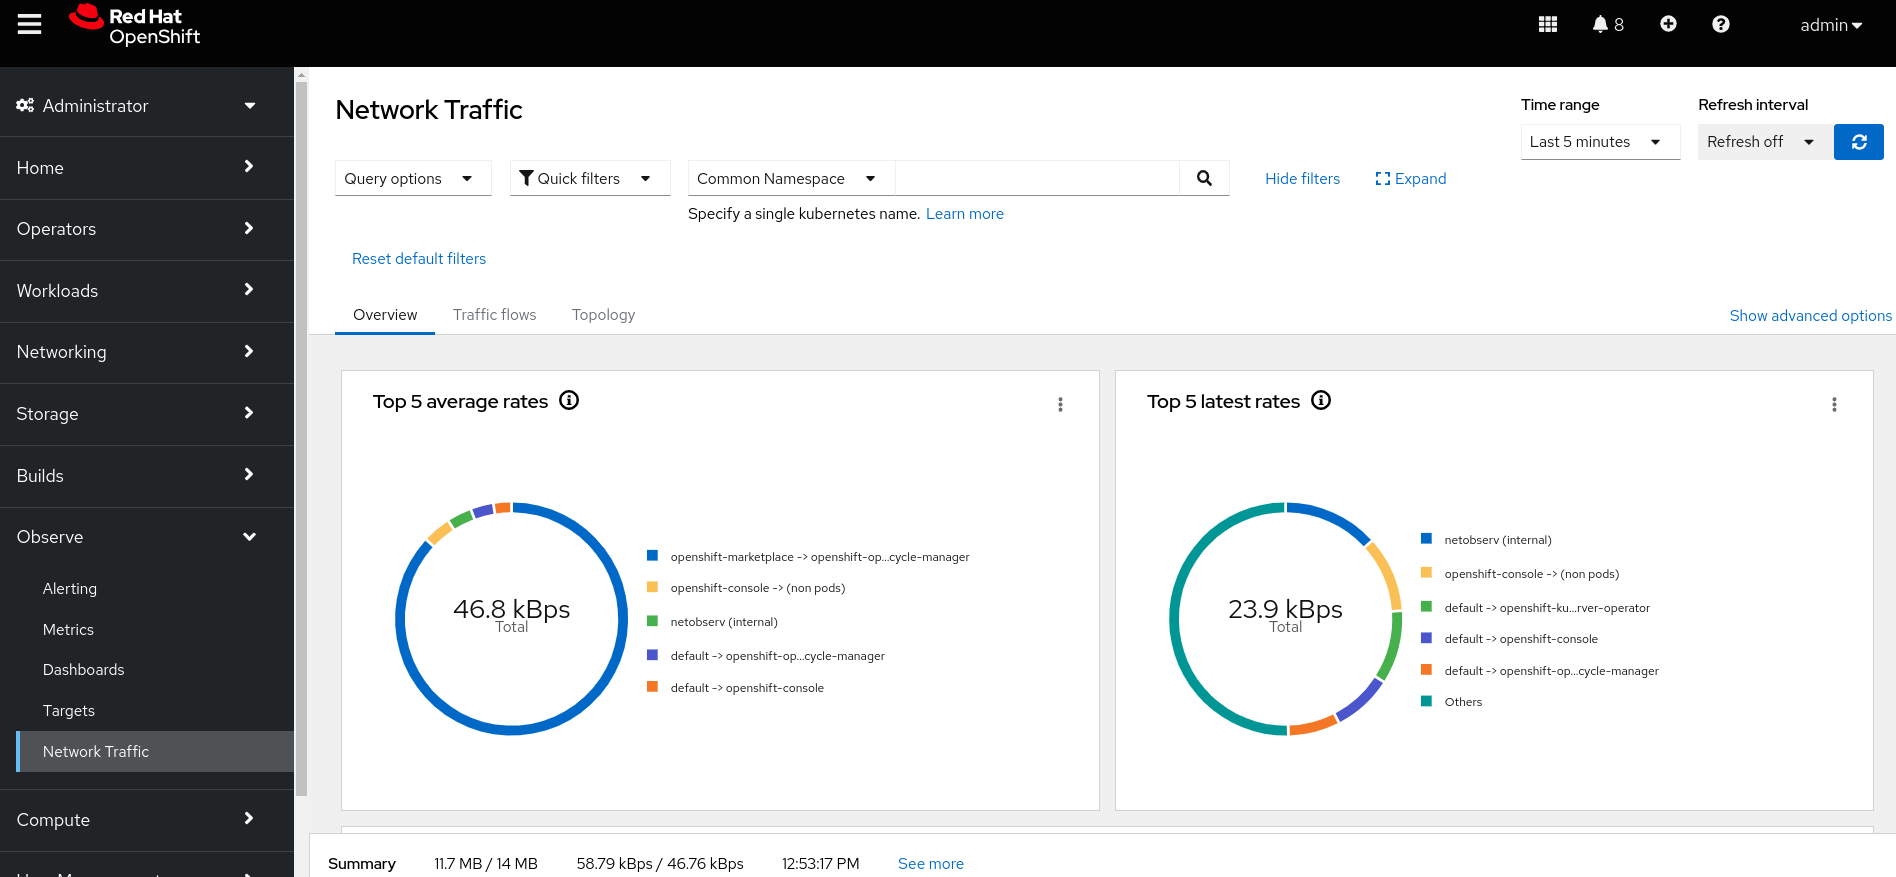
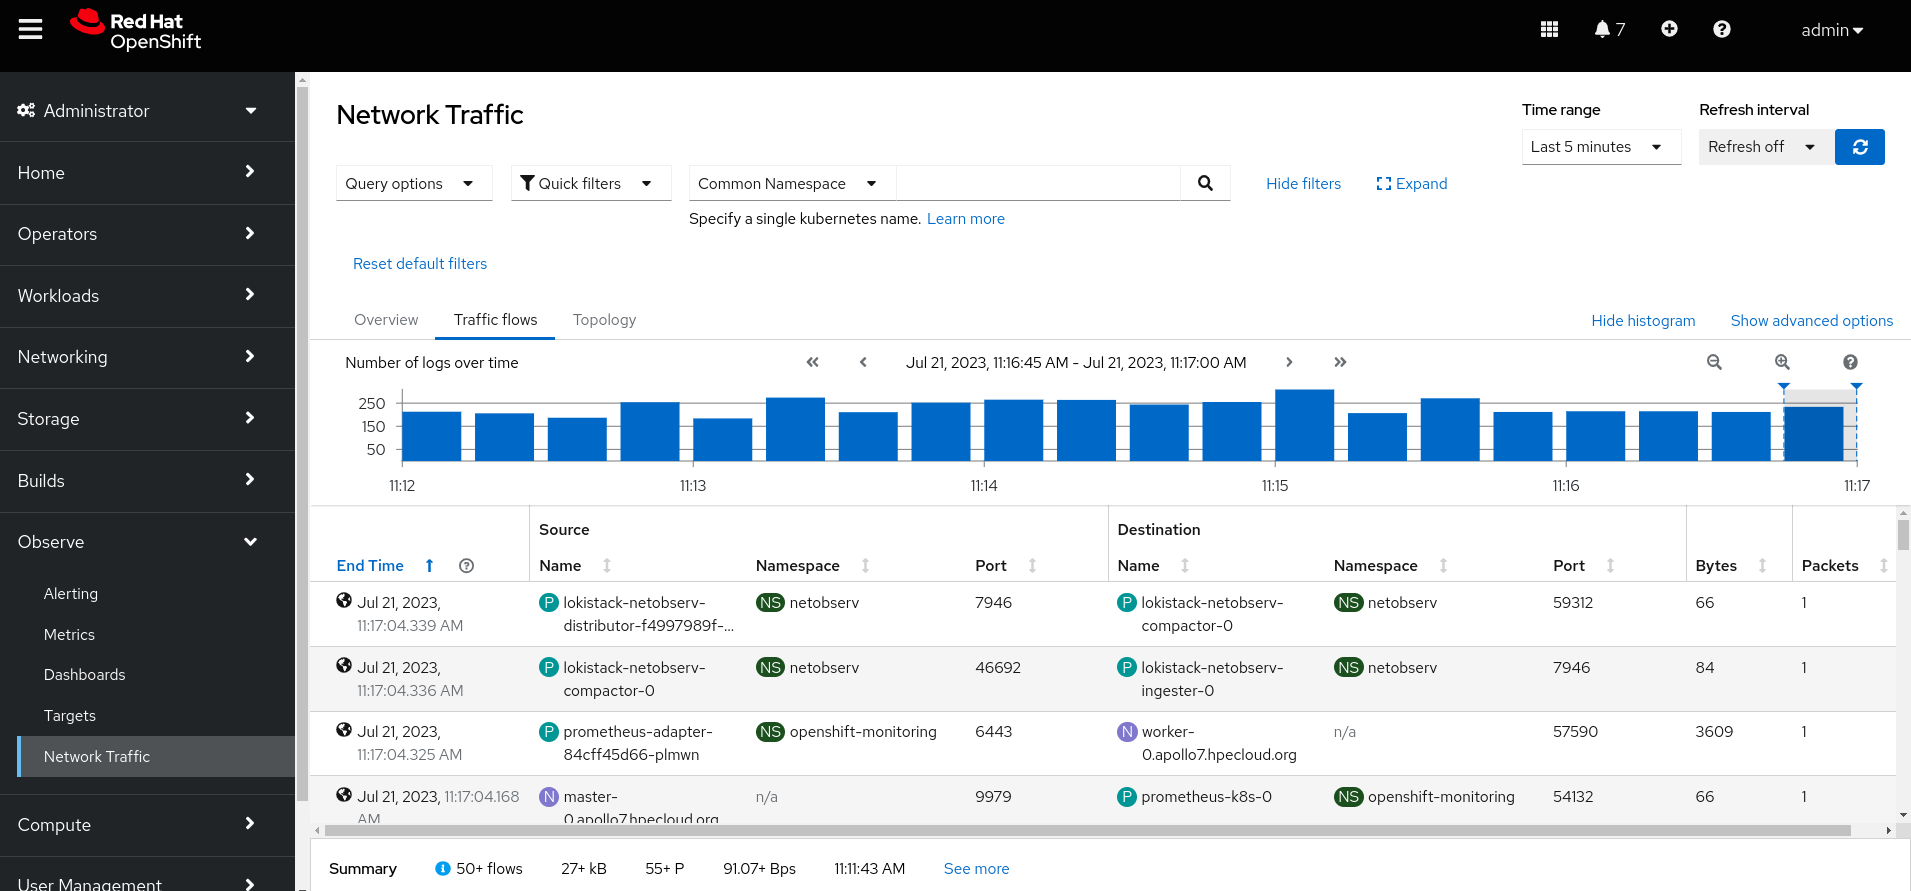
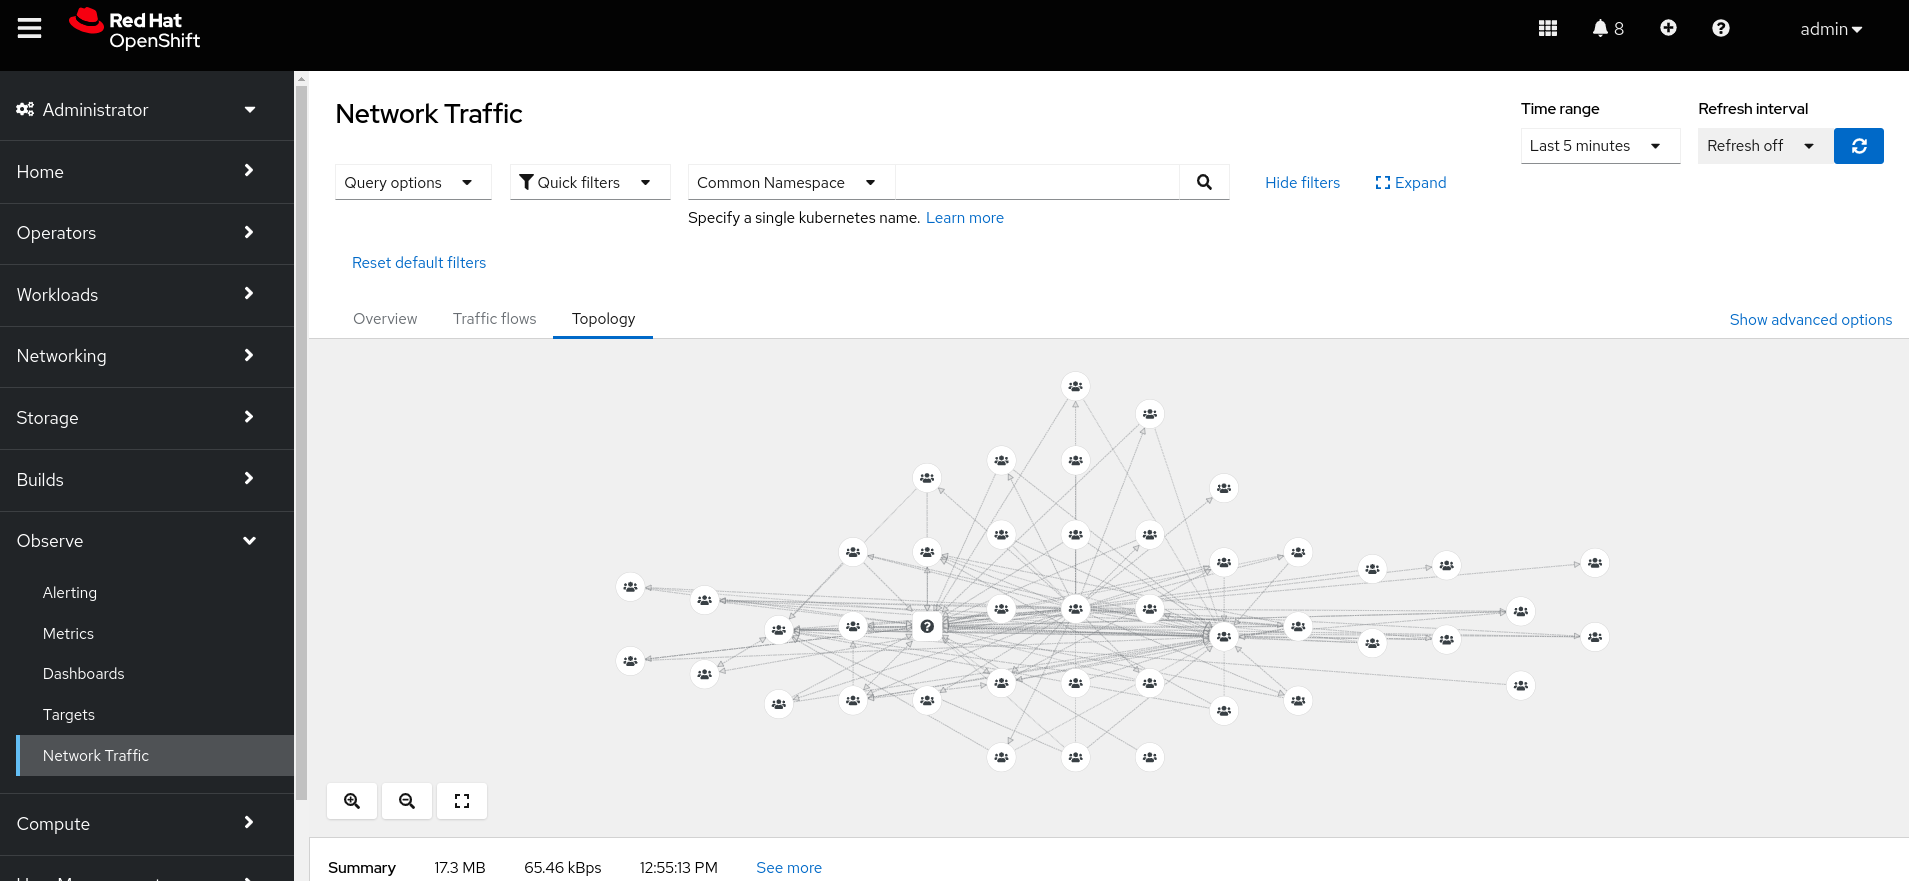
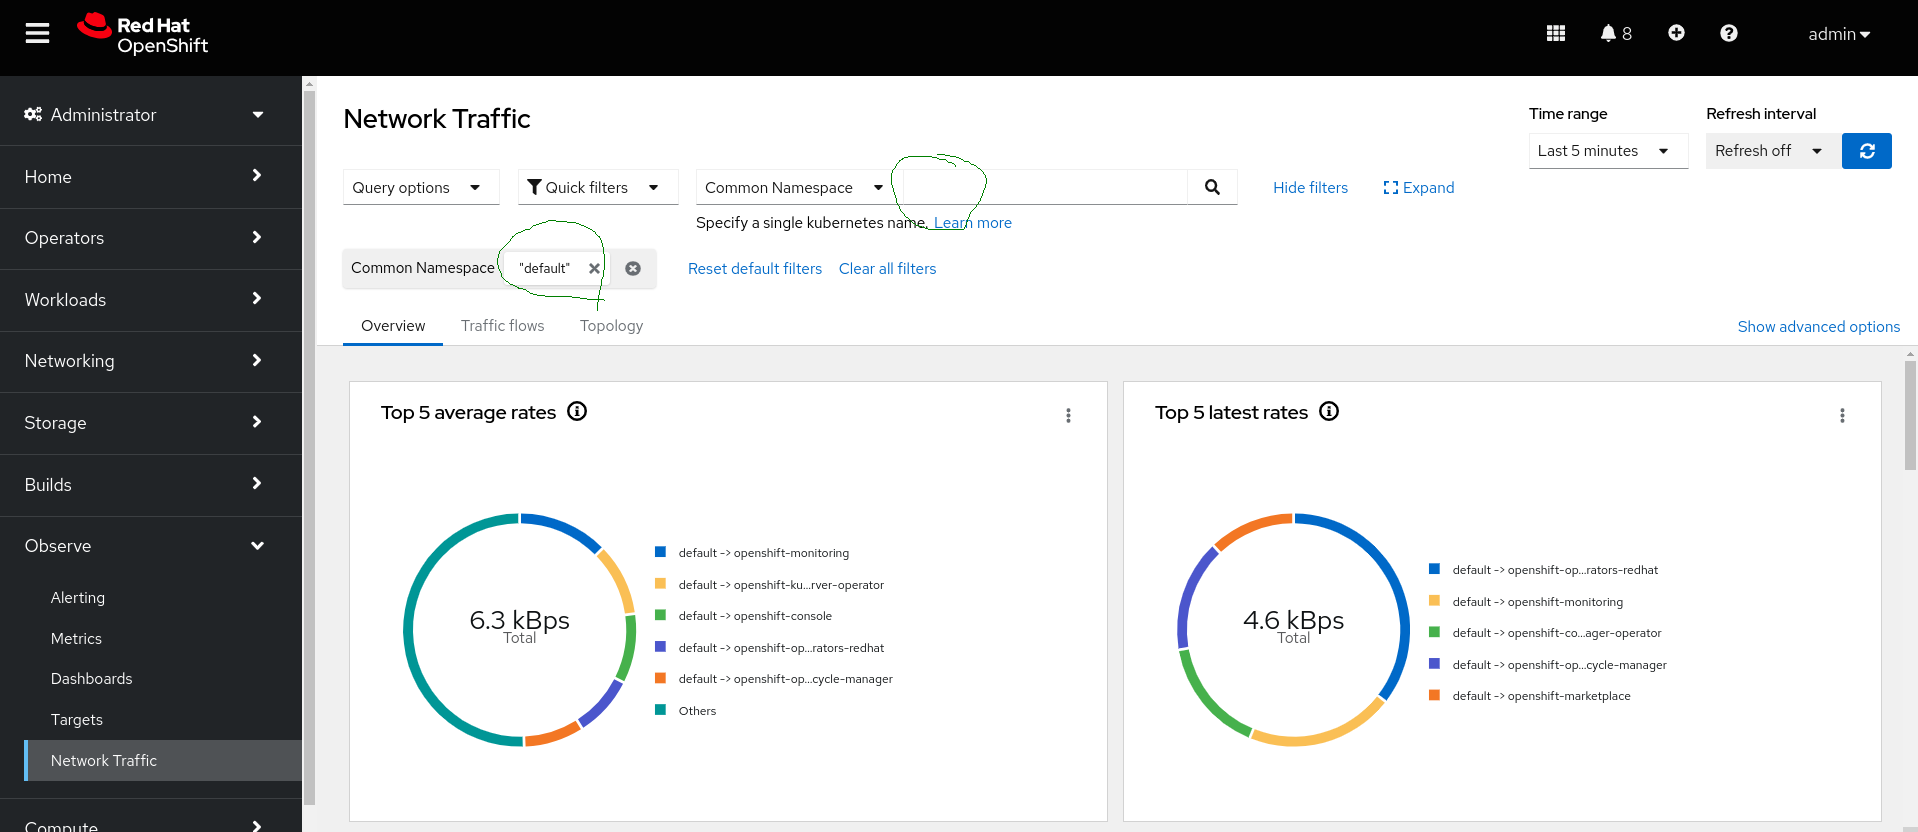
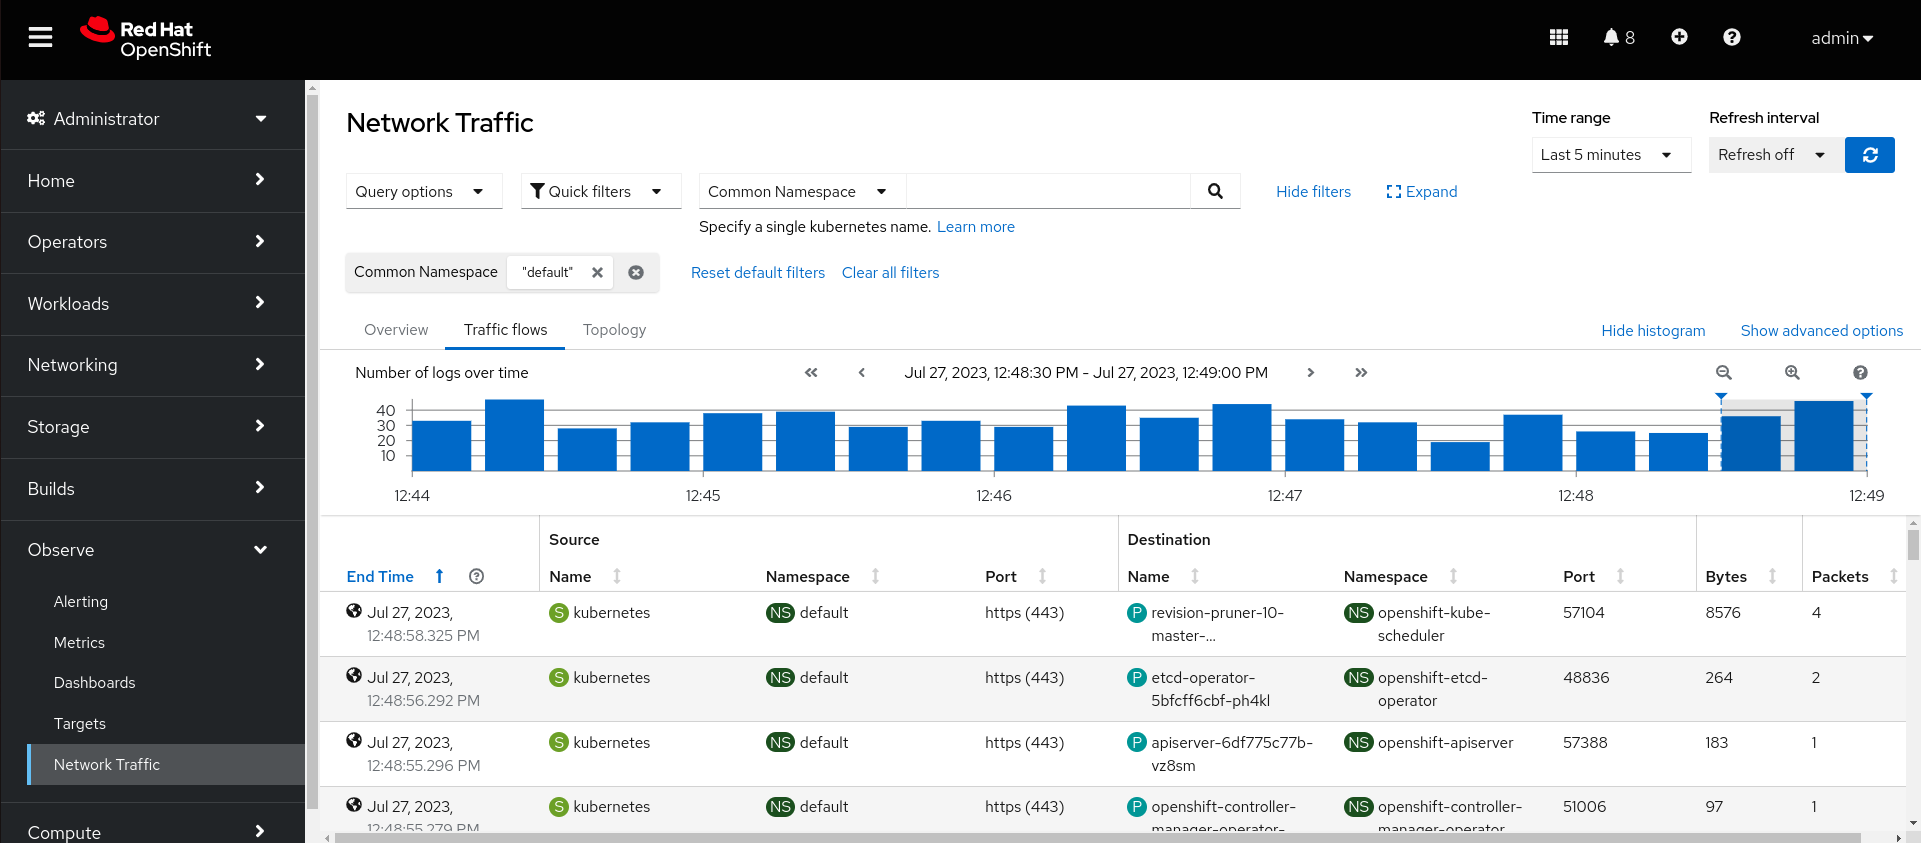
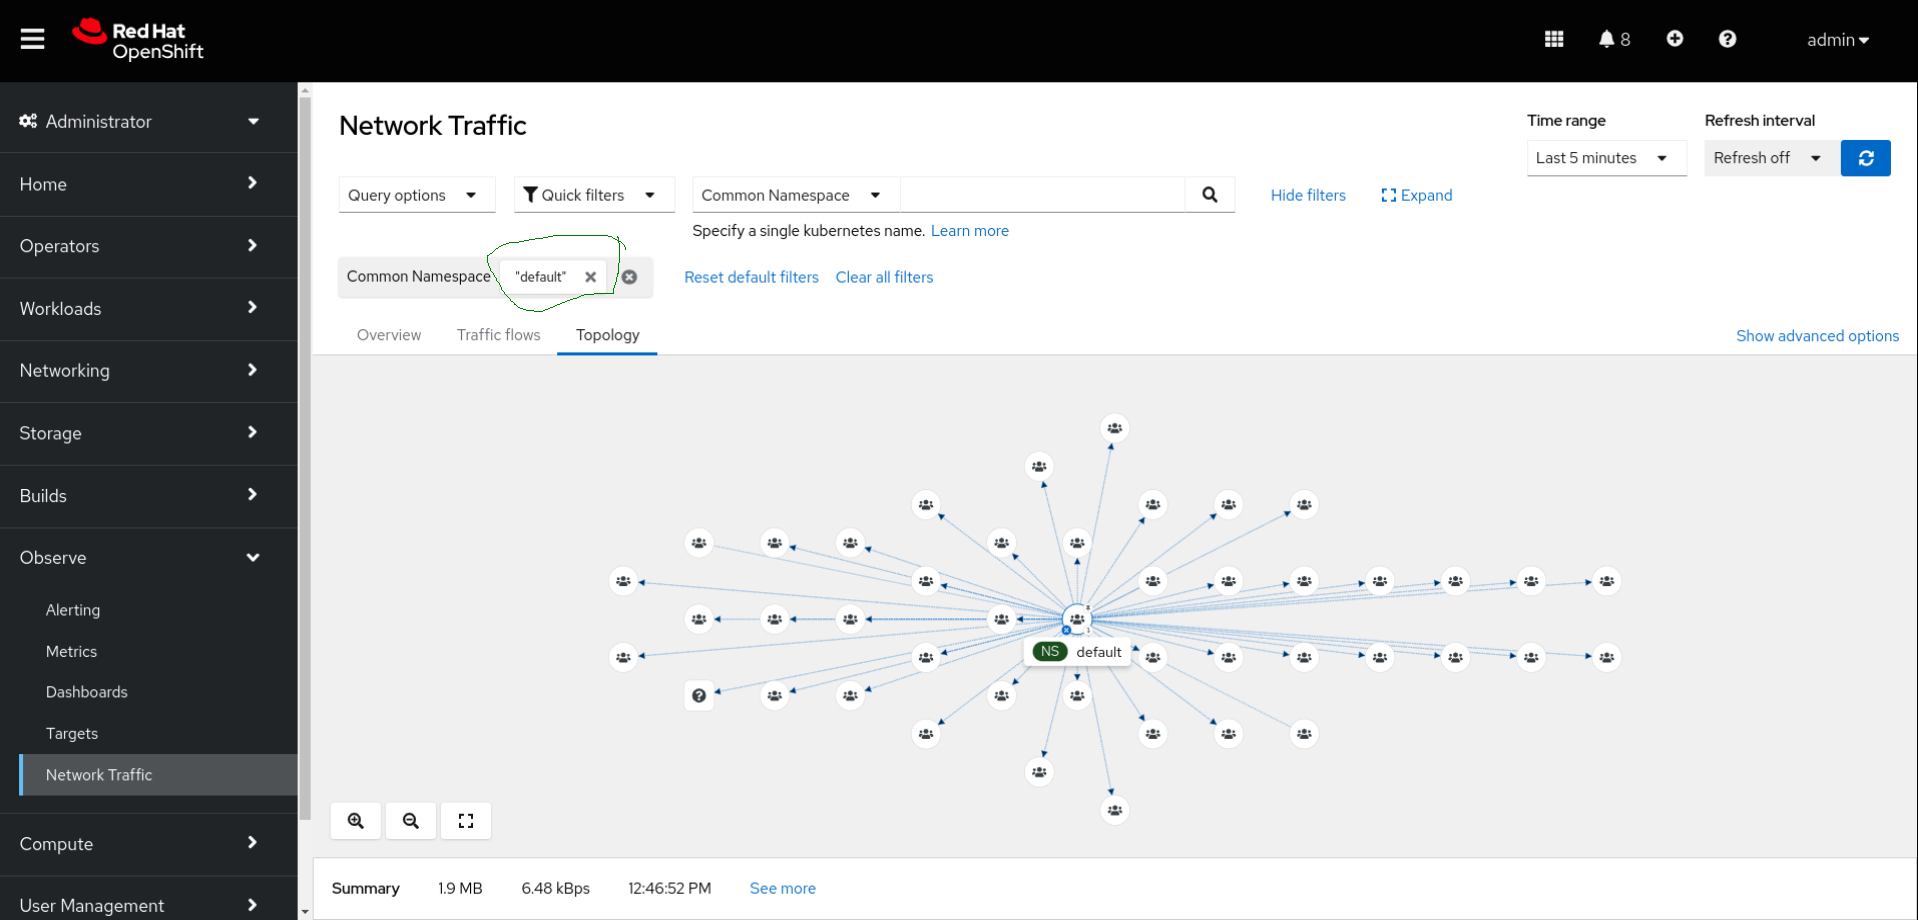
Click on console Observe --> Network traffic. There are three tabs: Overview, Traffic Flows, and Topology.
- Filters control what the three tabs display.
- The Overview tab shows the top five traffic producers (modify this in the query options drop down on the top left corner of the GUI).
- The Traffic Flows tab displays the flow traffic in histogram and table formats.
- The Topology tab shows the connectivity between all nodes/namespaces/owners/resources.
Be aware that since I defined filters in FlowCollector spec.consolePlugin.quickFilters and set the default filter to the named application (the traffic coming from any namespace except the ones named with openshift-xxxxx), those filters will be applied when opening the Network Observability Operator console dashboard. They can be unapplied from the same place in the UI.
Figures 1-6 display each tab after completing the installation above.
Wrap-up
The Network Observability Operator offers a great way of monitoring network traffic on the cluster. In addition, the eBPF is a fast and reliable tool running on the Linux kernel. This article is based on a lab SNO. Many other scenarios have not been considered, such as workload partitioning, data transfer limitation for edge networks, etc. Use it as a foundation to test scenarios, such as transferring metrics/logs to a remote system using Kafka forwarder, etc. The primary purpose is to show by example how to install and configure the Network Observability Operator, especially using the S3 object storage from OpenShift Data Foundation.
Acknowledgments
Acknowledgements to my colleagues for reviewing and approving this publication:
- Javier Pena
- Logan McNaughton
- Joel Takvorian
- Julien Pinsonneau
- Dave Gordon