In this article, we will cover how to install and configure the Postgres Exporter, which is responsible for collecting data and usage statistics for PostgreSQL. This article is intended for sysadmins or database administrators who need to monitor PostgreSQL and identify areas for performance or availability improvement.
This example uses the following versions:
- Red Hat Ansible Automation Platform v4.5.7
- PostgreSQL Server 13.14-1
- Red Hat Enterprise Linux 9.4
- Prometheus v2.53
- Grafana v11.1.0
- Postgres Exporter v0.15.0
Note
Installation of the Ansible Automation Platform and PostgreSQL will not be covered in this article.
About the example
We will use two servers: the first server will be the Ansible Automation Platform with an "all-in-one" installation, and the second will be our monitoring server.
For a complete guide on how to install and configure Prometheus and Grafana, refer to the article Monitor Ansible Automation Platform using Prometheus, Node Exporter, and Grafana.
Procedure
Let's begin the installation.
Postgres Exporter
Note
Perform the following steps on the Ansible Automation Platform database server.
Let's download and install the latest version of Postgres Exporter:
cd /opt/
curl -LO https://github.com/prometheus-community/postgres_exporter/releases/download/v0.15.0/postgres_exporter-0.15.0.linux-amd64.tar.gz
Here we will unzip and rename our directory for ease of use:
tar -xvf postgres_exporter-0.15.0.linux-amd64.tar.gz
mv -v postgres_exporter-0.15.0.linux-amd64 postgres_exporter
Let's create the postgres_exporter user. Create the main directories and set the Prometheus user as owner:
useradd -s /sbin/nologin --system postgres_exporter
groupadd --system postgres_exporter
id postgres_exporter
cp -v ~/postgres_exporter/postgres_exporter /usr/local/bin/
chown postgres_exporter:postgres_exporter /usr/local/bin/postgres_exporter
To collect metrics using a non-superuser user, let's create and execute this function directly in PostgreSQL:
cat <<EOF > /opt/postgres_exporter/postgres_exporter.sql
-- To use IF statements, hence to be able to check if the user exists before
-- attempting creation, we need to switch to procedural SQL (PL/pgSQL)
-- instead of standard SQL.
-- More: https://www.postgresql.org/docs/9.3/plpgsql-overview.html
-- To preserve compatibility with <9.0, DO blocks are not used; instead,
-- a function is created and dropped.
CREATE OR REPLACE FUNCTION __tmp_create_user() returns void as $$
BEGIN
  IF NOT EXISTS (
          SELECT                       -- SELECT list can stay empty for this
          FROM   pg_catalog.pg_user
          WHERE  usename = 'postgres_exporter') THEN
    CREATE USER postgres_exporter;
  END IF;
END;
$$ language plpgsql;

SELECT __tmp_create_user();
DROP FUNCTION __tmp_create_user();

-- SET PASSWORD FOR USER postgres_exporter.
ALTER USER postgres_exporter WITH PASSWORD 'YOURPASSWORD';
ALTER USER postgres_exporter SET SEARCH_PATH TO postgres_exporter,pg_catalog;

-- If deploying as non-superuser (for example in AWS RDS), uncomment the GRANT
-- line below and replace <MASTER_USER> with your root user.
-- GRANT postgres_exporter TO <MASTER_USER>;

GRANT CONNECT ON DATABASE postgres TO postgres_exporter;
EOF
To execute this function, we will connect to PostgreSQL using the postgres user and the psql cli, then execute \i file.sql to include:
su -c "psql" postgres
psql (13.14)
Type "help" for help.

postgres=# \i postgres_exporter.sql

postgres=# GRANT pg_monitor to postgres_exporter;
Let's create our connection string with PostgreSQL:
cat <<EOF > /opt/postgres_exporter/postgres_exporter.env
# postgres_exporter.env :
DATA_SOURCE_NAME="postgresql://postgres_exporter:YOURPASSWORD@localhost:5432/postgres?sslmode=disable"
EOF
Use the command below to create the service that will run our postgres_exporter:
cat <<EOF > /etc/systemd/system/postgres-exporter.service
[Unit]
Description=Prometheus exporter for Postgresql
Wants=network-online.target
After=network-online.target

[Service]
User=postgres_exporter
Group=postgres_exporter
WorkingDirectory=/opt/postgres_exporter
Type=simple
EnvironmentFile=/opt/postgres_exporter/postgres_exporter.env
ExecStart=/usr/local/bin/postgres_exporter --web.listen-address=:9187 --web.telemetry-path=/metrics
Restart=always

[Install]
WantedBy=multi-user.target
EOF
Let's now adjust the permissions and start our service:
# Change owner
chown postgres_exporter:postgres_exporter -R ../postgres_exporter/

# Set selinux context
restorecon -Rv /opt/postgres_exporter

# Enable and start service
systemctl daemon-reload
systemctl enable --now postgres-exporter.service
Validating service status:
[root@aap ~]# systemctl status postgres-exporter.service
● postgres-exporter.service - Prometheus exporter for Postgresql
     Loaded: loaded (/etc/systemd/system/postgres-exporter.service; enabled; preset: disabled)
     Active: active (running) since Fri 2024-07-26 17:04:15 CEST; 18s ago
   Main PID: 1318899 (postgres_export)
      Tasks: 10 (limit: 100439)
     Memory: 9.9M
        CPU: 158ms
     CGroup: /system.slice/postgres-exporter.service
             └─1318899 /usr/local/bin/postgres_exporter --web.listen-address=:9187 --web.telemetry-path=/metrics

Jul 26 17:04:15 aap.rhbr-lab.com.br systemd[1]: Started Prometheus exporter for Postgresql.
Jul 26 17:04:15 aap.rhbr-lab.com.br postgres_exporter[1318899]: ts=2024-07-26T15:04:15.130Z caller=proc.go:267 msg="Excluded databases" databases=[]
Jul 26 17:04:15 aap.rhbr-lab.com.br postgres_exporter[1318899]: ts=2024-07-26T15:04:15.131Z caller=tls_config.go:274 level=info msg="Listening on" address=[::]:9187
Jul 26 17:04:15 aap.rhbr-lab.com.br postgres_exporter[1318899]: ts=2024-07-26T15:04:15.131Z caller=tls_config.go:277 level=info msg="TLS is disabled." http2=false address=[::]:9187
Jul 26 17:04:15 aap.rhbr-lab.com.br postgres_exporter[1318899]: ts=2024-07-26T15:04:15.723Z caller=server.go:74 level=info msg="Established new database connection" fingerprint=localhost:5432
Jul 26 17:04:15 aap.rhbr-lab.com.br postgres_exporter[1318899]: ts=2024-07-26T15:04:15.743Z caller=postgres_exporter.go:613 level=info msg="Semantic version changed" server=localhost:5432 from=0.0.0 to=13.14.0
Validating using cURL:
curl http://localhost:9187/metrics -s | grep pg_up
# HELP pg_up Whether the last scrape of metrics from PostgreSQL was able to connect to the server (1 for yes, 0 for no).
# TYPE pg_up gauge
pg_up 1
Now let's add a rule in firewall-cmd to release port 9187, which is the default port for postgres_exporter:
firewall-cmd --zone=public --add-port=9187/tcp --permanent
firewall-cmd --reload
Prometheus
Note
Perform the following steps on the monitoring server.
Let's add a new job at the end of the prometheus.yml for our postgres_exporter and restart the Prometheus service:
cat <<EOF >> /etc/prometheus/prometheus.yml
# AAP POSTGRESQL NODE EXPORTER
- job_name: 'aap_pgsql_exporter_metrics'
metrics_path: /metrics
scrape_interval: 5s
static_configs:
- targets: ['aap.lab.laraujo.com.br:9187']
EOF
# Restart the prometheus service
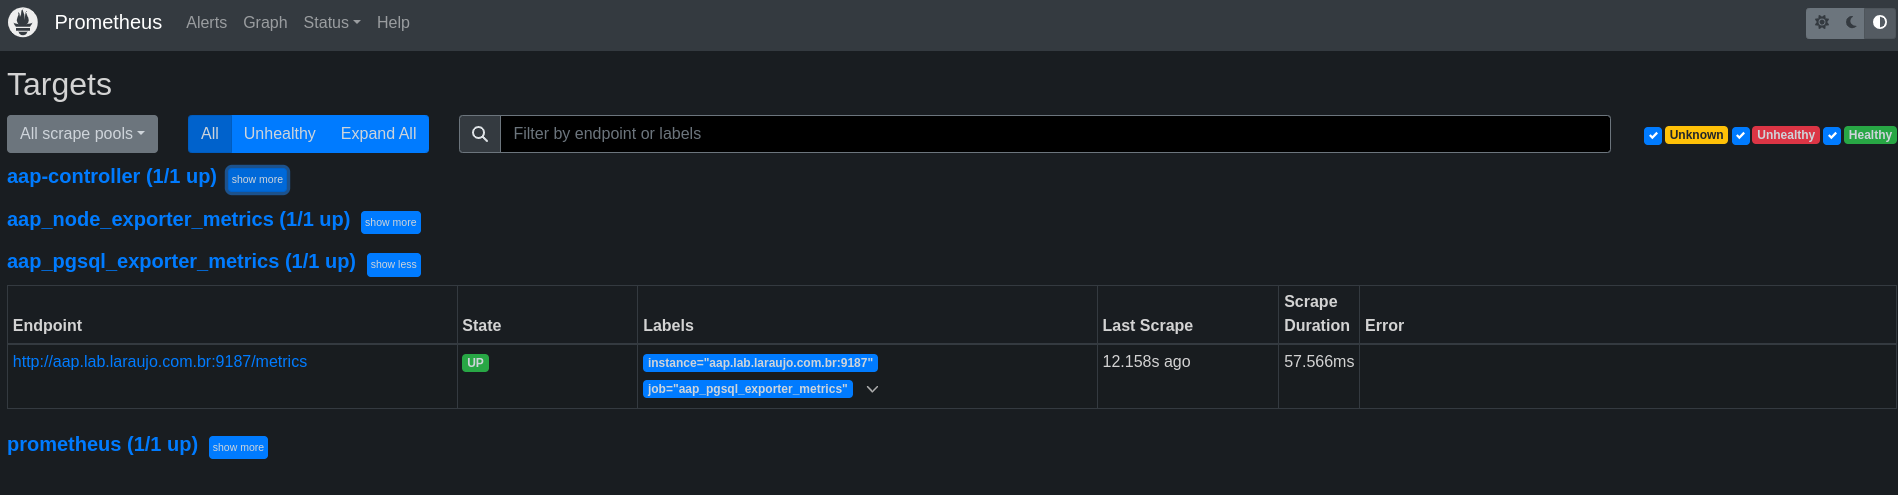
systemctl restart prometheusTo validate our jobs, in the Prometheus console, go to Status → Targets. We will be able to see our Postgresql target, as shown in Figure 1.
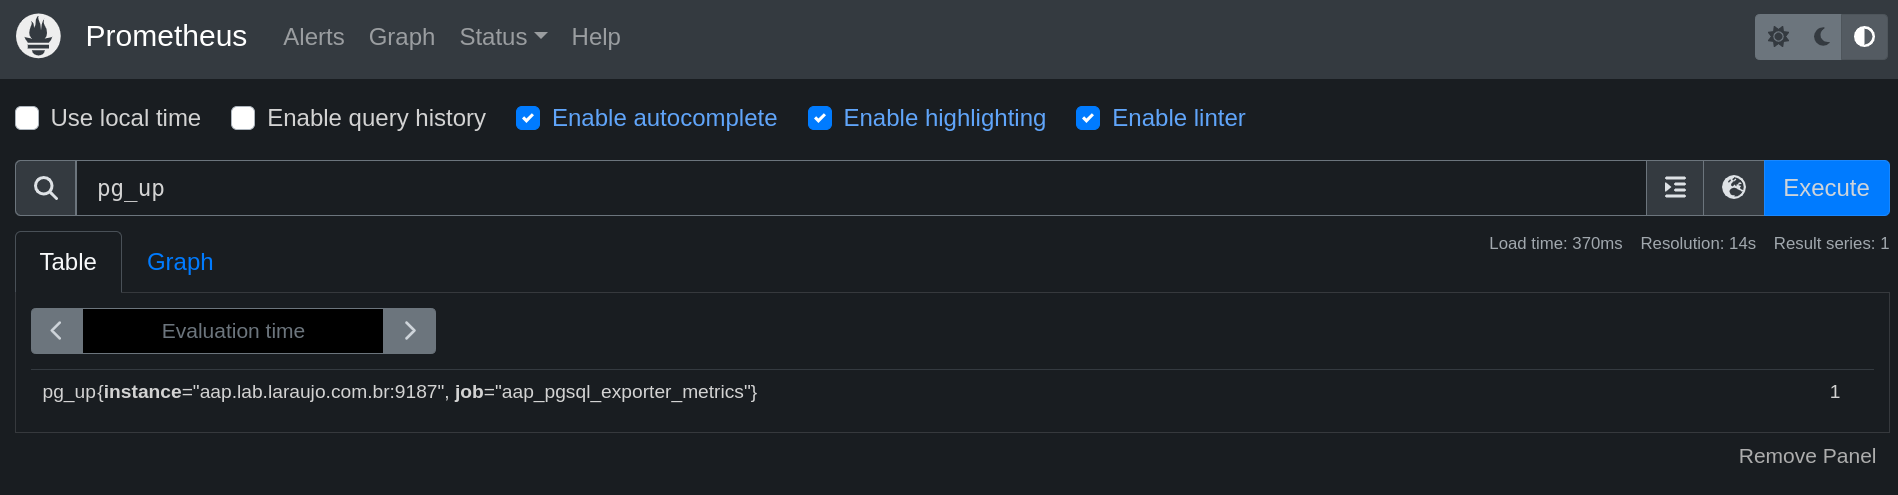
Validating our metrics directly in Prometheus, access the Prometheus web UI and search for metrics with the prefix pg_ (Figure 2).
Grafana dashboard
Now let's import the dashboard into Grafana and start monitoring our PostgreSQL. Download and save aap-pgsql-metrics.json file in the provisioning directory:
# access the proviosining/dashboards directory
cd /etc/grafana/provisioning/dashboards/

# create a directory called AAP
mkdir -v AAP

# download
curl -L https://raw.githubusercontent.com/leoaaraujo/articles/master/aap-pgsql-exporter-grafana/files/aap-pgsql-metrics.json -o AAP/aap-pgsql-metrics.json

# change owner
chown :grafana AAP/aap-pgsql-metrics.jsonNote
If there is more than one JSON dashboard, both will be automatically imported into Grafana.
Now let's create an aap-metrics.yaml file that will allow the automatic provisioning of our dashboard in Grafana:
cat <<EOF > /etc/grafana/provisioning/dashboards/aap-metrics.yaml
apiVersion: 1
providers:
- name: AAP-Metrics
folder: AAP
type: file
options:
# Path where our aap-pgsql-metrics.json file is saved
path:
/etc/grafana/provisioning/dashboards/AAP
EOF
# change owner
chown :grafana /etc/grafana/provisioning/dashboards/aap-metrics.yaml
# Restart the grafana-server service
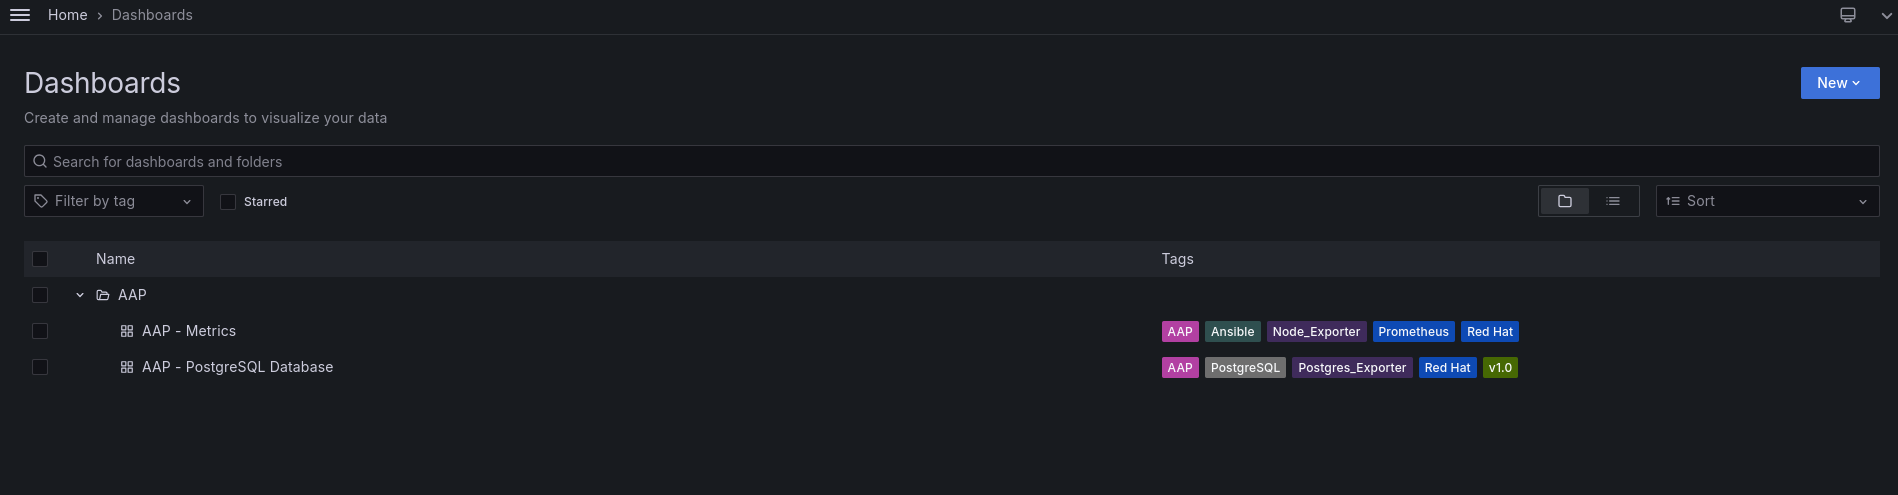
systemctl restart grafana-server.serviceTo validate that our dashboard was provisioned correctly, in the Grafana console, in the left side menu, click on Dashboards. We will have our dashboard provisioned in a folder called AAP (Figure 3).
To view the dashboard, click on the dashboard name. See Figures 4 and 5.
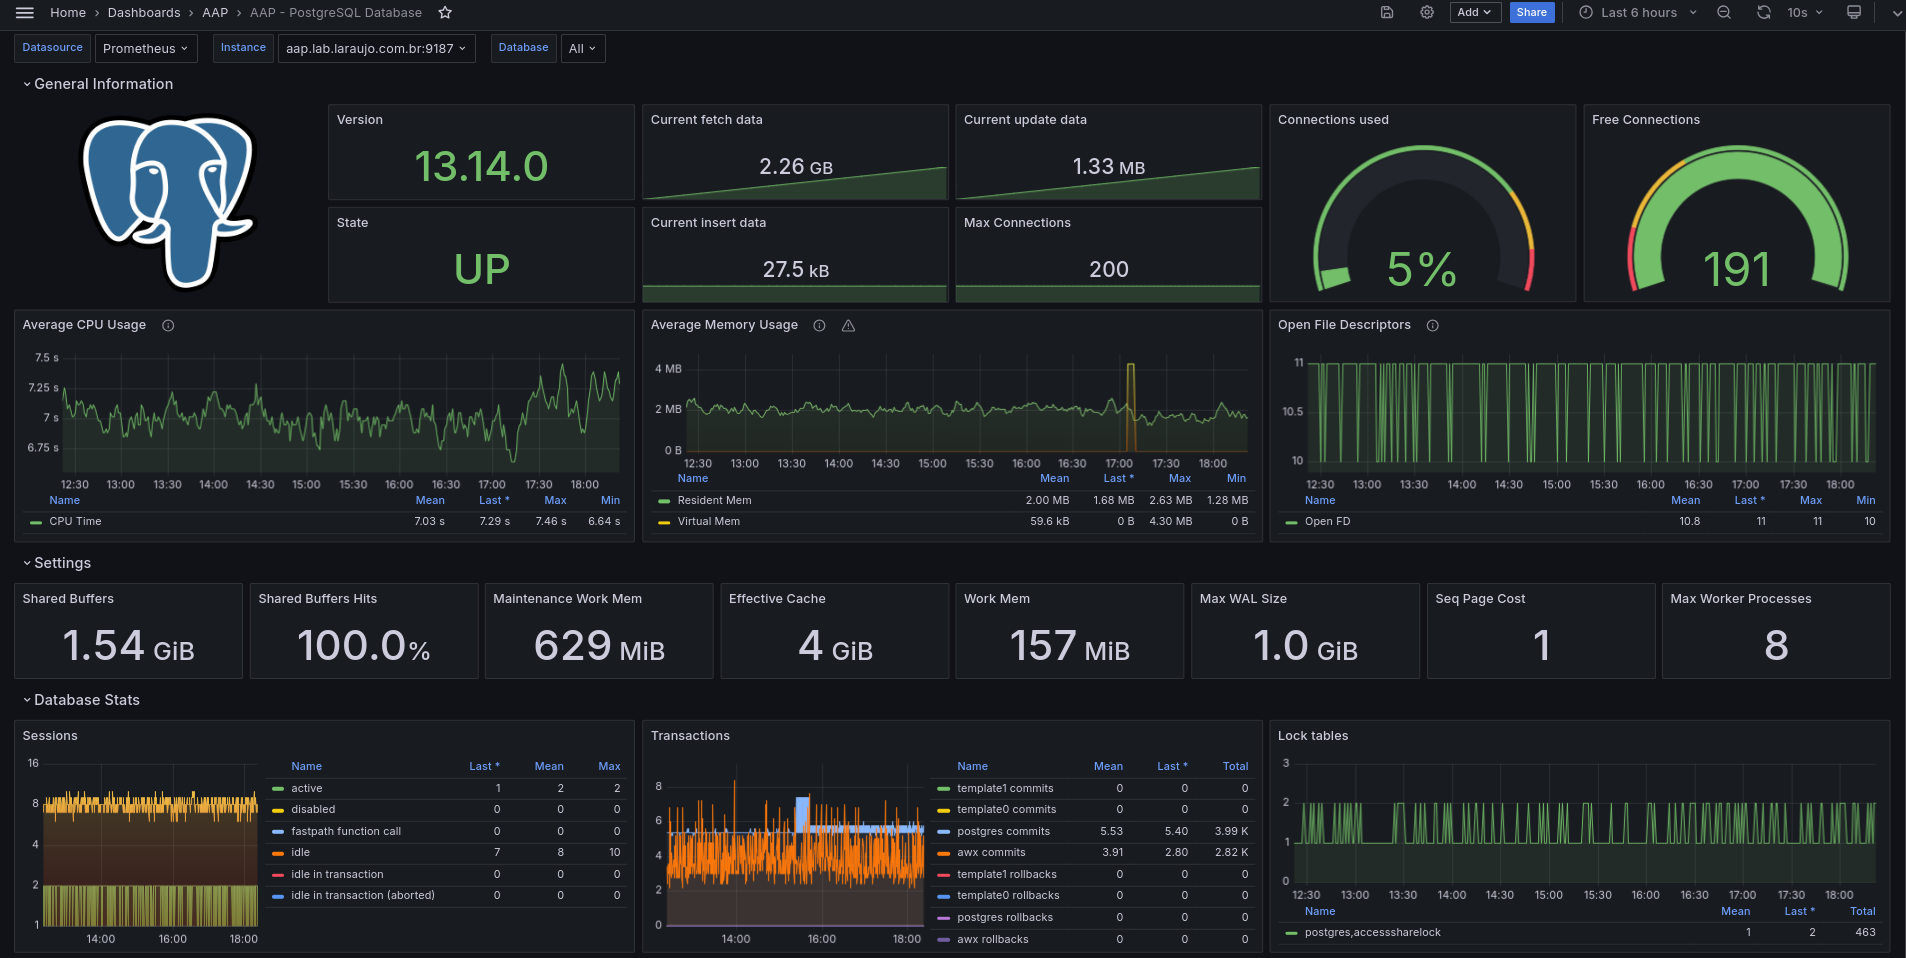
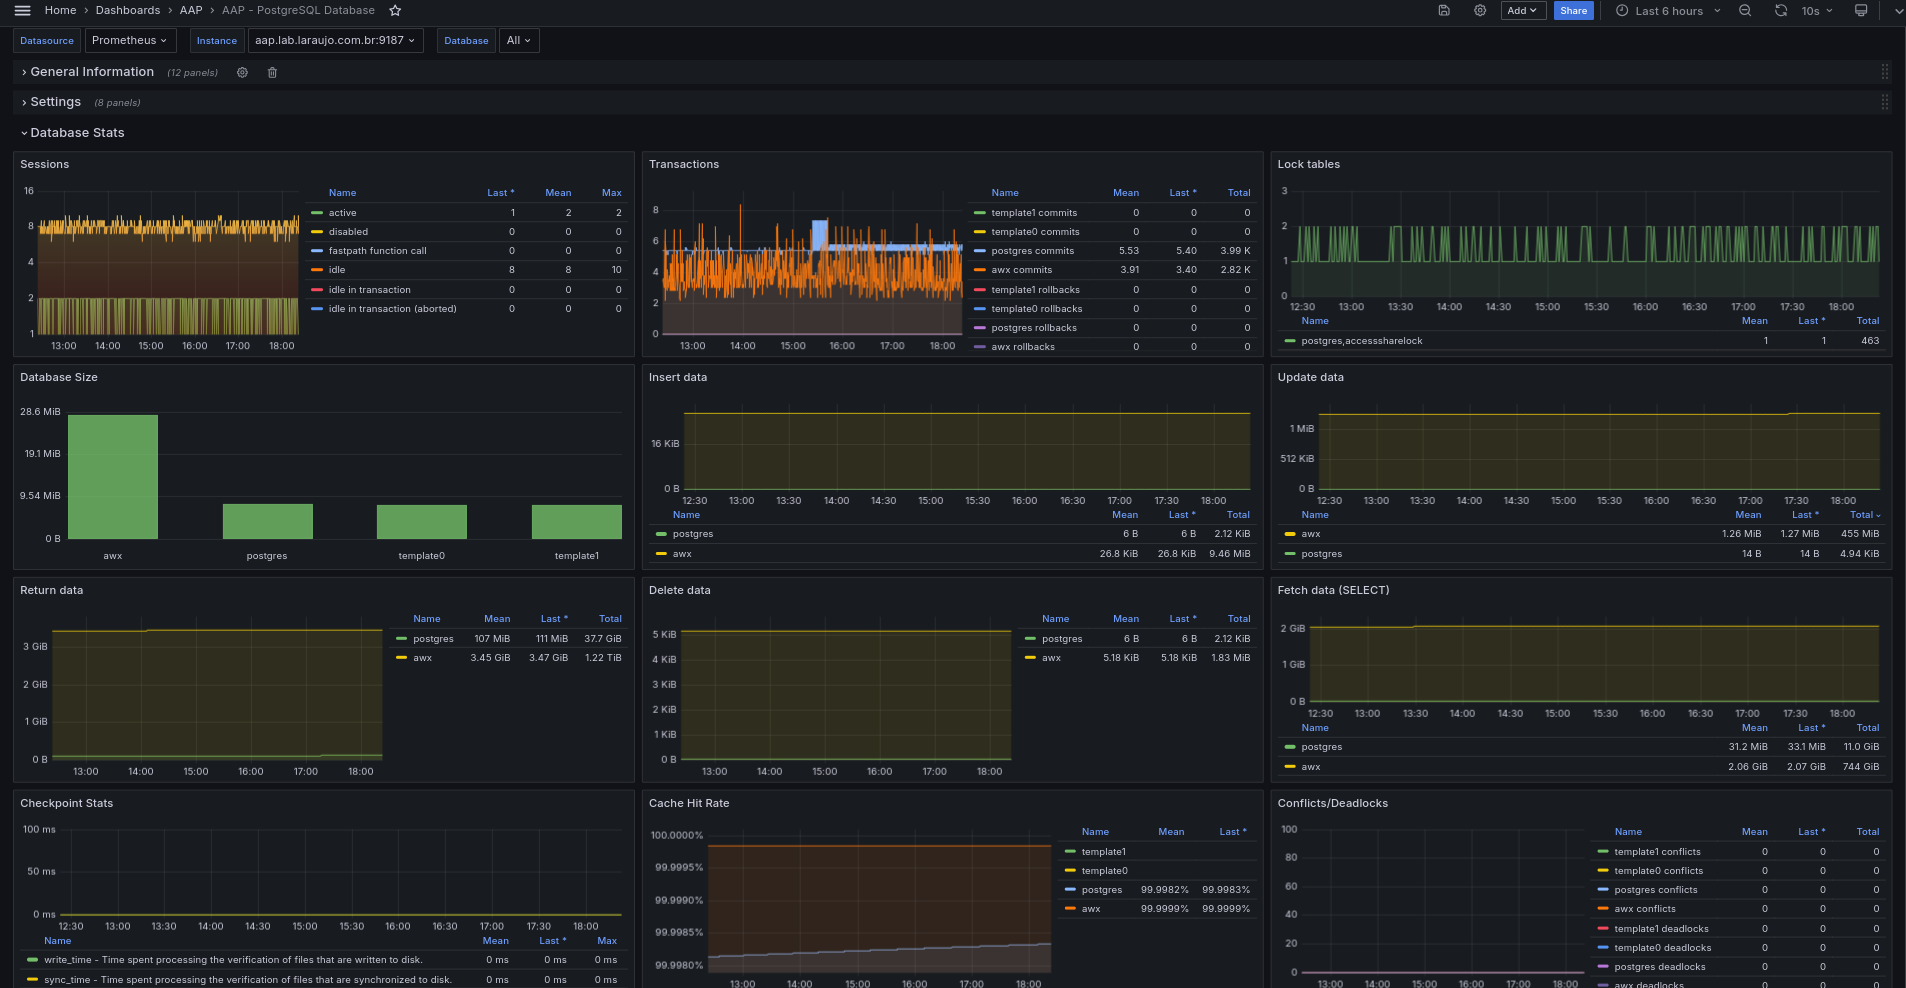
Conclusion
Using the Prometheus, Postgres Exporter, and Grafana stack, we can have a complete view of the PostgreSQL database health, such as configurations, resource consumption, shared buffer, data ingestion, writing and reading in databases, conflicts and deadlocks, checkpoint, cache, sessions and transactions.
References
For more details and other configurations, start with the reference documents below.