In my previous blog, How to set up KServe autoscaling for vLLM with KEDA, we explored the foundational setup of vLLM autoscaling in Open Data Hub (ODH) using KEDA and the custom metrics autoscaler operator. We established the architecture for a scaling strategy that goes beyond traditional CPU and memory metrics, using AI inference-specific service-level indicators (SLI). Now, it's time to put this system to test!
This post presents a comprehensive performance analysis that compares our KServe KEDA-based autoscaling approach against the default Knative request concurrency-based autoscaling. Through rigorous testing with both homogeneous and heterogeneous inference workloads, we'll demonstrate why custom metrics autoscaling represents a significant advancement for production AI deployments on ODH. Since ODH is the upstream project for Red Hat OpenShift AI, all findings presented here apply directly to OpenShift AI deployments.
Knative's concurrency-based autoscaling requires a lot of upfront analysis and load testing to determine optimal target concurrency thresholds. In contrast, KEDA enables direct service-level objective (SLO)-driven scaling by leveraging actual SLIs like Inter-Token Latency (ITL) and end-to-end response times from vLLM. This fundamental difference means KEDA can respond dynamically to real quality of service degradation without the guesswork of capacity planning. The Knative approach forces teams to spend significant time on performance characterization to establish appropriate concurrency limits that often don't adapt well to varying request patterns or model characteristics inherent in LLM workloads.
The results reveal compelling advantages that directly impact both cost efficiency and quality of service, particularly when dealing with real-world AI inference traffic.
Executive summary of the results
The performance results in this blog pits Knative's concurrency-based autoscaler (KPA) against KServe's SLO-driven KEDA approach for vLLM. The target SLO was a median ITL of 75 ms.
Under predictable homogeneous workloads, a well-tuned KPA (KNative-10 concurrency) was the most stable, with an 84.8% request's success rate. However, the KNative-100 concurrency configuration failed completely, with error rates over 51%.
In the more realistic heterogeneous workload test, the KPA failed; the KNative-10 concurrency setting violated the SLO (stabilizing near 80 ms) and only used 5 of 7 available pods.
KServe (KEDA) was the clear winner for this real-world load, correctly scaling to full cluster capacity (7 pods) to maintain the latency target and achieve the highest request's success rate (86.9%).
The results show that KPA's concurrency metric is a poor proxy for load, leaving expensive hardware idle while failing performance targets.
Background and key concepts
To lay the groundwork for our performance analysis, we'll first examine the critical differences between workload types and the key metrics necessary for vLLM performance evaluation.
Homogeneous versus heterogeneous data in vLLM inference
When discussing vLLM inference performance, it's crucial to understand the distinction between homogeneous and heterogeneous workloads, as this directly affects how effective autoscaling can be.
Homogeneous workloads exhibit consistent input and output patterns. Examples include:
- Uniform input sequence lengths within a narrow distribution (e.g., all inputs around 100-200 tokens).
- Similar output sequence length requirements with minimal variance (e.g., all responses targeting 50-100 tokens).
- Consistent task complexity resulting in more predictable resource utilization patterns (e.g., all simple Q&A or all code generation requests).
- Predictable processing times with low variance in latency and throughput.
Heterogeneous workloads represent the reality of most production deployments, and they feature:
- Wide distribution of input sequence lengths spanning multiple orders of magnitude (ranging from 10 tokens to several thousand).
- Diverse output sequence length requirements ranging from minimal single-word answers to multi-paragraph responses.
- Mixed task complexity (simple lookups mixed with complex reasoning).
- Significant variance in processing latencies and resource consumption.
This distinction is critical because traditional autoscaling approaches that work reasonably well for homogeneous workloads can fail under heterogeneous conditions. The variance in processing requirements under these conditions can span orders of magnitude. We will show that request concurrency-based autoscaling in Knative is suitable for predictable homogeneous workloads, but it falls short when dealing with heterogeneous ones.
Key performance metrics for vLLM
To effectively monitor and scale these diverse workload patterns, vLLM exposes several performance metrics through its Prometheus endpoint. Understanding these metrics is essential for grasping the insights of the different phases of the inference process. We consider the following metrics to be the most representative of the system's load:
vllm:time_to_first_token_seconds: The Time To First Token (TTFT) measures the latency from the request submission until the first output token is generated. This metric encompasses the entire prefill phase, including prompt tokenization, Key-Value (KV) utilization, and the initial forward pass of the inference request. TTFT is critical for perceived responsiveness, especially in interactive applications where users expect immediate feedback. An elevated TTFT could indicate potential queueing delays or cache misses, among other things.vllm:time_per_output_token_seconds_bucket: The Time Per Output Token (TPOT) represents the average time required to generate each token after the first one. This metric reflects the model's sustained generation speed during the decode phase. TPOT is influenced by factors such as model size, sequence length, or batch size, to name a few.vllm:e2e_request_latency_seconds_bucket: The End-to-End Latency (E2E) captures the total time from request submission to complete response delivery. It includes scheduler queuing time, prefill processing, decode generation, and tokenization overhead. E2E latency provides the most comprehensive view of quality of service (user experience) and includes all the system overhead that users directly perceive.vllm:gpu_cache_usage_perc: This metric tracks the percentage of GPU KV cache use, and it is directly related to vLLM's paged attention memory efficiency. Understanding cache patterns is critical for allocating the correct amount of GPU memory and predicting when additional resources are needed. High cache utilization (>95%) can cause the queue to grow, while low utilization might indicate suboptimal batching and resource utilization.vllm:num_requests_waiting: This metric represents the number of requests waiting in the scheduler's queue and provides real-time insight into the system load. A consistently growing queue indicates that incoming requests-per-second (RPS) are exceeding processing capacity, signaling the need for more resources.
In this blog, we mainly focus on the Inter-Token Latency (ITL), which is the time between consecutive token generations. While TPOT gives us the average, ITL captures the consistency of generation speed.
The aforementioned metrics behave differently under various load conditions and provide distinct signals for autoscaling decisions. For instance, an increasing TTFT often indicates queue buildup and suggests the need for additional replicas, while a degrading TPOT might signal resource saturation requiring scaling or load redistribution. We will discuss more about these patterns later in the blog.
Differences between HPA and KPA
Both the Kubernetes Horizontal Pod Autoscaler (HPA) and the Knative Pod Autoscaler (KPA) scale pods horizontally (by adding or removing replicas). However, their fundamental scaling logic is completely different: the HPA is resource-based, while the KPA is request-based.
Horizontal Pod Autoscaler
The standard HPA makes scaling decisions by observing resource metrics. It polls the Kubernetes Metrics Server (or a custom metrics provider) to check the current CPU, memory utilization, or other metrics of a set of pods.
How it works: You define a resource target, such as scale to maintain an average CPU utilization of 70%. The HPA periodically checks this metric (every 15 seconds by default). If the average CPU usage across all pods climbs to 90%, it adds pods. If it drops to 20%, it removes pods.
How replica count is computed: The HPA uses a ratio to determine the desired number of pods:

For example, if you have 4 pods running at 90% CPU and your target is 70%, the HPA will calculate:

Knative Pod Autoscaler
The KPA, Knative's default autoscaler, does not check CPU, memory, or any other metrics. Instead, it scales based on the number of in-flight requests each pod is handling.
How it works: Knative injects a queue-proxy sidecar container into every pod. This proxy intercepts all incoming requests, counts how many are active at any given moment, and reports this concurrency metric to the KPA. You define a soft limit for this concurrency, such as target concurrency of 10.
How replica count is computed: The KPA's calculation is simpler. It determines the total desired capacity based on total incoming requests and divides that by the target per pod.

For example, if 100 requests are hitting your service simultaneously and your target is 10, the KPA calculates:

This calculation is the KPA's core weakness for heterogeneous workloads: it assumes all requests are equal. It treats one computationally cheap 10-token request and one computationally expensive 4,000-token request as the same single unit of concurrency.
Testing methodology
Our performance testing used the meta-llama/Llama-3.1-8B model deployed on Open Data Hub version 2.33.0. The testing environment consisted of:
- Cluster configuration: IBM Cloud OCP (version 4.18.8) cluster with:
- 2 nodes bx3d-4x20:
- 4 CPU cores
- 20 GiB of memory
- 1 node gx3-64x320x4l4:
- 64 vCPU
- 320 GiB of memory
- 4x NVIDIA L4 24GB GPU
- 3 nodes gx3-16x80x1l4:
- 16 vCPU
- 80 GiB of memory
- 1x NVIDIA L4 24GB GPU
- 2 nodes bx3d-4x20:
- Model deployment:
- KServe RawDeployment inferenceService with vLLM v0.6.6 serving backend
- KNative InferenceService with vLLM v0.6.6 serving backend
- Monitoring stack: ODH built-in Prometheus with vLLM metrics enabled
- Load generation: vllm-project/guidellm
Workload profiles
We designed two distinct workload profiles to test autoscaling performance:
Homogeneous profile (constant):
- Input sequence length: 3,072 tokens (fixed)
- Output sequence length: 1,200 tokens (fixed)
Heterogeneous profile (normal distribution):
- Input sequence length: 3,072 tokens (mean)
- Standard deviation: 2,000
- Minimum tokens: 50
- Maximum tokens: 16,384
- Output sequence length: 512 tokens (mean)
- Standard deviation: 1,000
- Minimum tokens: 20
- Maximum tokens: 8,192
Scaling configurations compared
- Default Knative serverless autoscaling: Request concurrency-based scaling with target concurrency of 10 and 100 active requests per pod. We refer to these interchangeably as KNative-10 and KNative-100 throughout this blog.
- KServe RawDeployment with KEDA custom metrics: Composite trigger combining Inter-Token Latency, KV cache usage, and number of waiting requests.
Other performance validation settings
To run these performance comparisons, we first established a common environment, a performance target, and a set of tools for load generation and metric collection.
Service-level objective
For all experiments, we defined a single SLO: maintain a system-wide median (p50) ITL at or below 75 ms. This 75 ms baseline represents our target for a good quality of service, and all autoscaling configurations were measured against this goal. When we configure a ScaledObject for KEDA, you will notice we use a median ITL of 70 ms, which is right below the 75 ms target. We want to avoid scaling when it's too late, as this could prevent an SLO violation.
With this in mind, we defined a KEDA ScaledObject for the HPA. We use the median ITL as the primary metric. We enhanced the autoscaler's behavior by giving it guidelines for GPU KV cache use and queue depth:
---
apiVersion: keda.sh/v1alpha1
kind: ScaledObject
metadata:
  name: llama-31-8b-predictor
  namespace: keda
spec:
  scaleTargetRef:
    apiVersion: apps/v1
    kind: Deployment
    name: llama-31-8b-predictor
  minReplicaCount: 1
  maxReplicaCount: 7
  pollingInterval: 5
  cooldownPeriod: 10
  triggers:
  - type: prometheus
    authenticationRef:
      name: keda-trigger-auth-prometheus
    metadata:
      serverAddress: https://thanos-querier.openshift-monitoring.svc.cluster.local:9092
      query: 'sum(vllm:num_requests_waiting{model_name="llama-31-8b"})'
      threshold: '2' # target: up to 2 requests waiting in the queue
      authModes: "bearer"
      namespace: keda
  - type: prometheus
    authenticationRef:
      name: keda-trigger-auth-prometheus
    metadata:
      serverAddress: https://thanos-querier.openshift-monitoring.svc.cluster.local:9092
      query: 'avg(vllm:gpu_cache_utilization_percent{model_name="llama-31-8b"})'
      threshold: '0.6' # target: average GPU cache utilization below 60%
      authModes: "bearer"
      namespace: keda
  - type: prometheus
    authenticationRef:
      name: keda-trigger-auth-prometheus
    metadata:
      serverAddress: https://thanos-querier.openshift-monitoring.svc.cluster.local:9092
      query: 'histogram_quantile(0.5, sum by(le) (rate(vllm:time_per_output_token_seconds_bucket{model_name="llama-31-8b"}[5m])))'
      threshold: '0.07' # target: median itl of 75ms
      authModes: "bearer"
      namespace: keda
Speeding up pod startup time
A key challenge in autoscaling LLMs is the cold start penalty. A new pod can't serve traffic until it loads the model weights into GPU memory. If each new pod had to download these weights from an external source (like Hugging Face or Amazon S3), the startup time could take several minutes. This would render the autoscaler useless for handling sudden load.
To solve this, we implemented a shared model-weights cache using an NFS-based PersistentVolumeClaim (PVC).
- The model weights are stored on a central NFS (Network File System) volume.
- This volume is mounted as
ReadOnlyManyto all Kubernetes nodes in the cluster. - When a new replica pod is scheduled, it reads the weights directly from this high-speed local network mount, instead of downloading the model.
This approach reduced our pod start-up time from minutes to seconds, making reactive autoscaling feasible.
Load generator and monitoring
All experimental load was generated using GuideLLM, an open source benchmarking tool from the vLLM project. The tool is designed to evaluate the performance of LLM deployments by simulating realistic inference workloads. It supports various traffic patterns and reports fine-grained metrics like throughput, concurrency, and request latencies.
For these tests, we configured GuideLLM to use an incremental rate type (the implementation is in this pull request). This method starts at a low, baseline request rate and slowly increases the load over time. This lets us see exactly when and how the different autoscaling systems react to rising traffic.The load was configured to start at 0.05 requests per second (rps) and increase by 0.005 rps at each step, ramping up to a maximum of 0.6 rps in both homogeneous and heterogeneous workloads.
We directly used vLLM's /metrics endpoint to monitor vLLM metrics, while using the GuideLLM report to analyze requests state.
Performance results and analysis
The following analysis presents the core findings of our comparison between Knative's and KServe's KEDA-based autoscaling approaches under distinct workload profiles.
Homogeneous workload performance
When testing both autoscaling approaches under a homogeneous workload, we observed reasonable performance from each. There were, however, some important distinctions worth highlighting, mostly centered on how each autoscaler is configured.
This difference in configuration approach can significantly impact deployment complexity and time-to-production, especially when you're dealing with new models or changing workload patterns.
Figure 1 illustrates the system-wide Inter-Token Latency for the three distinct configurations subjected to a homogeneous workload. Initially, all three experiments exhibit a similar starting ITL. This is expected, as the minimum replica count was set to one for all the setups. The primary difference, however, is the rate and way at which the ITL stabilizes.
This is highly related to the autoscaler behavior (either HPA or KPA), which spins up new replicas based on different metrics, leading to distinct scaling behaviors.
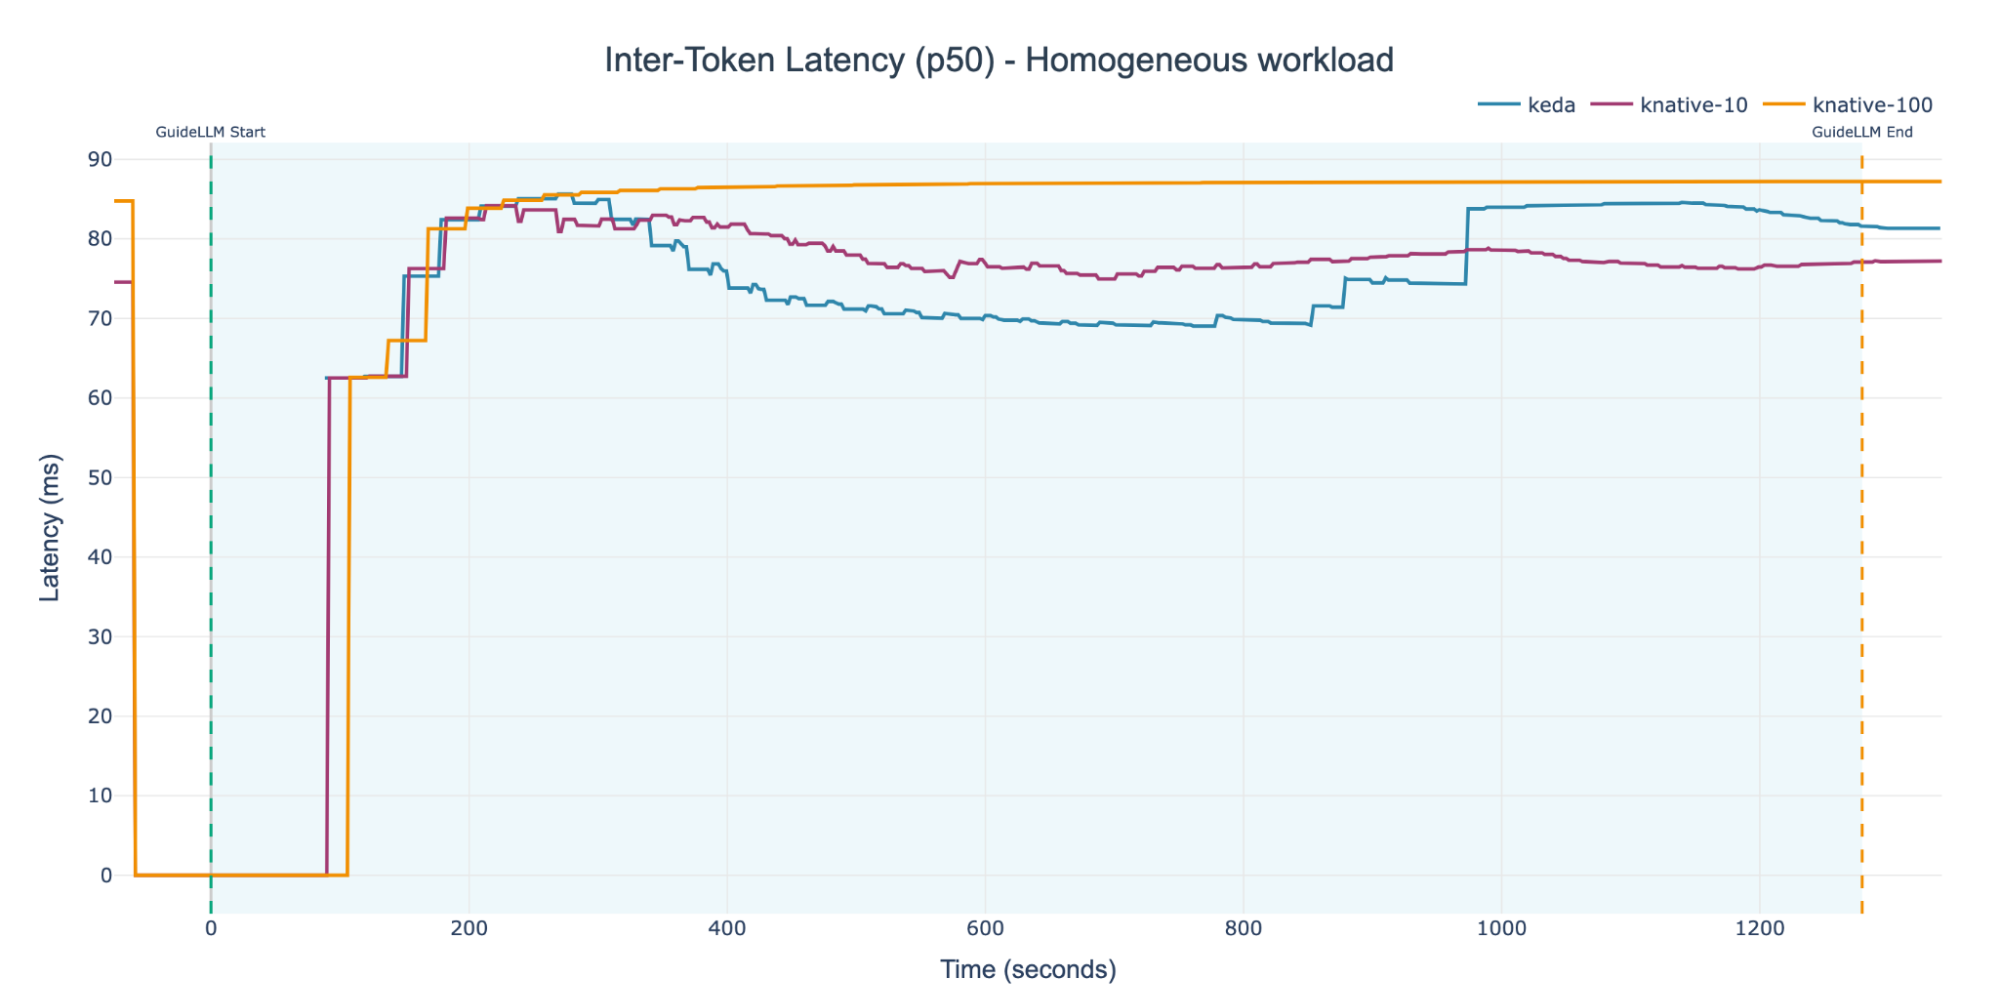
For a more granular analysis, we can analyze the three different setups separately. Figure 2 shows the median (p50) Inter-Token Latency for the KNative-100 experiment in isolation.
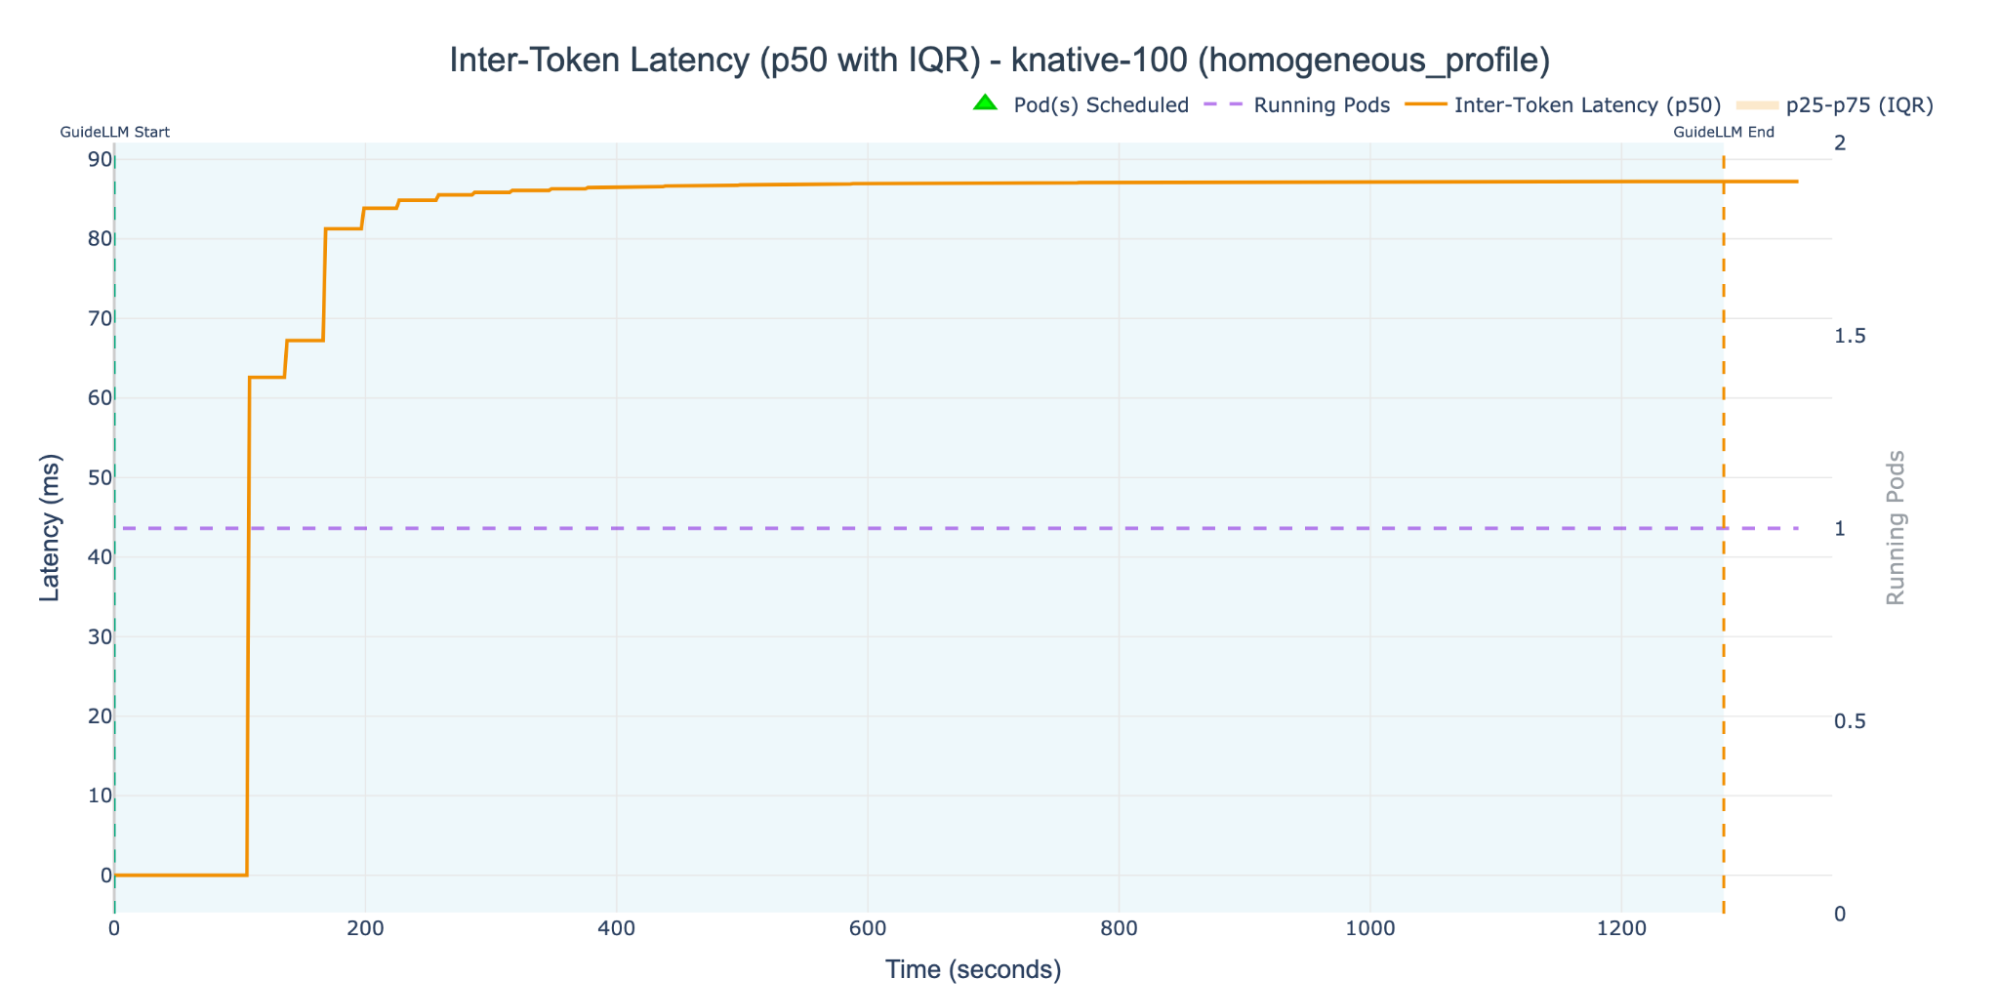
In our KNative-100 experiment, we configured the Knative Pod Autoscaler (KPA) with a target concurrency of 100 active requests. Because this threshold was never breached, autoscaling was never triggered. As the dashed purple line in the figure shows, the entire experiment ran on a single replica pod, reflected in the median ITL staying close to 90 ms for almost the entire experiment.
We then ran the KNative-10 experiment, setting the target concurrency an order of magnitude lower. The results are shown in Figure 3.
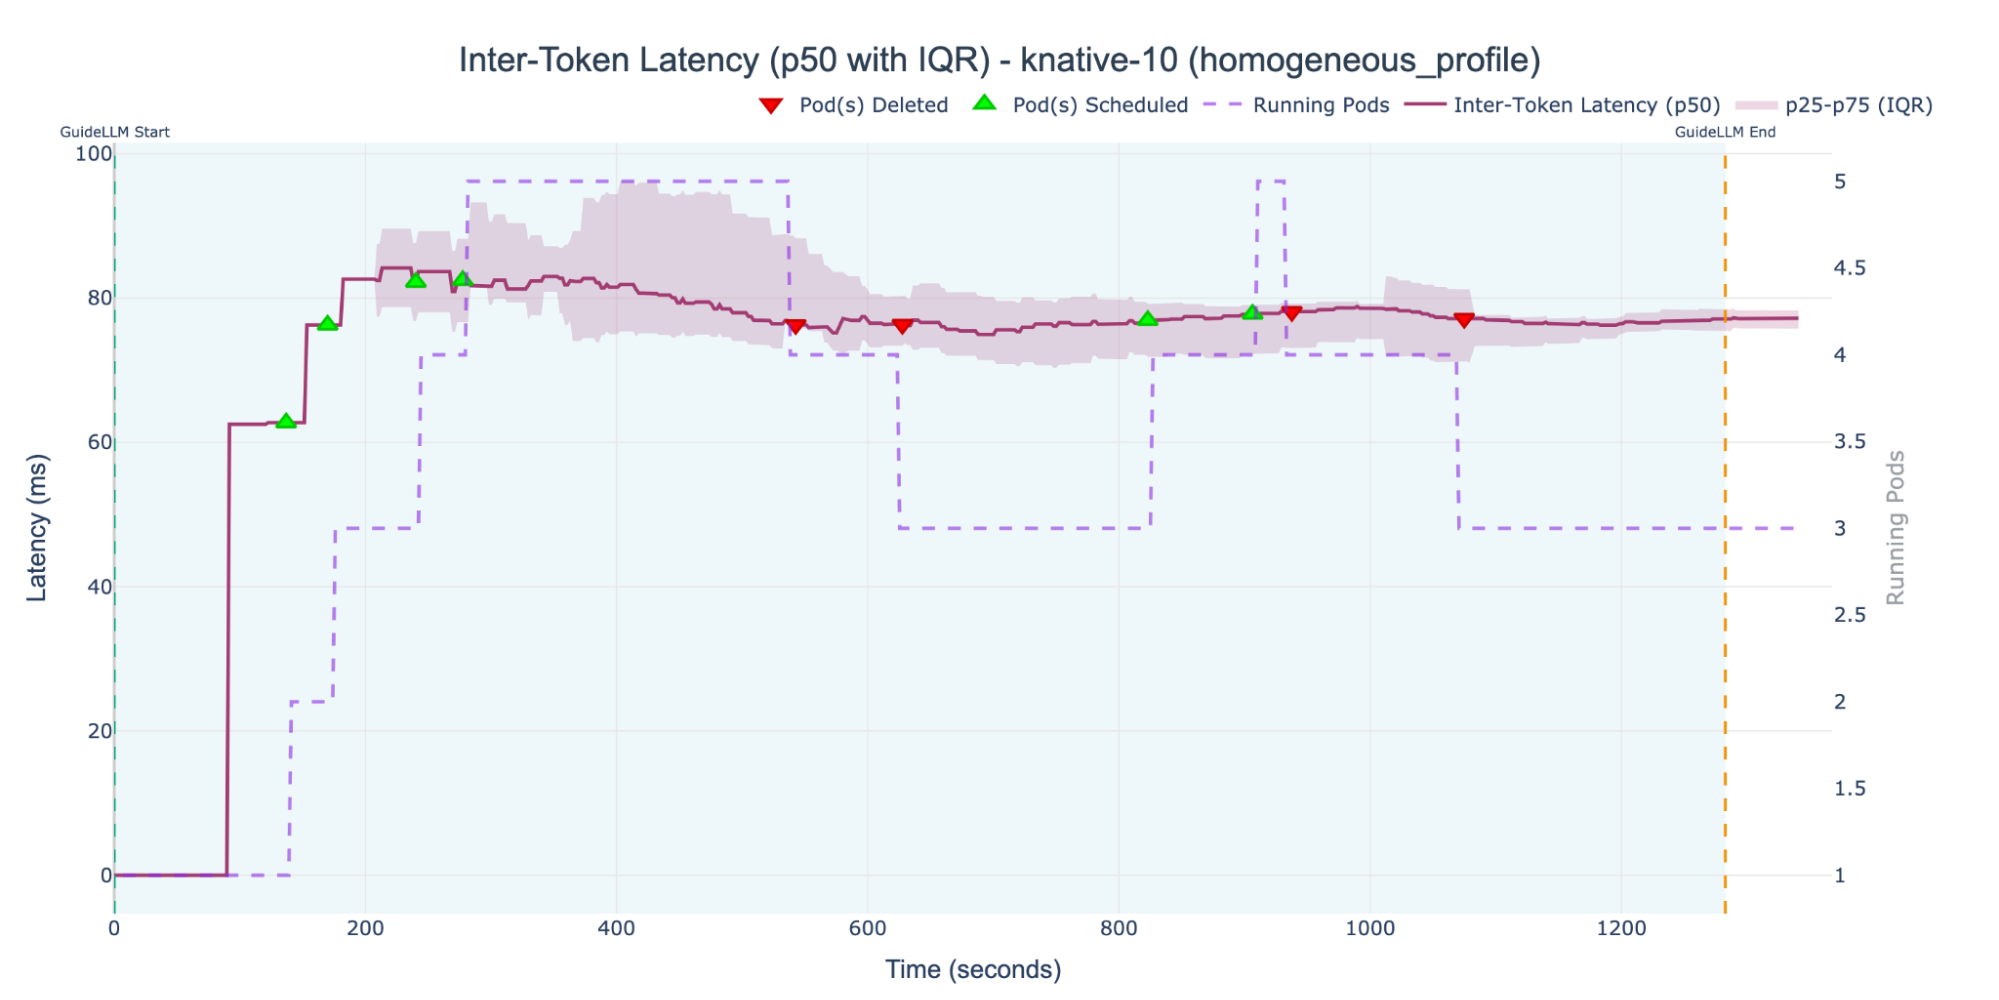
With the more sensitive 10 active requests threshold, the KPA triggered several scaling events. It reached a maximum of five replica pods running simultaneously and kept the ITL right below 80 ms. This configuration also showed a clear link between replica count and latency: during scale-down events, as pods were terminated, the median (p50) ITL immediately began to rise slowly. This is expected autoscaling behavior. However, for a cluster with seven accelerators, we weren't using the full capacity. Even more worrying, we didn't have a clear idea upfront of the target concurrency that would use the full capacity.
This demonstrates a key insight: the KPA is not designed to optimize for ITL, but its concurrency-based scaling mechanism has a direct and significant impact on this SLI. The KPA reacts to concurrency; it doesn't monitor the latency SLI itself. This explains the difficulty in guaranteeing SLO via concurrency metrics.
KServe's SLO-based approach using KEDA was the only configuration that successfully achieved full resource utilization. As illustrated in Figure 4, by scaling to take advantage of all available accelerators, the system achieved the lowest median ITL of all our experiments, even though it fluctuated the most between 85 ms and 70 ms.
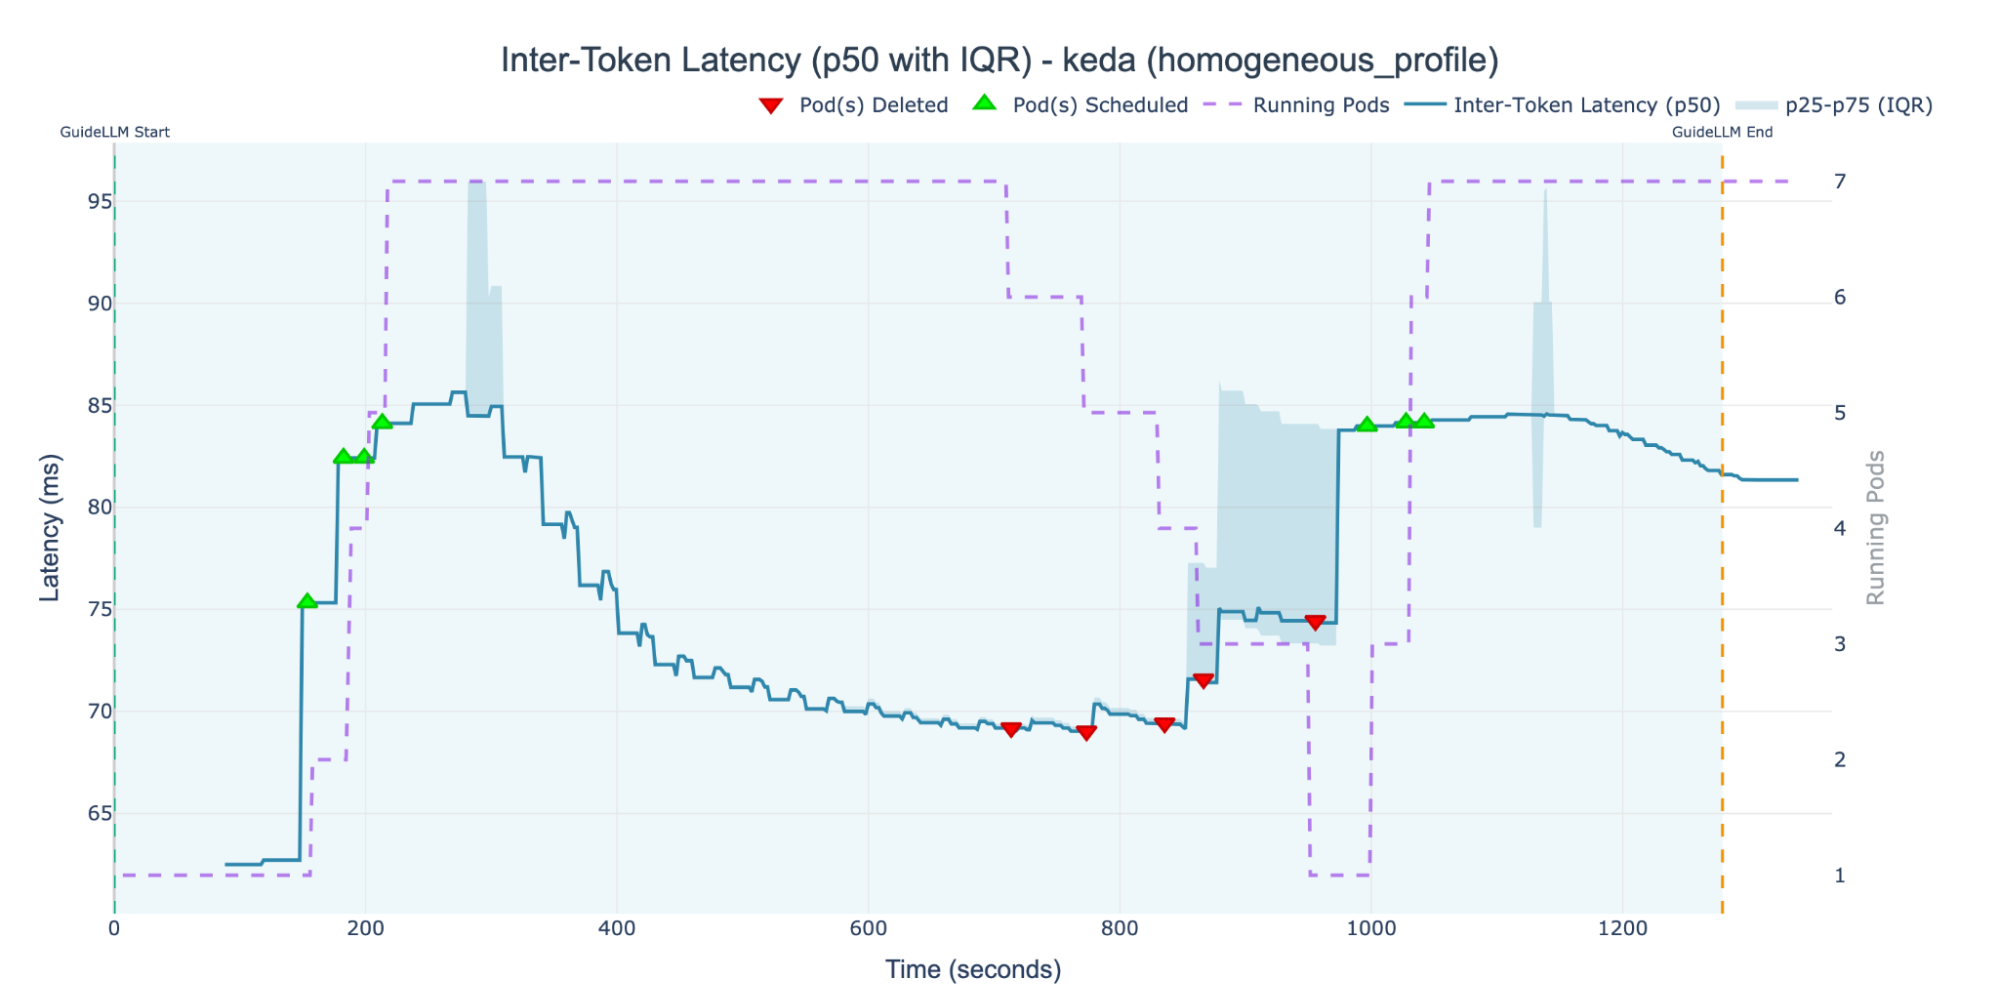
Unlike the KPA's concurrency model, KEDA's behavior is driven directly by the 70 ms ITL target defined in the ScaledObject. This creates a dynamic control loop: when the ITL drops below the 70-ms SLO, KEDA terminates replica pods to save resources. This reduction in capacity immediately causes the median ITL to rise again. The autoscaler detects this SLO breach and triggers scale-up events to bring the latency back down.
This oscillation around the SLO target is the expected and correct behavior for this type of autoscaler. However, it exposes a critical tuning parameter: the aggregation time window. The latency metrics used by the ScaledObject are highly sensitive to this setting. A short window might cause the system to overreact to temporary spikes, while a long window might make it too slow to respond to a genuine SLO violation.
Figure 5 illustrates the number of running and waiting (queued) requests for each experiment. The KNative-10 and KEDA experiments show very similar patterns, effectively processing the load. However, the KNative-100 experiment clearly failed to handle the incoming traffic, accumulating a maximum queue above 50 requests. As the graph shows, waiting requests are quickly bottlenecked. This poor performance is a direct result of the inactive autoscaler: since the 100-request concurrency target was never breached, scaling was never triggered. Consequently, a single replica pod was left to handle the entire request load, leading to a system overload.
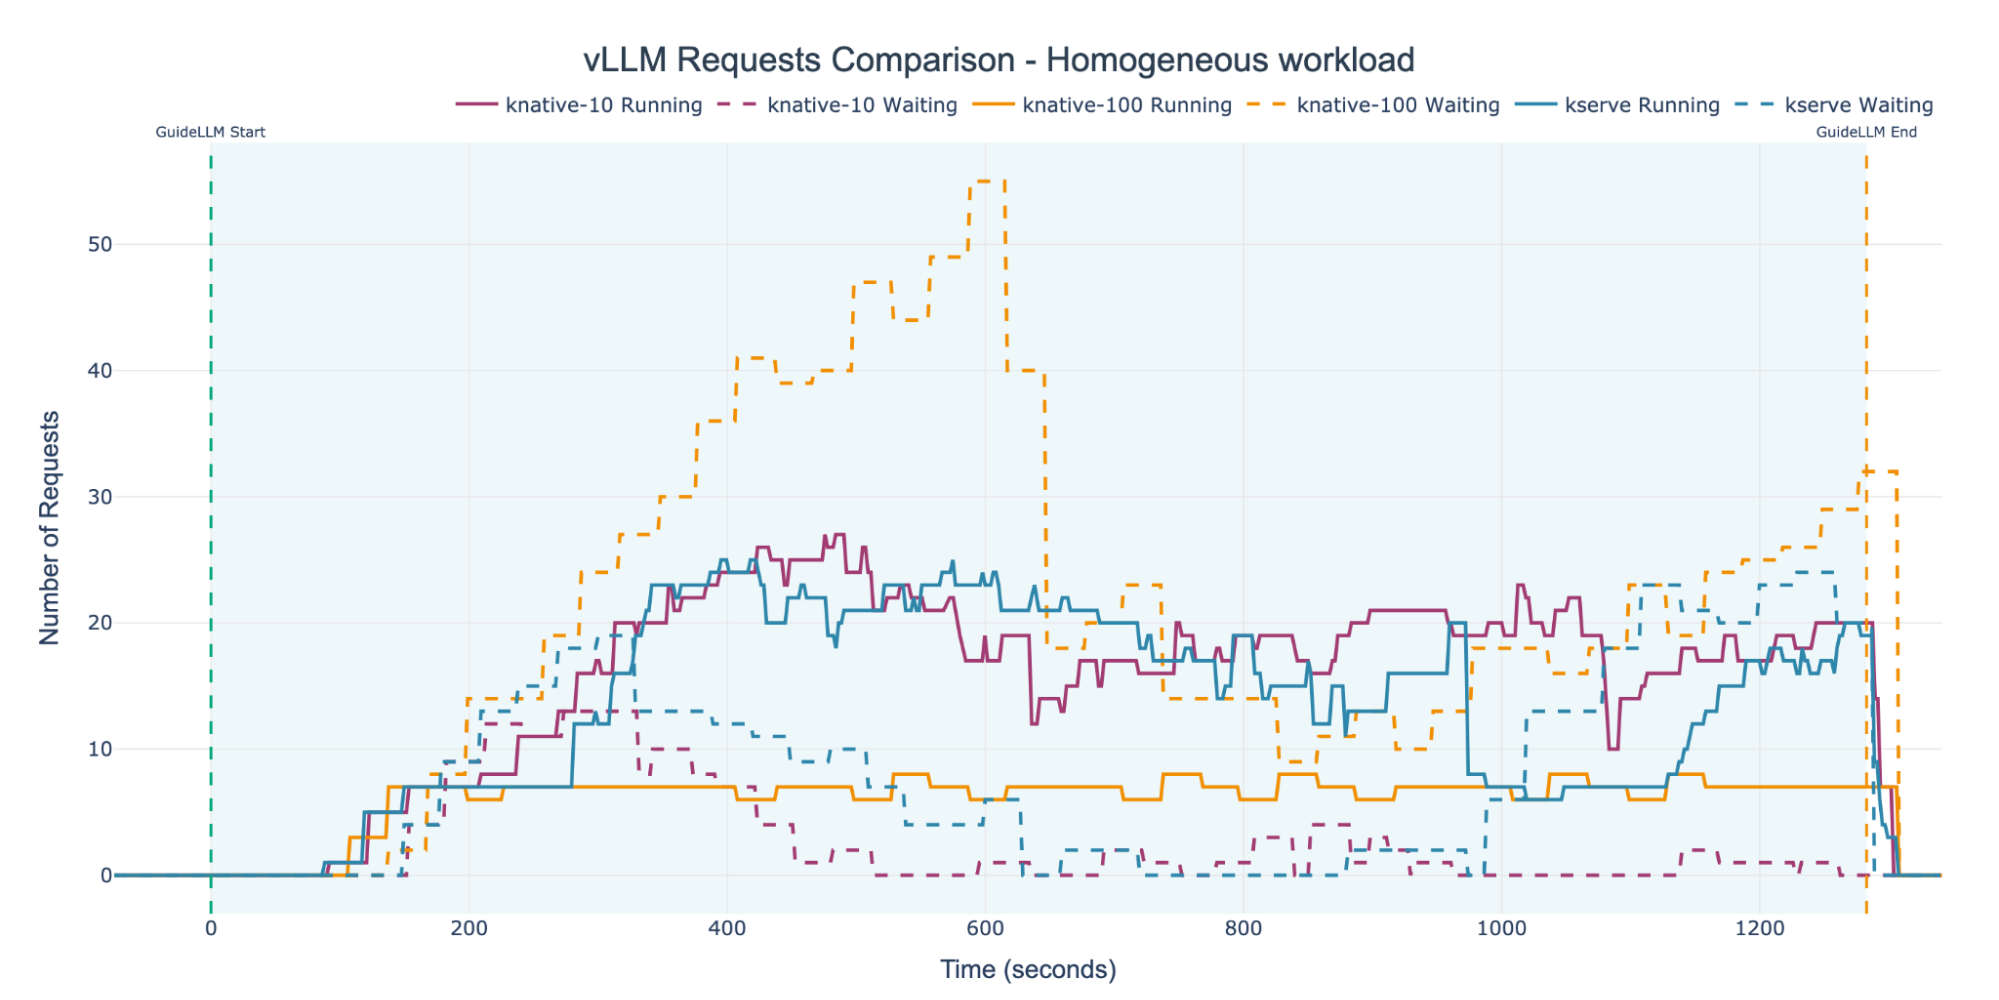
Figure 6 presents the request success metrics reported by GuideLLM. The KNative-100 experiment registered the highest number of error requests. This is an expected outcome, which correlates directly with the severe request bottleneck and queue saturation observed in Figure 5 (meaning requests are timing out). Incomplete requests can be disregarded in this analysis, as they result from GuideLLM's behavior of terminating in-progress requests when the benchmark completes.
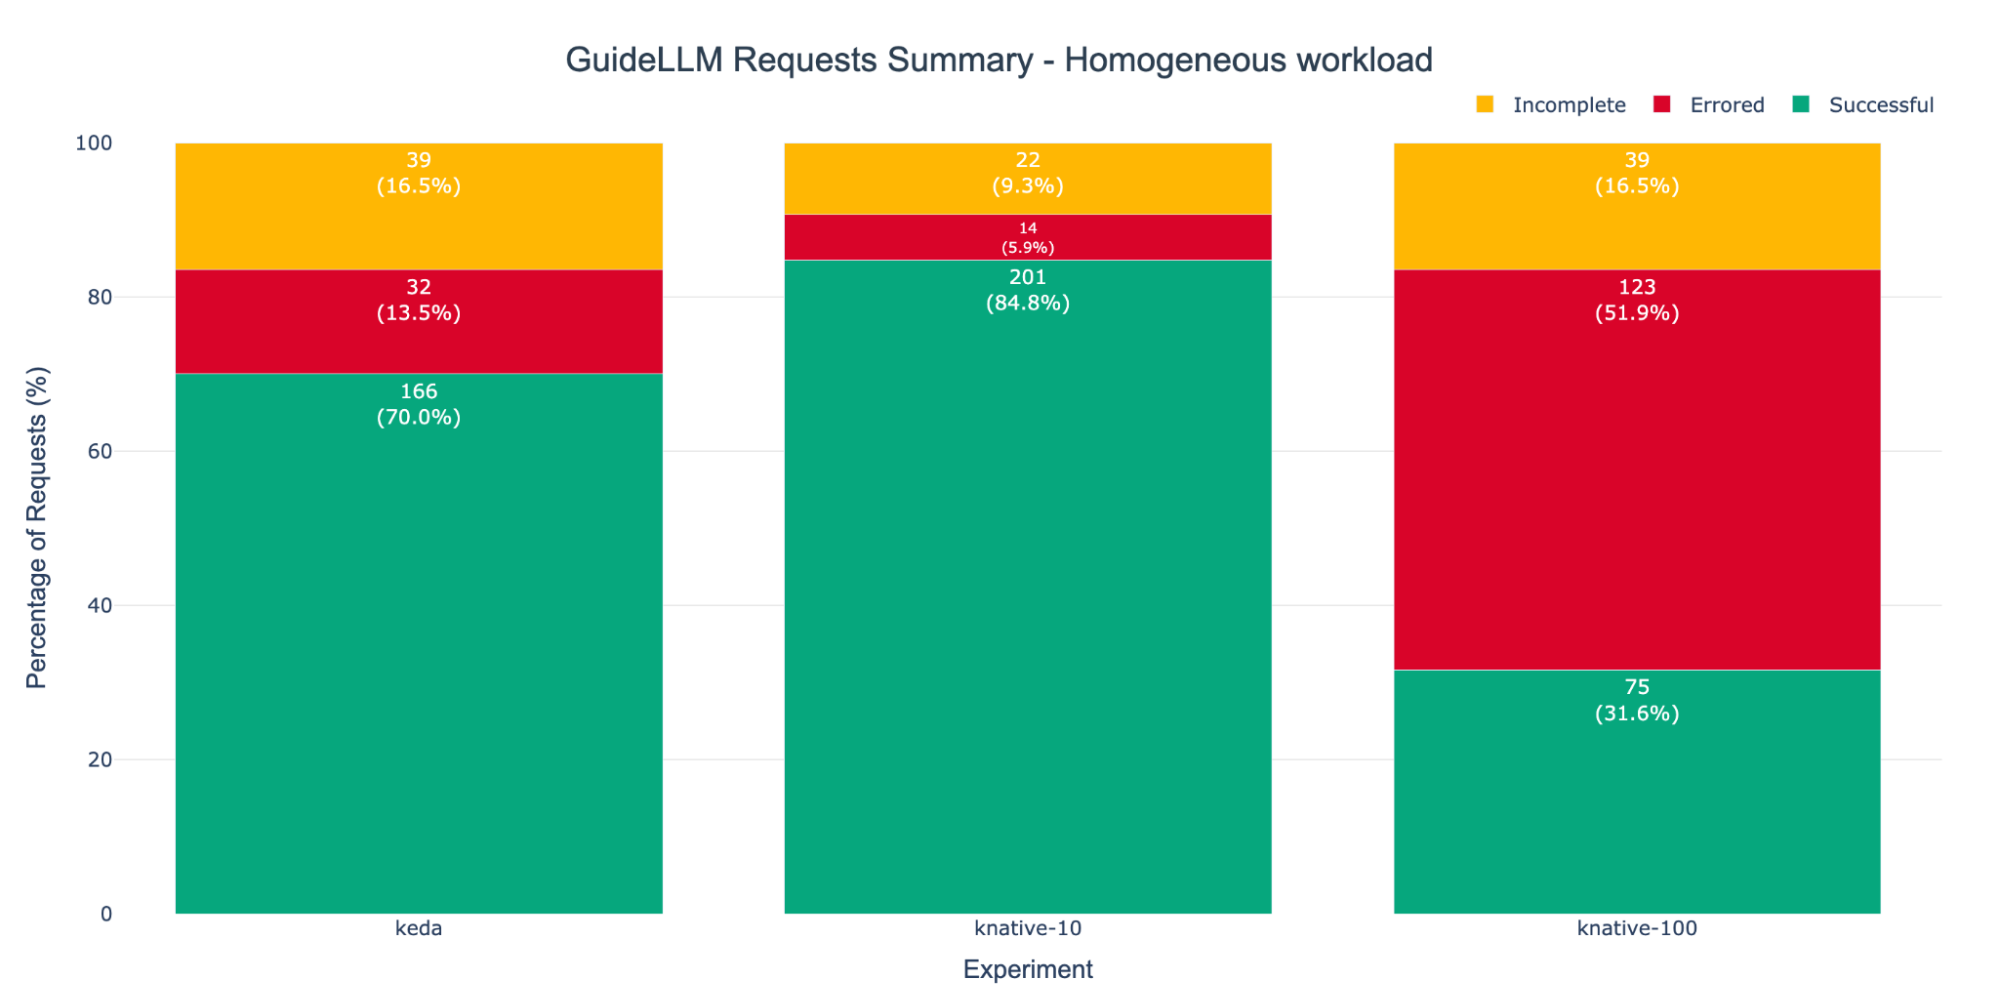
Our analysis under homogeneous workloads demonstrates that while both the KNative-10 and KEDA experiments perform well, the KNative-10 configuration is marginally more stable and achieves a slightly higher request success ratio. Still, the failure of the KNative-100 experiment exposes the KPA's critical drawback: its configuration is not a simple, straightforward process.
The choice of an effective target concurrency is not intuitive and requires a significant prior study of the system's specific performance characteristics. This contrasts sharply with KEDA, which allows the autoscaling trigger to be defined directly by our SLO in the ScaledObject.
Heterogeneous workload performance
Results under homogeneous workloads provide interesting insights, but real-world applications have nuances that require testing with heterogeneous workloads. When input and output sequence lengths are constant, Knative's concurrency-based autoscaling performs very well. However, real-world applications exhibit greater variability in their input and output sequence lengths, which leads to differences in request duration and resource consumption.
Figure 7 illustrates the system-wide ITL for our three configurations, this time subjected to a heterogeneous workload.
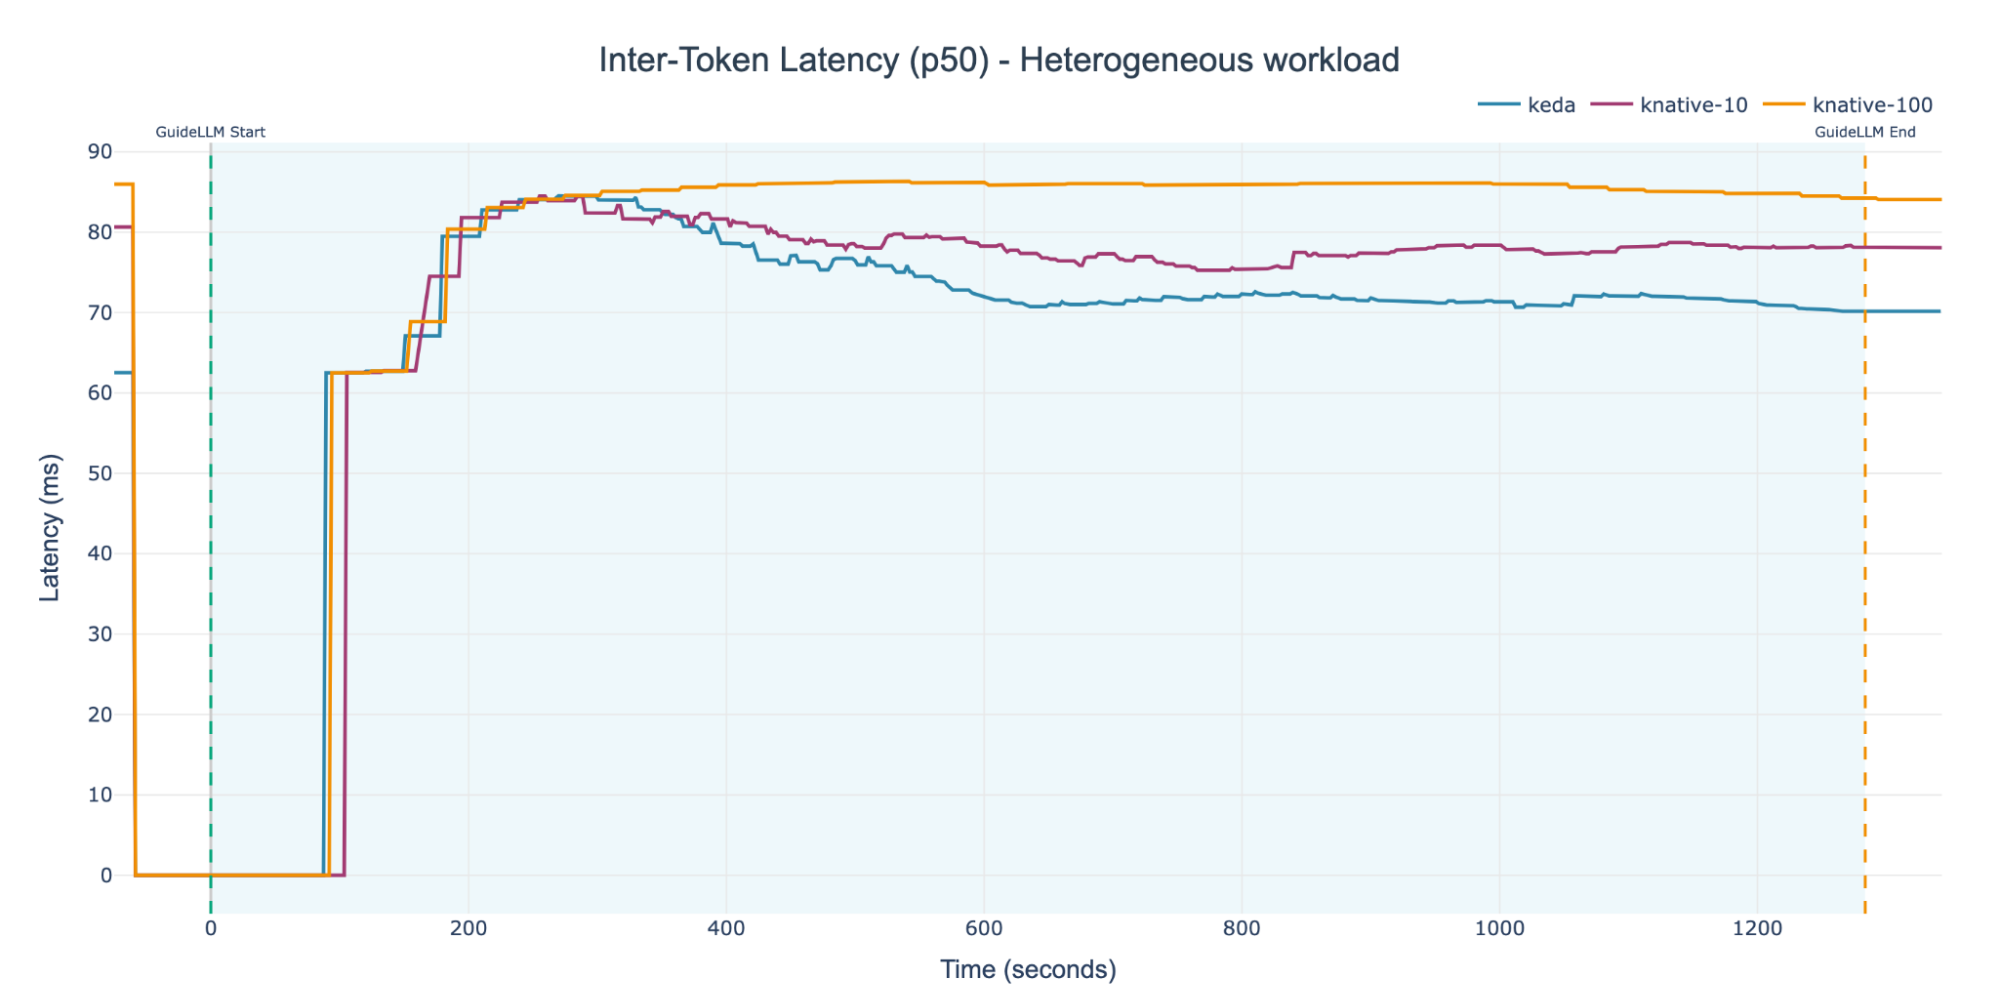
As with the previous tests, the initial ITL is nearly identical across all three setups, which is a direct result of the minimum replica count configuration. However, the KEDA experiment clearly pulls ahead, achieving a low and stable ITL in just under 400 seconds. This result confirms our hypothesis: the concurrency-based KPA does not perform well under heterogeneous loads. It shows degradations of approximately 21% (Knative-100) and 12% (Knative-10), relative to the KServe scenario by the end of the experiment. When sequence lengths vary, concurrency is no longer a reliable way to estimate load.
The performance gap between the two Knative experiments again showcases that the KPA setup is extremely sensitive to its target concurrency configuration.
As with the homogeneous workload, the KNative-100 experiment again failed to trigger any autoscaling events under the heterogeneous workload (Figure 8) achieving an ITL of around 87 ms.
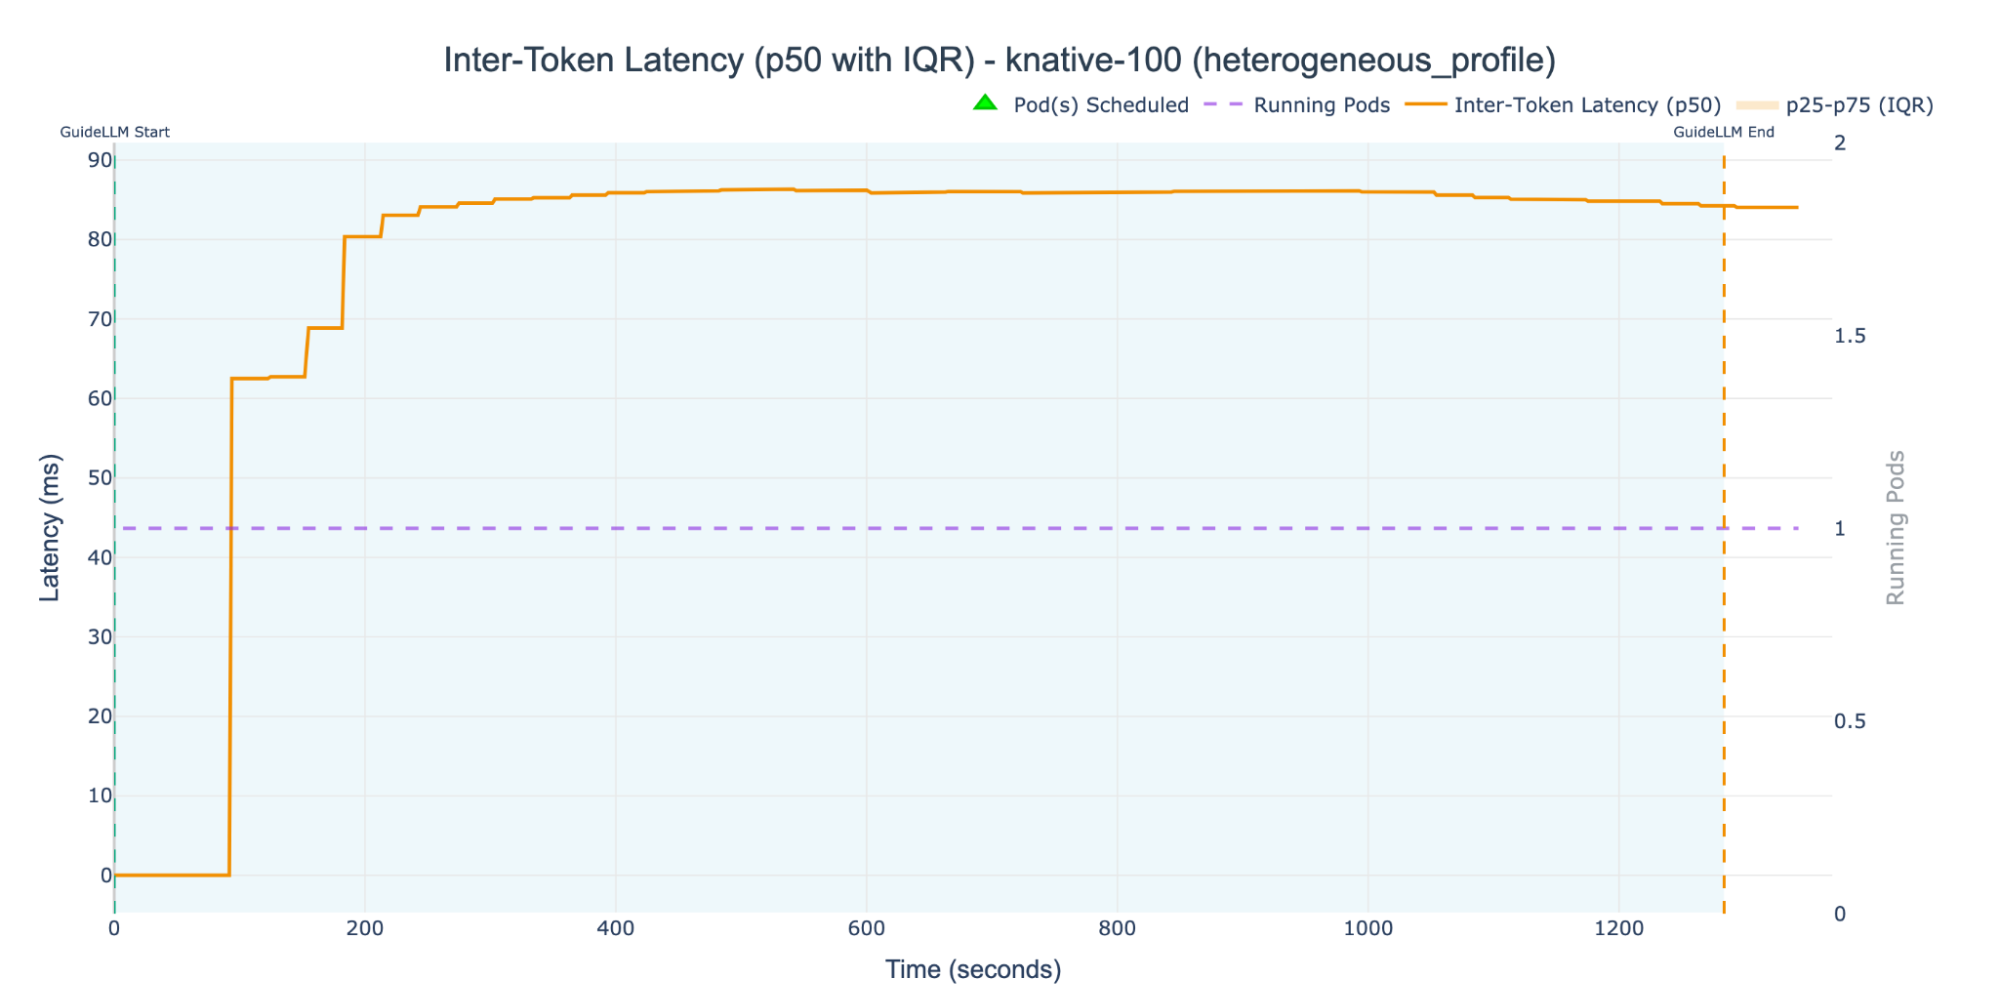
The high concurrency target was never breached, which bottlenecked the entire workload onto a single replica pod. This failure to scale directly resulted in the KNative-100 experiment exhibiting the highest ITL. We will see the full effect of this single-pod limitation on the request success rate in the next section.
In contrast, the KNative-10 experiment, with its lower target concurrency of 10, did successfully trigger autoscaling. As Figure 9 shows, the deployment scaled up to a maximum of five replica pods and managed to keep the ITL below 80 ms for most of the experiment.
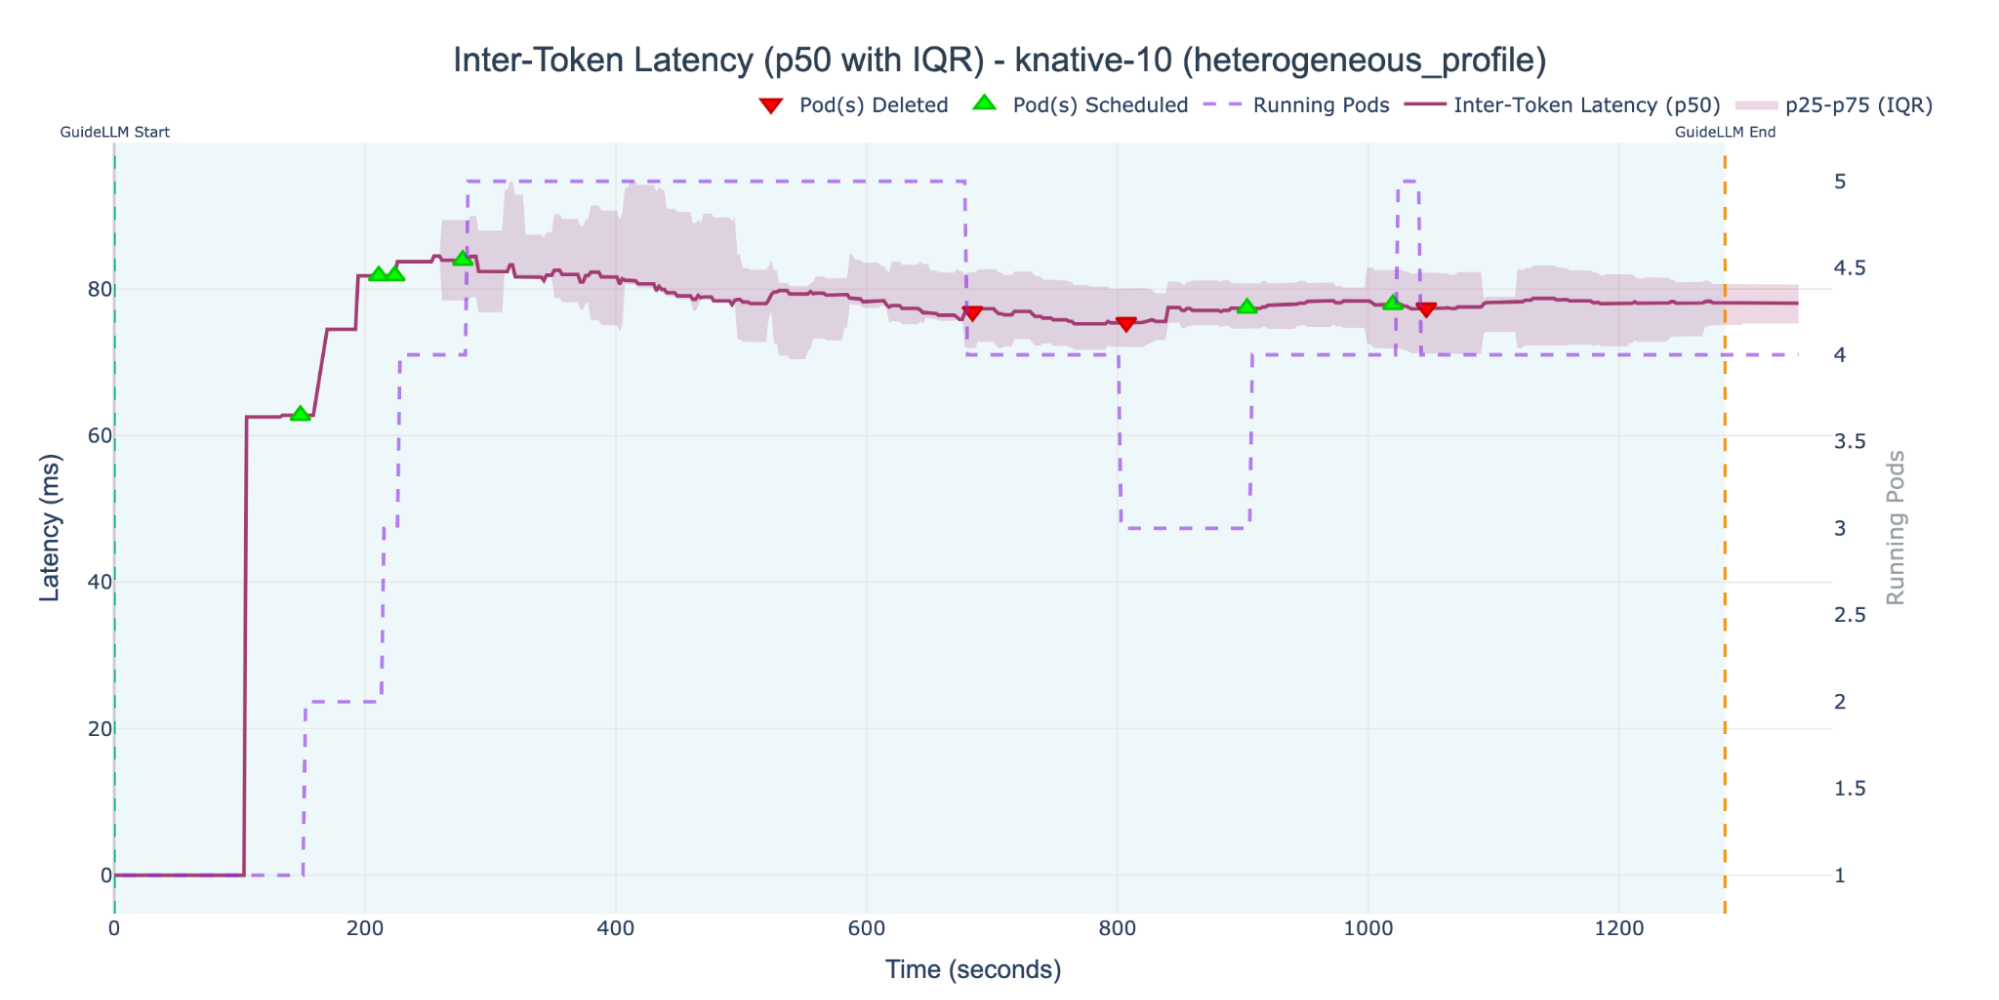
However, this scaling was insufficient given the cluster capacity and highlights the KPA's failure. The deployment stabilized with an ITL just under 80 ms, consistently violating our SLO. Furthermore, the system only scaled to five pods, failing to use the cluster's full capacity. This shows that the KPA's concurrency logic was satisfied, even while the user-facing latency SLO was failing.
The KEDA experiment was the clear winner in this experiment, proving that scaling directly on an SLO is the correct approach for heterogeneous workloads.
Unlike the KPA, which was hampered by its reliance on the flawed proxy of concurrency, KEDA monitored the actual ITL. As Figure 10 shows, this strategy resulted in the lowest median ITL of all tests.
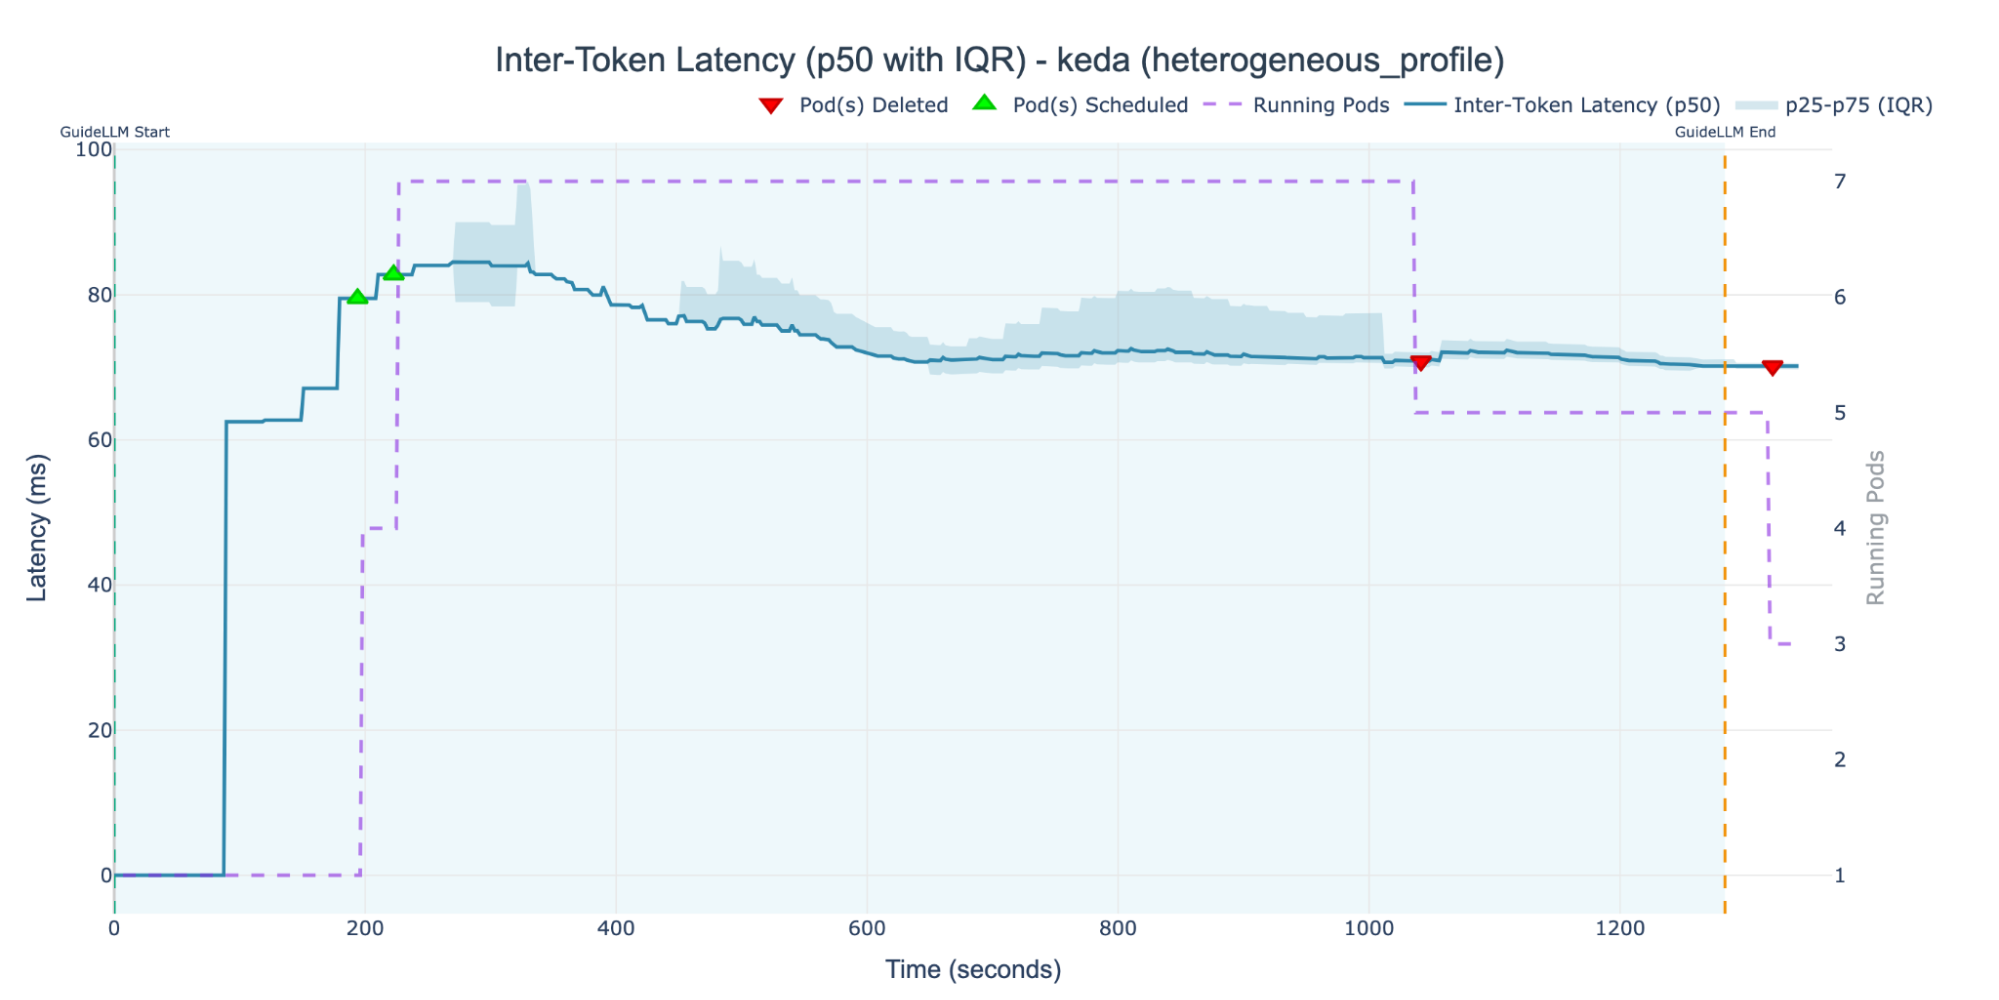
This high performance was achieved because KEDA correctly identified the high load and scaled the deployment to the full cluster capacity of 7 replica pods. The chart shows the autoscaler holding the ITL just above the 70-ms target, which is the intended behavior. This demonstrates a stable control loop, applying just enough resources to prevent the SLO from being significantly breached.
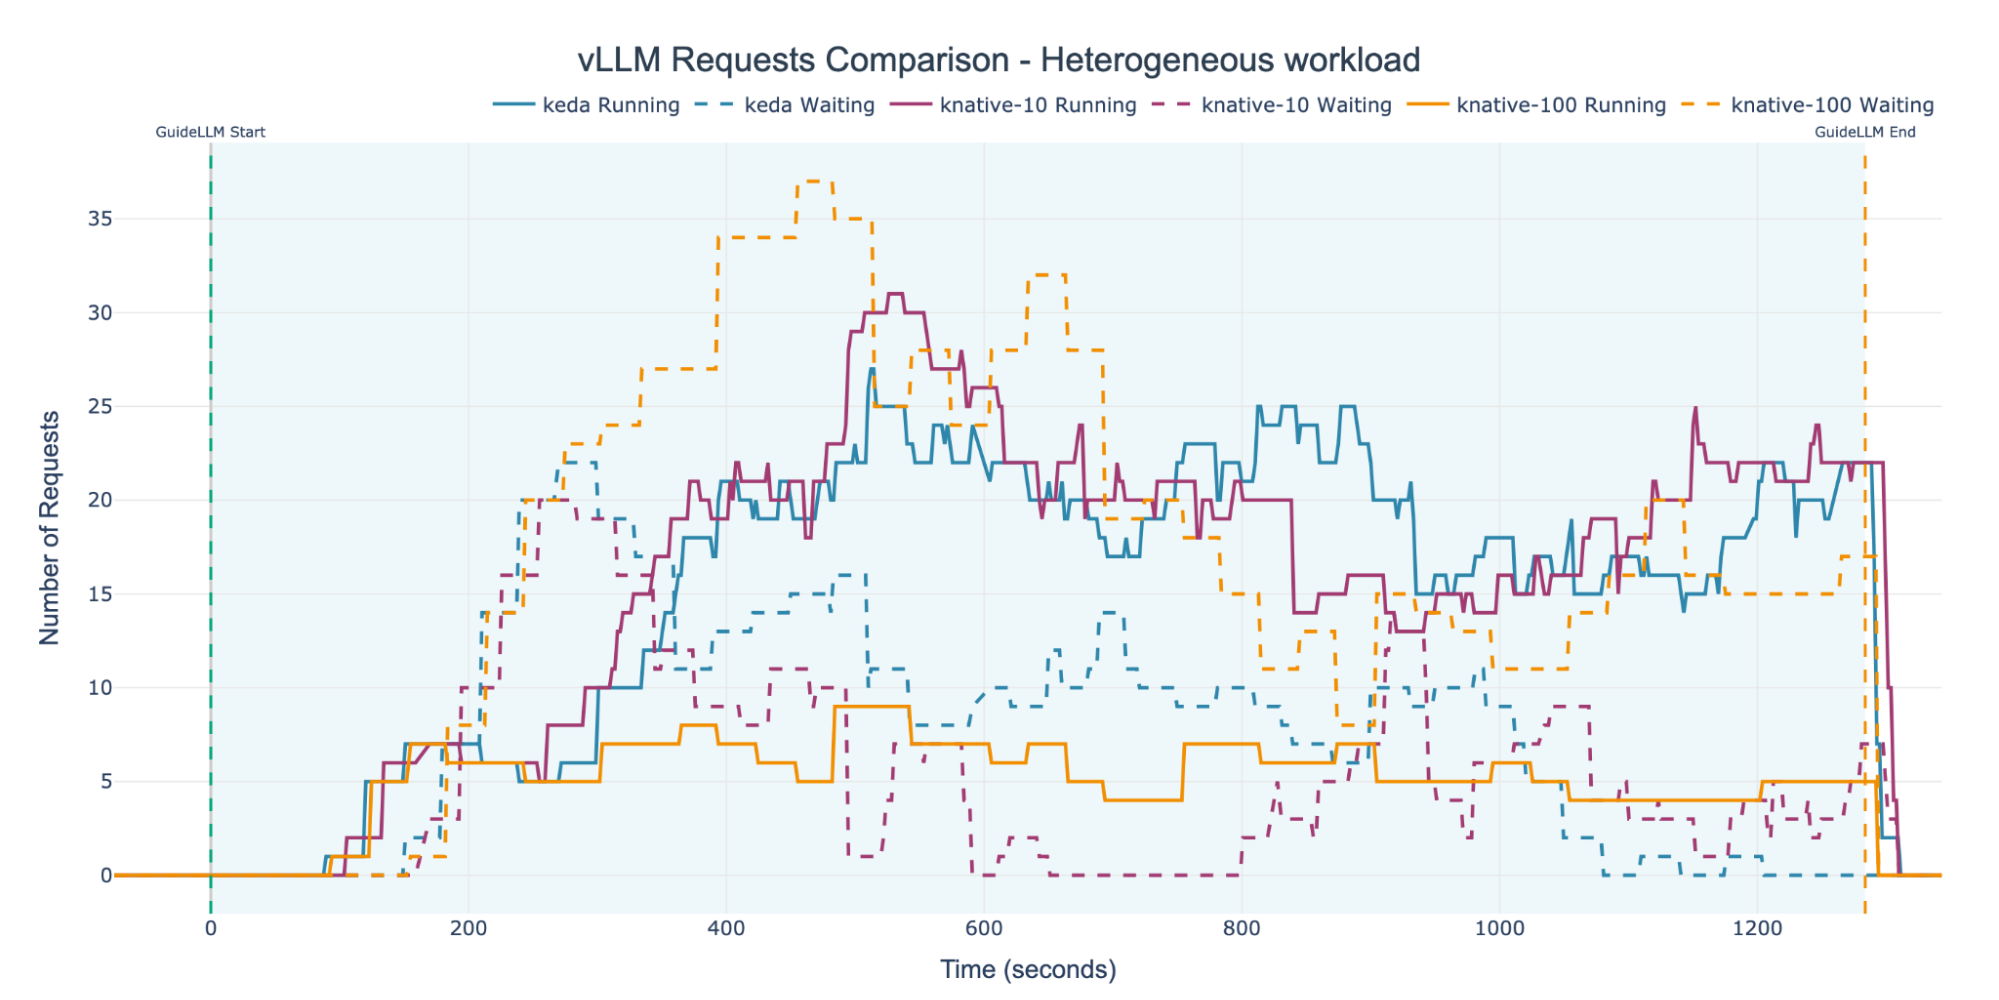
The autoscaling behavior observed in each experiment directly affected request handling and queue depth. Figure 11 shows that the KNative-100 experiment, which failed to scale, accumulated the largest queue of waiting requests. In contrast, the KNative-10 and KEDA experiments, which both scaled actively, exhibited similar and more stable queue patterns.
Finally, Figure 12 represents the request's success metrics reported by GuideLLM. The KNative-100 experiment registered the highest number of error requests. This is an expected outcome, correlating directly with the severe request bottleneck and queue saturation observed in Figure 8 and Figure 11. As stated before, incomplete requests can be disregarded in this analysis.
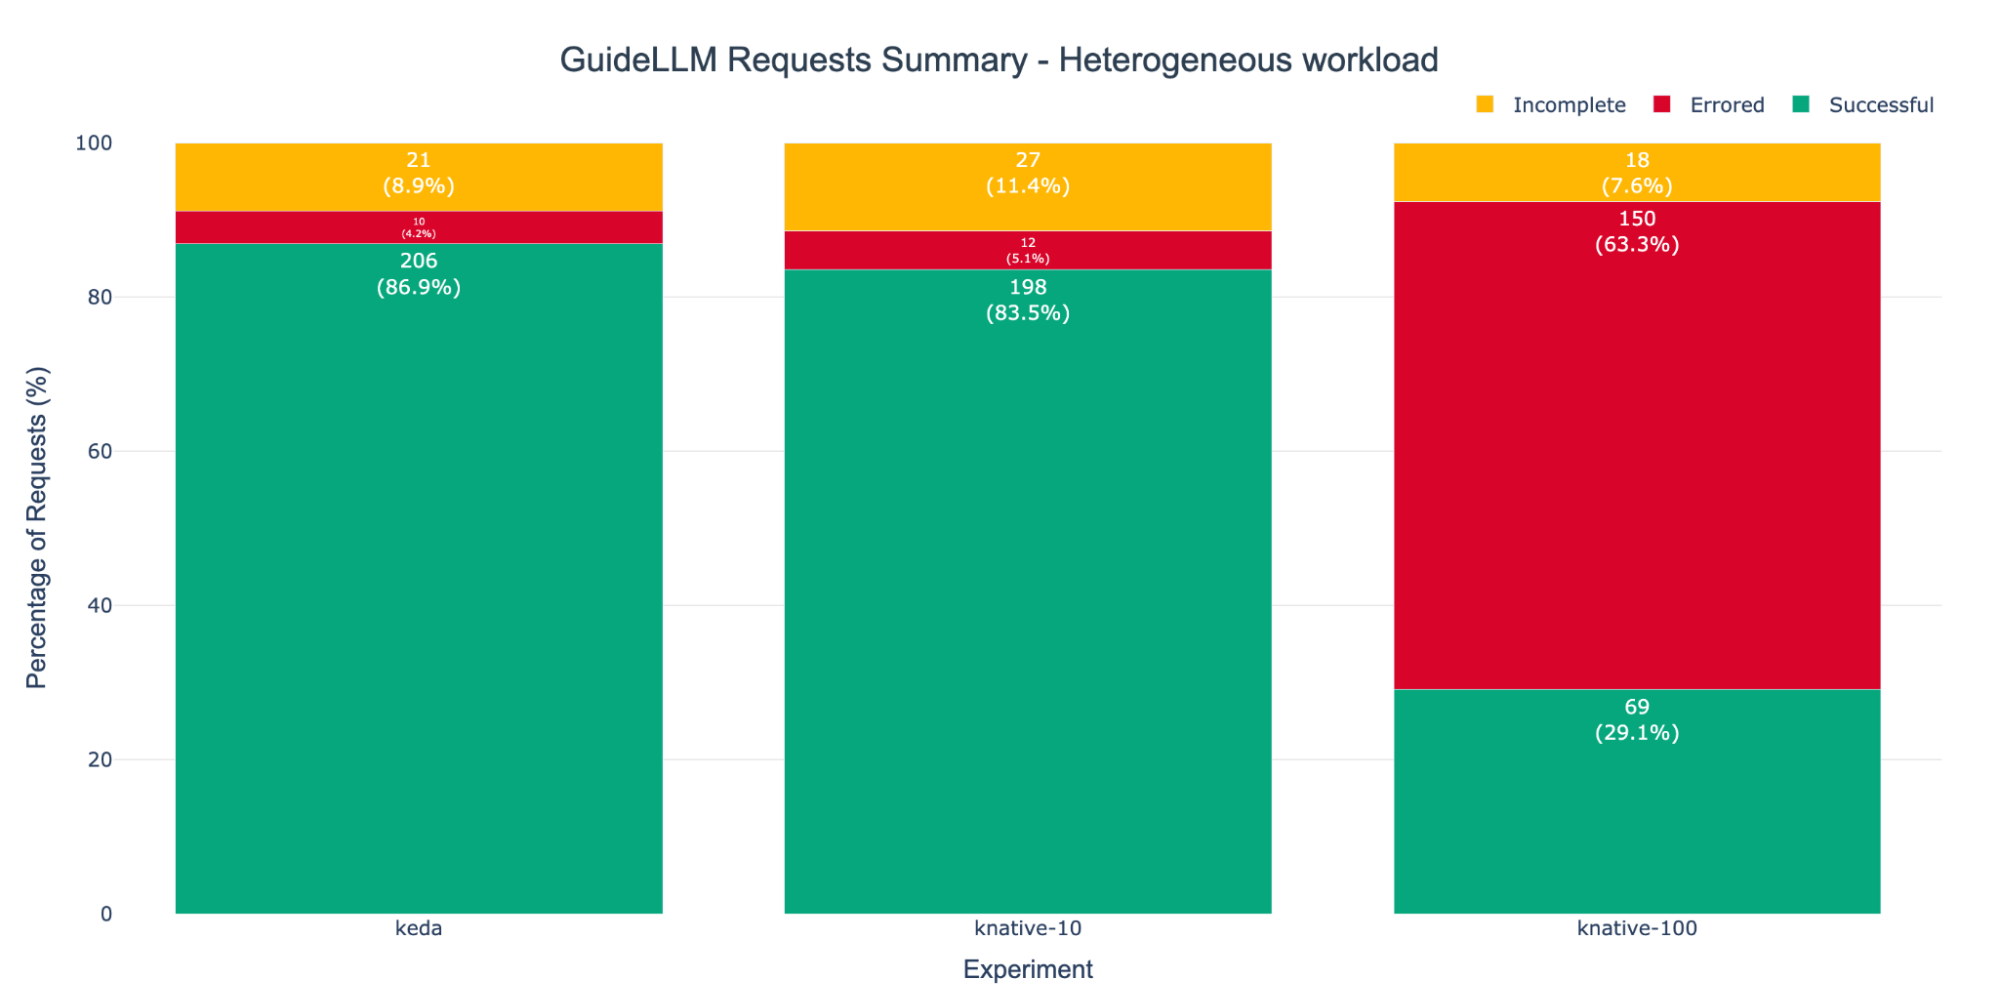
In terms of successful requests, the KNative-10 and KEDA setups performed similarly, with KEDA being slightly ahead this time. This suggests our target concurrency of 10 was coincidentally close to the best value for this specific setup. However, this again highlights the KPA's primary weakness: finding the best value requires extensive, upfront system characterization.
Furthermore, even with a perfect target, concurrency is an unreliable way to estimate load in a heterogeneous workload. This is because it treats all requests as equal. It cannot distinguish between one "light" request and one computationally "heavy" request (for example, a long sequence). A few heavy requests can saturate a pod and breach the latency SLO, even if the KPA still perceives the load as low because the count of requests is below its target.
Conclusions
Our experiments revealed a critical difference between KPA and KServe HPA (KEDA): what works for a predictable, homogeneous workload fails under the variable conditions of a real-world system.
This isn't just a question of performance, but of operational efficiency and time-to-production. The Knative Pod Autoscaler (KPA) is powerful but fragile. It requires extensive, upfront system analysis to find a correct number for the target concurrency—a number that becomes obsolete the moment the model or workload pattern changes.
KEDA, in contrast, offers a more resilient, "set it and forget it" approach. As long as a realistic SLO is defined (that is, something that the actual hardware can deliver), the setup process is simple, and the autoscaler is steady against changes.
Our findings clearly illustrate this trade-off:
- Under a homogeneous workload: A finely-tuned KPA (our
KNative-10test) was the most stable configuration, proving that if you can predict your load, you can optimize for it. However, theKNative-100test failed completely, proving the KPA is highly sensitive and requires significant benchmarking. - Under a heterogeneous workload: This real-world test exposed the KPA's fundamental flaw: concurrency is a poor proxy for load. Our
KNative-10setup failed, scaling to only 5 of 7 pods while consistently breaching our SLO. It couldn't detect that a few computationally heavy requests (for example, long sequences) were saturating the system.
By scaling directly on the ITL SLO (with our added insights from cache and queue metrics), KEDA correctly identified the true system load, scaled to use the full cluster capacity, and successfully held the latency at around our 70-ms target.
This leads to the most critical business impact: wasted resources. In our tests, the KPA left 30% of our cluster capacity idle while failing its performance targets.
Modern AI infrastructure, especially accelerators like GPUs, is expensive. An autoscaler that cannot intelligently and dynamically use all available hardware isn't just a technical failure; it's a financial one. A poor scaling strategy means you are losing money on idle capacity while also delivering a poor quality of service.
Looking ahead
While our results point toward an SLO-based strategy, this approach introduces its own set of critical tuning parameters. For instance, the metrics aggregation time window is a key lever that dictates the system's sensitivity. A short window might cause the autoscaler to overreact to temporary spikes (known as flapping), while a long window might dampen the response so much that it fails to stop a genuine SLO violation in time.
Beyond this, the Prometheus queries used to compute the SLIs themselves offer significant opportunities for enrichment. Rather than simply measuring the current state, these queries can incorporate predictive elements, such as rate-of-change calculations or trend analysis. This allows for proactive autoscaling that anticipates demand before SLO violations occur. This can help move the thinking from purely reactive autoscaling (responding to violations) towards an anticipatory approach that provisions resources ahead of need.
Further investigation is needed to understand the complex interplay between KEDA's pollingInterval, the HPA's cooldownPeriod, and stabilizationWindowSeconds, and the specific metric chosen. Our use of a p50 (median) ITL might not be as effective as a p90 or p95 target. How to best combine multiple triggers, such as GPU utilization, queue length, and latency, remains a deep field for further study to achieve optimal performance and efficiency.
