In this article, I will demonstrate how to monitor Red Hat Ansible Automation Platform running on premises using Prometheus, node_exporter, and Grafana.
This tutorial uses the following versions:
- Red Hat Enterprise Linux 9.4
- Prometheus 2.53
- Node Exporter 1.8.1
- Grafana 11.1.0
- Red Hat Ansible Automation Platform v4.5.7
Procedure
Follow these steps to install and configure Prometheus, Node Exporter and Grafana, which will be the stack used to monitor our Ansible Automation Platform.
Let's start by installing and configuring Prometheus.
Prometheus
Let's download the most updated version of Prometheus:
curl -LO https://github.com/prometheus/prometheus/releases/download/v2.53.0/prometheus-2.53.0.linux-amd64.tar.gzHere we will unzip and rename our directory for ease of use:
tar -xvf prometheus-2.53.0.linux-amd64.tar.gz
mv -v prometheus-2.53.0.linux-amd64 prometheus
Create the prometheus user, create the main directories and set the prometheus user as owner:
useradd --no-create-home --shell /bin/false prometheus
id prometheus
mkdir -v /etc/prometheus
mkdir -v /var/lib/prometheus
chown prometheus:prometheus /etc/prometheus
chown prometheus:prometheus /var/lib/prometheus
Copy the prometheus and promtool binaries to the binary path and set the owner:
cp -v ~/prometheus/{prometheus,promtool} /usr/local/bin/
chown prometheus:prometheus /usr/local/bin/{prometheus,promtool}
Copy the Prometheus web UI files to /etc/prometheus:
cp -rpaiv ~/prometheus/{consoles,console_libraries} /etc/prometheus/
chown -R prometheus:prometheus /etc/prometheus/{consoles,console_libraries}
Create our configuration file with our first job:
cat <<EOF > /etc/prometheus/prometheus.yml
global:
  scrape_interval: 10s

scrape_configs:
  - job_name: 'prometheus'
    scrape_interval: 5s
    static_configs:
      - targets: ['192.168.0.189:9090'] # Prometheus Server IP Address
EOF

chown prometheus:prometheus /etc/prometheus/prometheus.yml
Create a service for our Prometheus and start the service:
cat <<EOF > /etc/systemd/system/prometheus.service
[Unit]
Description=Prometheus
Wants=network-online.target
After=network-online.target

[Service]
User=prometheus
Group=prometheus
Type=simple
ExecStart=/usr/local/bin/prometheus \
--config.file /etc/prometheus/prometheus.yml \
--storage.tsdb.path /var/lib/prometheus/ \
--web.console.templates=/etc/prometheus/consoles \
--web.console.libraries=/etc/prometheus/console_libraries

[Install]
WantedBy=multi-user.target
EOF

# enable and start prometheus service                                                                                                                    systemctl daemon-reload
systemctl enable prometheus
systemctl start prometheus
Add a rule in firewall-cmd to release port 9090, which is the default port for prometheus:
firewall-cmd --zone=public --add-port=9090/tcp --permanent
firewall-cmd --reload
Node Exporter
Note
Perform the following steps on the Ansible Automation Platform server.
Now, let's download and install the latest version of Node Exporter:
curl -LO https://github.com/prometheus/node_exporter/releases/download/v1.8.1/node_exporter-1.8.1.linux-amd64.tar.gzHere we will unzip and rename our directory for ease of use:
tar -xvf node_exporter-1.8.1.linux-amd64.tar.gz
mv -v node_exporter-1.8.1.linux-amd64 node_exporter
Create the node_exporter user, create the main directories and set the node_exporter user as owner:
useradd --no-create-home --shell /bin/false node_exporter
id node_exporter
cp -v ~/node_exporter/node_exporter /usr/local/bin/
chown node_exporter:node_exporter /usr/local/bin/node_exporter
Create a service for our node_exporter and start the service:
cat <<EOF > /etc/systemd/system/node_exporter.service
[Unit]
Description=Node Exporter
After=network.target

[Service]
User=node_exporter
Group=node_exporter
Type=simple
ExecStart=/usr/local/bin/node_exporter

[Install]
WantedBy=multi-user.target
EOF

# enable and start node_exporter service
systemctl daemon-reload
systemctl enable node_exporter
systemctl start node_exporter
Now let's add a rule in firewall-cmd to release port 9100, which is the default port for node_exporter:
firewall-cmd --zone=public --add-port=9100/tcp --permanent
firewall-cmd --reload
On the monitoring server, let's add a new job at the end of the file for our node_exporter and restart the prometheus service:
cat <<EOF >> /etc/prometheus/prometheus.yml

  - job_name: 'aap_node_exporter_metrics'
    scrape_interval: 5s
    static_configs:
      # AAP Server
      - targets: ['aap.lab.laraujo.com.br:9100']
EOF

# restart the prometheus service
systemctl restart prometheus
Grafana
Note
Perform the following steps on the monitoring server.
Let's install Grafana. For this, we will use the official repository, and we will start by importing the gpg key:
wget -q -O gpg.key https://rpm.grafana.com/gpg.key
rpm --import gpg.key
Create the grafana.repo file and install the package:
cat <<EOF > /etc/yum.repos.d/grafana.repo
[grafana]
name=grafana
baseurl=https://rpm.grafana.com
repo_gpgcheck=0
enabled=1
gpgcheck=0
gpgkey=https://rpm.grafana.com/gpg.key
sslverify=1
sslcacert=/etc/pki/tls/certs/ca-bundle.crt
EOF

# install grafana                                                                                                                                                                                                                                                                         dnf -y install grafana
Start the grafana-server service:
systemctl enable grafana-server
systemctl start grafana-server
systemctl status grafana-server
Now let's add a rule in firewall-cmd to release port 3000, which is the default port for grafana-server:
firewall-cmd --zone=public --add-port=3000/tcp --permanent
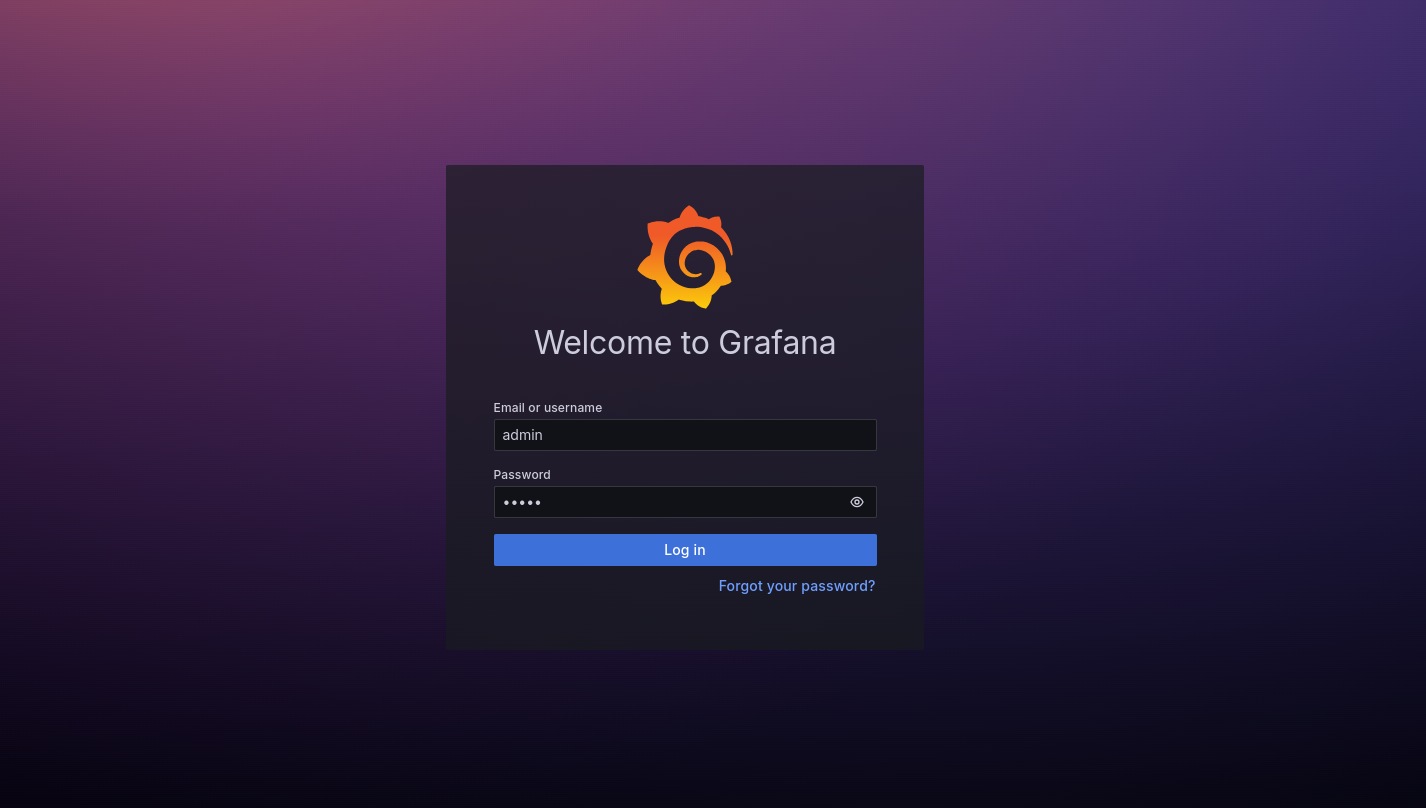
firewall-cmd --reloadFor our first access, use the following format: http://<IP Address or FQDN>:3000.
Note
The login and password used for first access must be Username: admin and Password: grafana.
Figure 1 shows the Grafana welcome screen.
Now in the grafana.ini file, enable the provisioning parameter and modify the path to /etc/grafana/provisioning:
vim /etc/grafana/grafana.ini
                                                                                                                                                                                                                                                                                                                            from:
;provisioning = conf/provisioning
                                                                                                                                                                                                                                                                                                                            to:
provisioning = /etc/grafana/provisioning
We will integrate Grafana and Prometheus, creating a datasource that will consume Prometheus metrics. For this we will create a prometheus.yaml file in the provisioning path /etc/grafana/provisioning/datasources:
cat <<EOF > /etc/grafana/provisioning/datasources/prometheus.yaml
apiVersion: 1
datasources:
- name: Prometheus
type: prometheus
orgId: 1
# IP Address or FQDN of the Monitoring Server
url: http://prom.lab.laraujo.com.br:9090
jsonData:
"tlsSkipVerify": true
isDefault: true
editable: true
EOF
# Set the owner to the grafana user and restart the grafana service
chown :grafana /etc/grafana/provisioning/datasources/prometheus.yaml
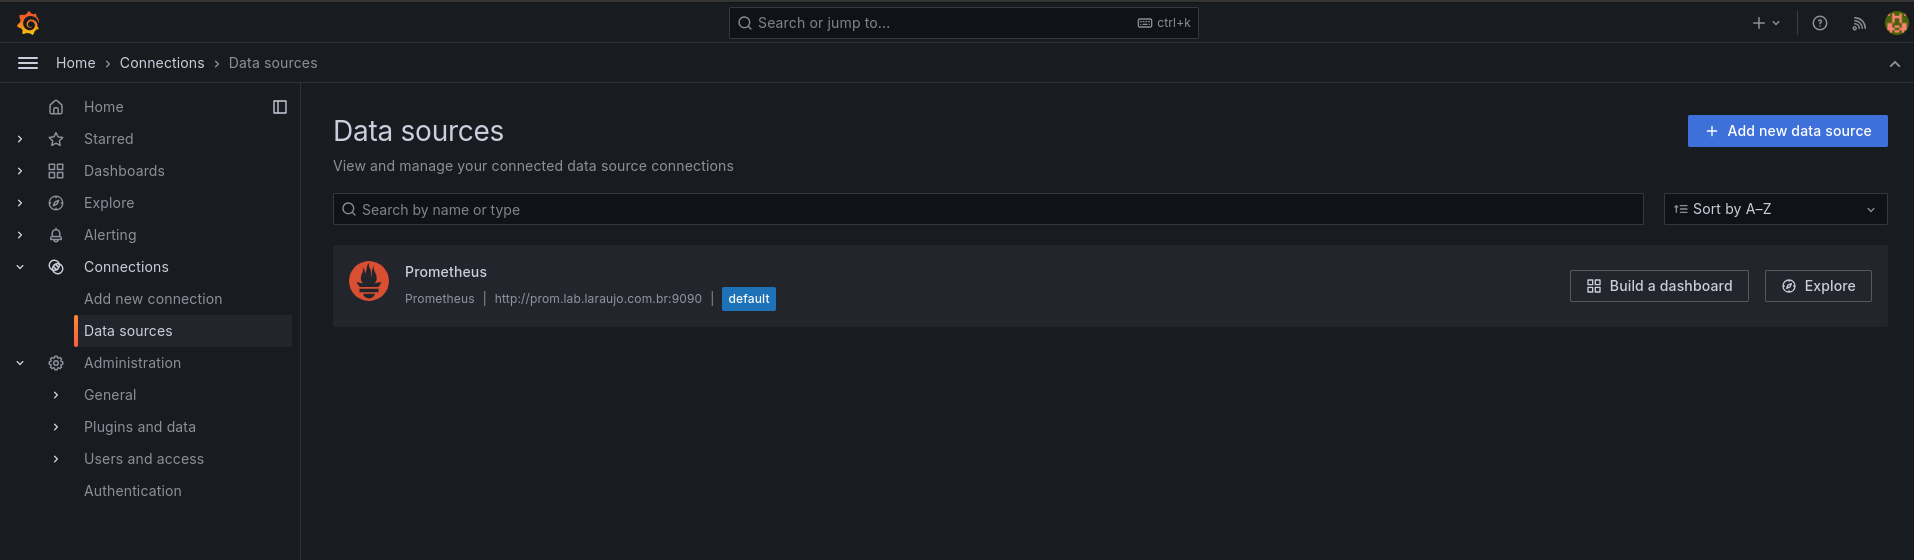
systemctl restart grafana-server.serviceTo validate the creation of our data source, in the Grafana console, go to Connections → Data sources, as shown in Figure 2.
Ansible Automation Platform integration
Now we are going to integrate Ansible Automation Platform with Prometheus. With this integration, Prometheus will consume the API metrics context /api/v2/metrics. For this, we will create a user in Ansible Automation Platform who will be responsible for generating the token and providing this integration.
- In Ansible Automation Platform , in the left side menu, go to Access → Users → Add.
- Define a name and username that facilitates identification; here we will use
aap-metrics. - Set a password and confirm.
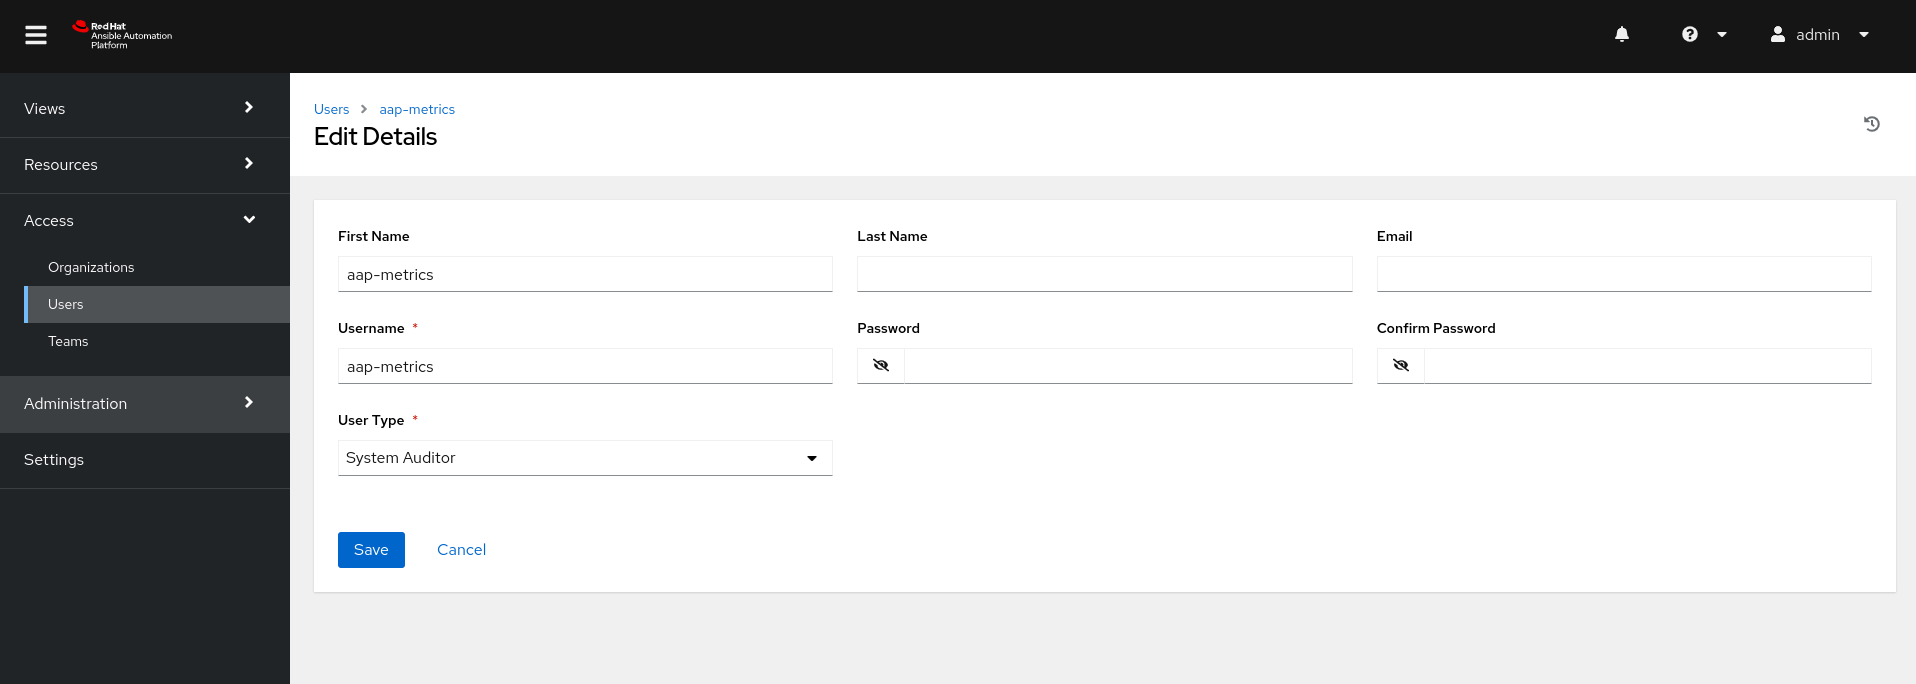
In User Type, select System Auditor and Save (Figure 3).
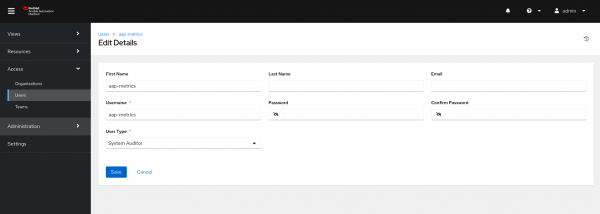
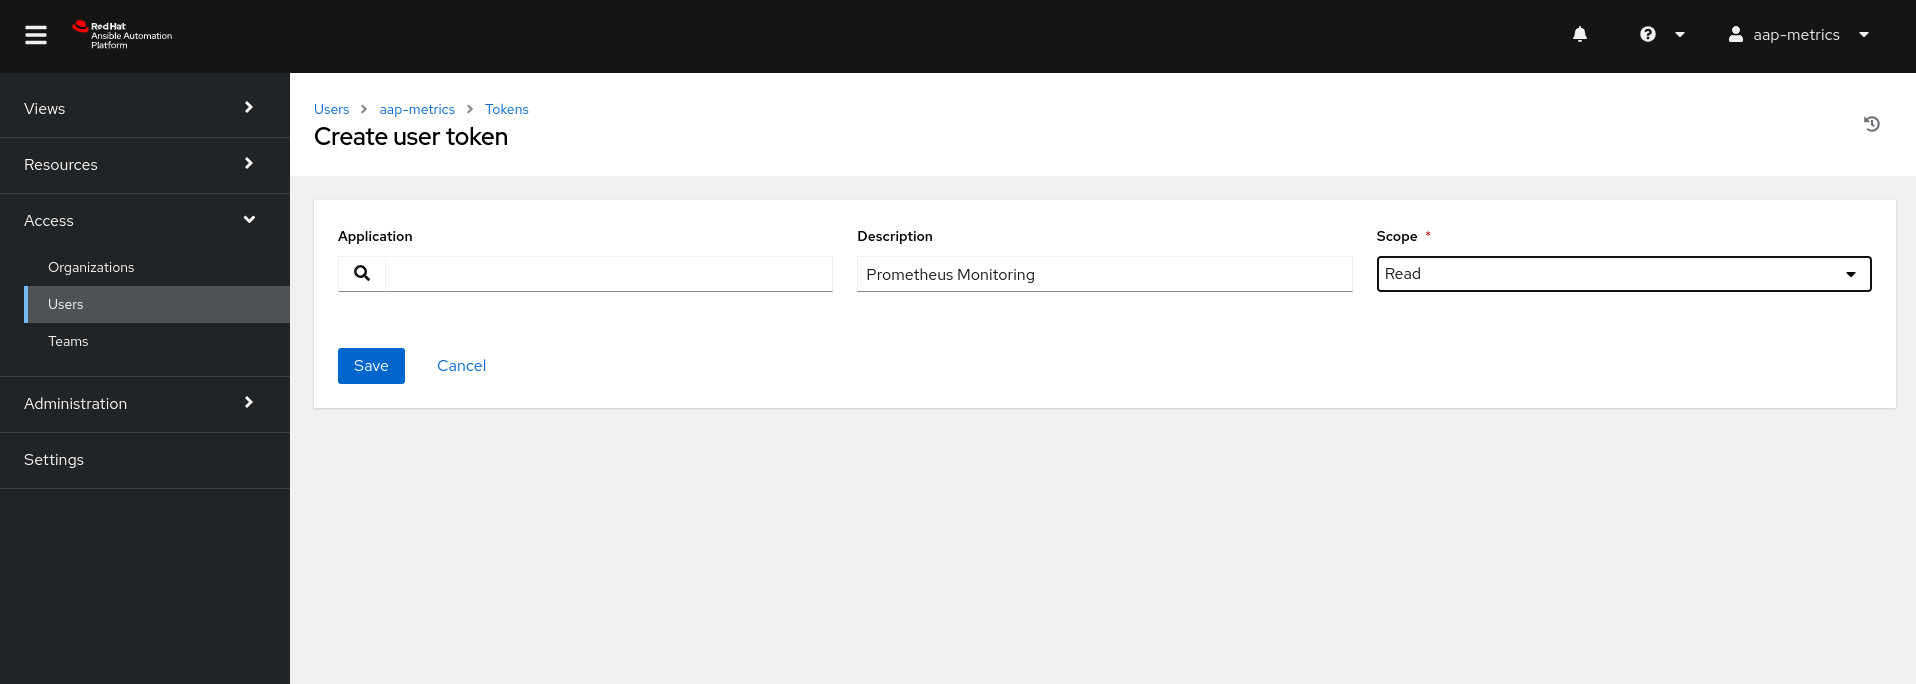
Figure 3: Create new user in Ansible Automation Platform. - Now log out and connect with the user you just created. Go to Access → Users → click on the username → Tokens → Add.
- Set a Description and Scope to Read.
Save and copy the generated token (Figure 4).

Figure 4: Create user token.
Now on the monitoring server, let's add a new Job to prometheus.yml, modify the bearer_token generated by the aap-metrics user, and add the Ansible Automation Platform endpoint in targets:
cat <<EOF >> /etc/prometheus/prometheus.yml
- job_name: 'aap-controller'
# api metrics path
metrics_path: /api/v2/metrics
scrape_interval: 5s
scheme: https
tls_config:
insecure_skip_verify: true
# aap-metrics user token
bearer_token: xxxxxxxxxxxxxxxxx
static_configs:
# AAP Endpoint
- targets: ['aap.lab.laraujo.com.br']
EOF
# Restart the prometheus service
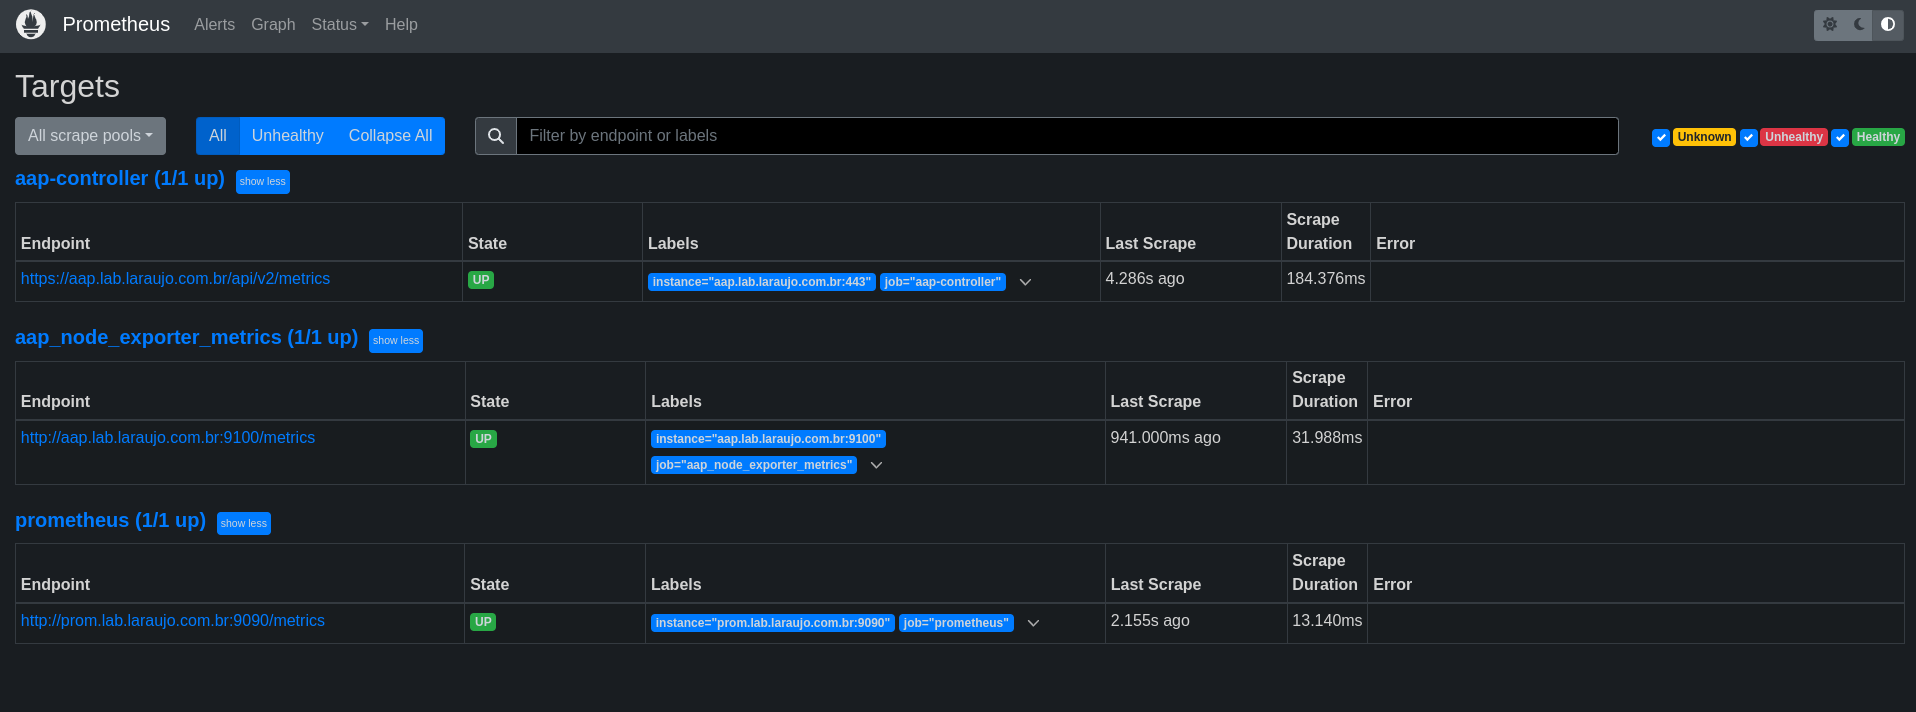
systemctl restart prometheusTo validate your jobs, go to Status → Targets in the Prometheus console. You should have 3 targets created, as shown in Figure 5.
Grafana dashboard
Now let's import the dashboard into Grafana and start monitoring our Ansible Automation Platform. Download and save aap-metrics.json file in the provisioning directory:
# access the proviosining/dashboards directory
cd /etc/grafana/provisioning/dashboards/

# create a directory called AAP
mkdir -v AAP

# download
curl -L https://raw.githubusercontent.com/leoaaraujo/articles/master/aap-nodeexporter-grafana/files/aap-metrics.json -o AAP/aap-metrics.json

# change owner
chown :grafana AAP/aap-metrics.json
Now let's create an aap-metrics.yaml file that will allow the automatic provisioning of our dashboard in Grafana:
cat <<EOF > /etc/grafana/provisioning/dashboards/aap-metrics.yaml
apiVersion: 1
providers:
  - name: AAP-Metrics
    folder: AAP
    type: file
    options:
      # Path where our aap-metrics.json file is saved
      path:
        /etc/grafana/provisioning/dashboards/AAP
EOF

# change owner
chown :grafana /etc/grafana/provisioning/dashboards/aap-metrics.yaml

# restart the grafana-server service
systemctl restart grafana-server.service
To validate that our dashboard was provisioned correctly, in the Grafana console, click Dashboards in the left-hand menu. We will have our dashboard provisioned in a folder called AAP (Figure 6).

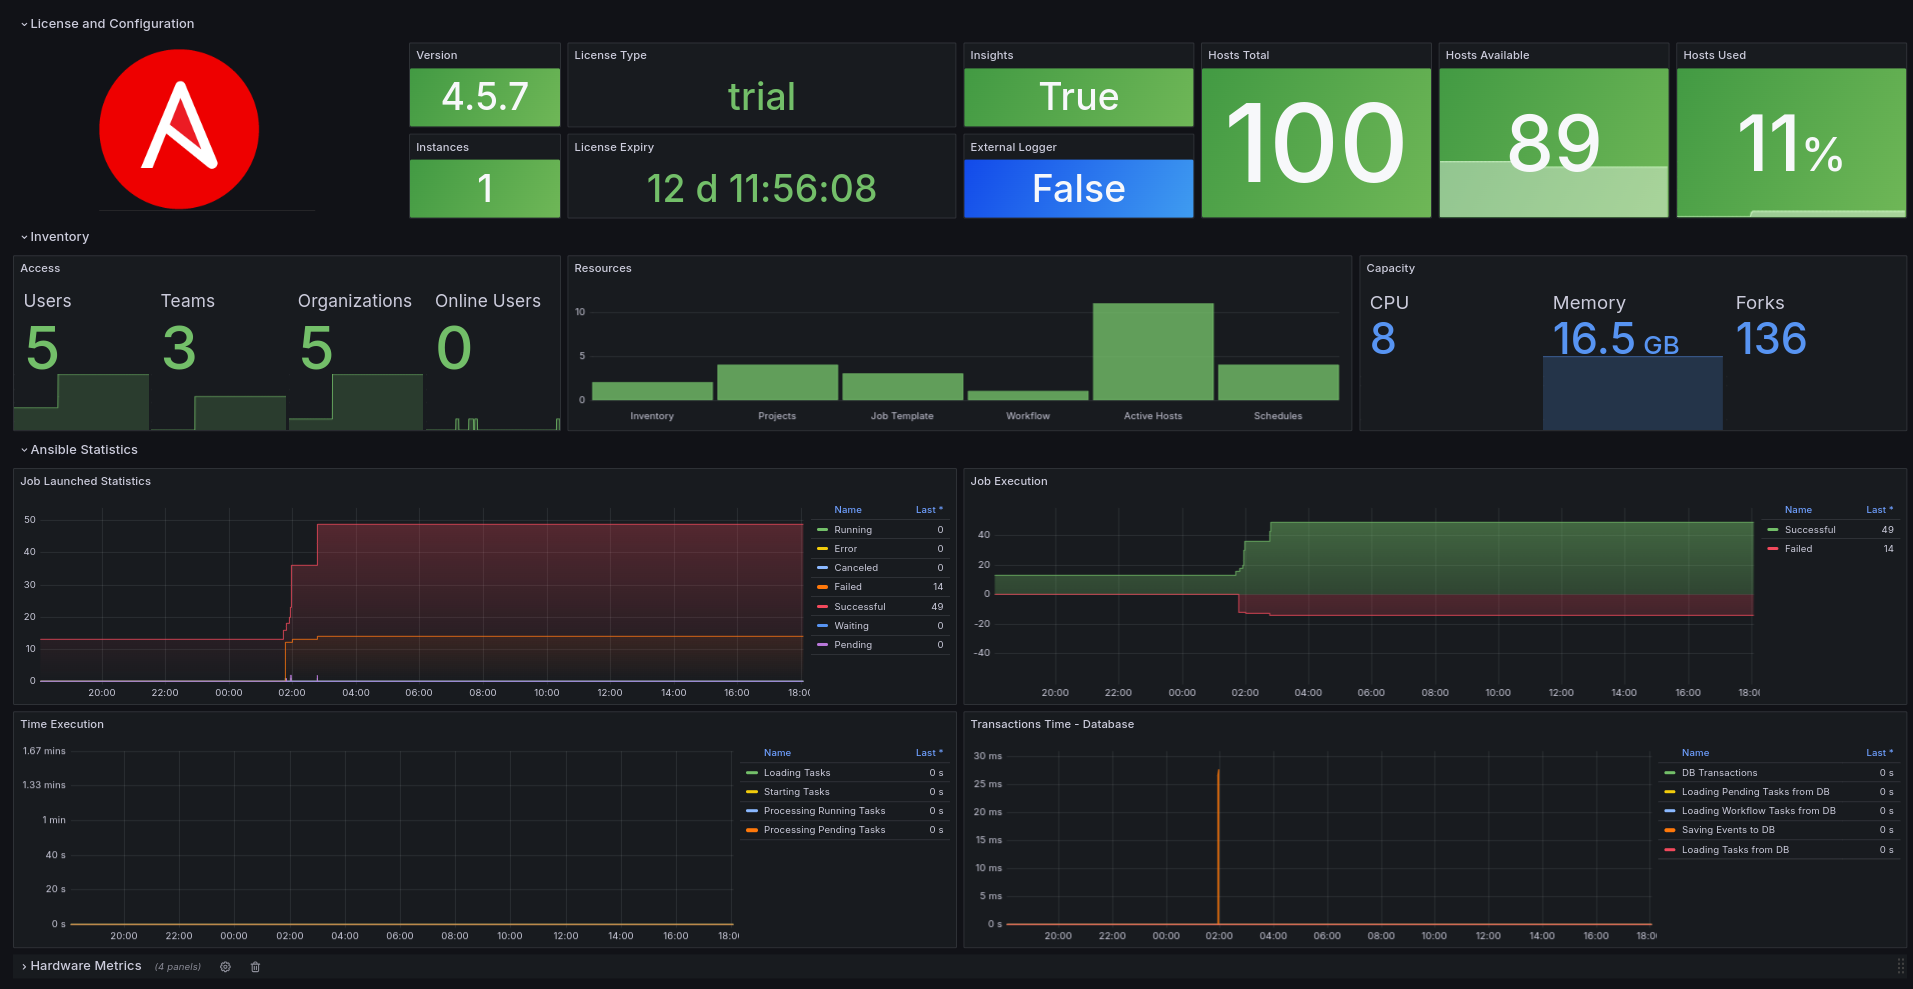
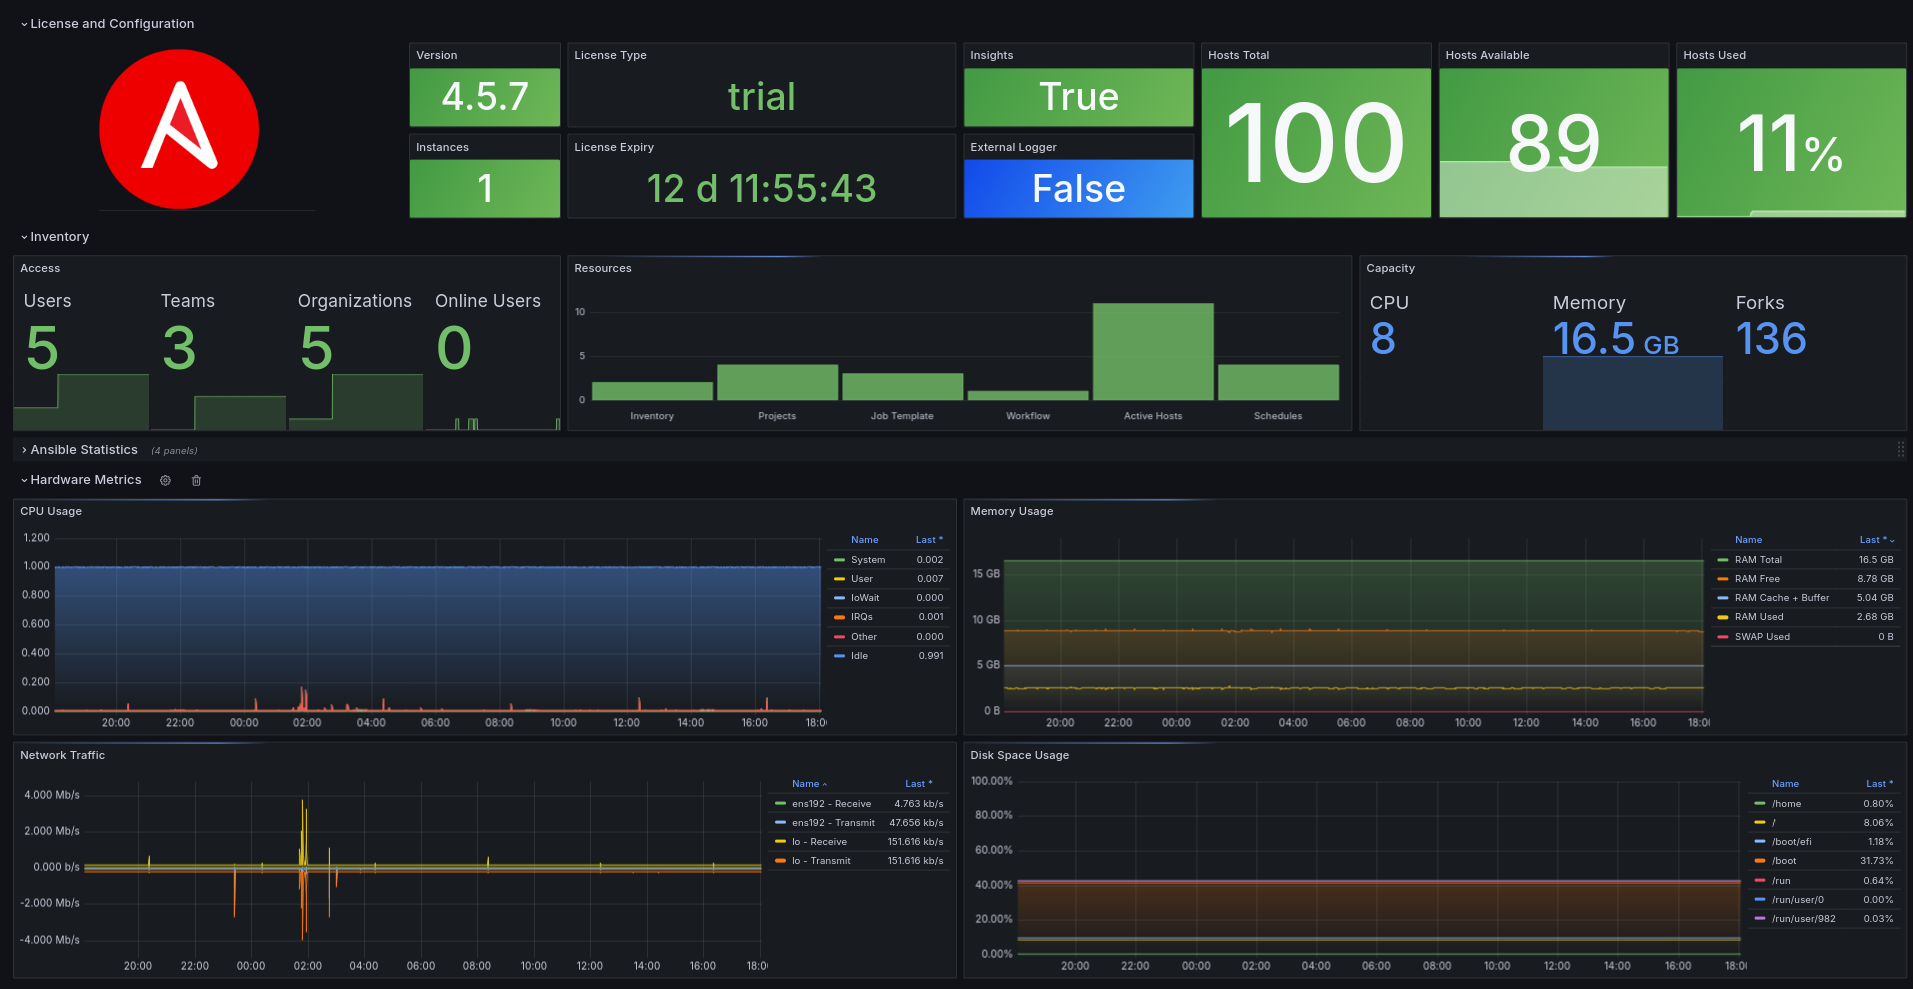
To view the dashboard, click on the dashboard name (Figure 7 and 8).
Conclusion
The Prometheus, Node Exporter, and Grafana stack offers a complete view for monitoring Ansible Automation Platform. Using the integration with the Ansible Automation Platform API, you can have a view of the day-to-day use of resources such as jobs, templates, and failed or successful executions. Node Exporter lets you create a visualization of capacity and consumption of computational resources.
