Redhat Developers  Logo
  • Products

    Featured

    • Red Hat Enterprise Linux
      Red Hat Enterprise Linux Icon
    • Red Hat OpenShift AI
      Red Hat OpenShift AI
    • Red Hat Enterprise Linux AI
      Linux icon inside of a brain
    • Image mode for Red Hat Enterprise Linux
      RHEL image mode
    • Red Hat OpenShift
      Openshift icon
    • Red Hat Ansible Automation Platform
      Ansible icon
    • Red Hat Developer Hub
      Developer Hub
    • View All Red Hat Products
    • Linux

      • Red Hat Enterprise Linux
      • Image mode for Red Hat Enterprise Linux
      • Red Hat Universal Base Images (UBI)
    • Java runtimes & frameworks

      • JBoss Enterprise Application Platform
      • Red Hat build of OpenJDK
    • Kubernetes

      • Red Hat OpenShift
      • Microsoft Azure Red Hat OpenShift
      • Red Hat OpenShift Virtualization
      • Red Hat OpenShift Lightspeed
    • Integration & App Connectivity

      • Red Hat Build of Apache Camel
      • Red Hat Service Interconnect
      • Red Hat Connectivity Link
    • AI/ML

      • Red Hat OpenShift AI
      • Red Hat Enterprise Linux AI
    • Automation

      • Red Hat Ansible Automation Platform
      • Red Hat Ansible Lightspeed
    • Developer tools

      • Red Hat Trusted Software Supply Chain
      • Podman Desktop
      • Red Hat OpenShift Dev Spaces
    • Developer Sandbox

      Developer Sandbox
      Try Red Hat products and technologies without setup or configuration fees for 30 days with this shared Openshift and Kubernetes cluster.
    • Try at no cost
  • Technologies

    Featured

    • AI/ML
      AI/ML Icon
    • Linux
      Linux Icon
    • Kubernetes
      Cloud icon
    • Automation
      Automation Icon showing arrows moving in a circle around a gear
    • View All Technologies
    • Programming Languages & Frameworks

      • Java
      • Python
      • JavaScript
    • System Design & Architecture

      • Red Hat architecture and design patterns
      • Microservices
      • Event-Driven Architecture
      • Databases
    • Developer Productivity

      • Developer productivity
      • Developer Tools
      • GitOps
    • Secure Development & Architectures

      • Security
      • Secure coding
    • Platform Engineering

      • DevOps
      • DevSecOps
      • Ansible automation for applications and services
    • Automated Data Processing

      • AI/ML
      • Data Science
      • Apache Kafka on Kubernetes
      • View All Technologies
    • Start exploring in the Developer Sandbox for free

      sandbox graphic
      Try Red Hat's products and technologies without setup or configuration.
    • Try at no cost
  • Learn

    Featured

    • Kubernetes & Cloud Native
      Openshift icon
    • Linux
      Rhel icon
    • Automation
      Ansible cloud icon
    • Java
      Java icon
    • AI/ML
      AI/ML Icon
    • View All Learning Resources

    E-Books

    • GitOps Cookbook
    • Podman in Action
    • Kubernetes Operators
    • The Path to GitOps
    • View All E-books

    Cheat Sheets

    • Linux Commands
    • Bash Commands
    • Git
    • systemd Commands
    • View All Cheat Sheets

    Documentation

    • API Catalog
    • Product Documentation
    • Legacy Documentation
    • Red Hat Learning

      Learning image
      Boost your technical skills to expert-level with the help of interactive lessons offered by various Red Hat Learning programs.
    • Explore Red Hat Learning
  • Developer Sandbox

    Developer Sandbox

    • Access Red Hat’s products and technologies without setup or configuration, and start developing quicker than ever before with our new, no-cost sandbox environments.
    • Explore Developer Sandbox

    Featured Developer Sandbox activities

    • Get started with your Developer Sandbox
    • OpenShift virtualization and application modernization using the Developer Sandbox
    • Explore all Developer Sandbox activities

    Ready to start developing apps?

    • Try at no cost
  • Blog
  • Events
  • Videos

Monitor OpenShift Virtualization using user-defined projects and Grafana

August 19, 2024
Leonardo Araujo
Related topics:
Virtualization
Related products:
Red Hat OpenShiftRed Hat OpenShift Container PlatformRed Hat OpenShift Virtualization

Share:

    This article will teach you how to install and configure the Grafana Operator and integrate it with the openshift-monitoring stack using user-workload-monitoring. At the end of the article, we will import a dashboard with general metrics about Red Hat OpenShift Virtualization, which will give us an overview of the amount of resources in use, virtual machines (VMs) created, and their consumption.

    In this article we use the following versions:

    • Red Hat OpenShift v4.13.4
    • Red Hat OpenShift Virtualization Operator v4.13.7
    • Grafana Operator v5.6.0

    Prerequisites

    • User with the cluster-admin cluster role.
    • Grafana Operator.
    • User-Defined Projects enabled.

    Enable user-defined projects

    Execute this command to add enableUserWorkload: true under data/config.yaml:

    oc -n openshift-monitoring patch configmap cluster-monitoring-config -p '{"data":{"config.yaml":"enableUserWorkload: true"}}'

    Validate that the prometheus and thanos-ruler pods were created in the openshift-user-workload-monitoring project:

    $ oc get pods -n openshift-user-workload-monitoring
    NAME                                   READY   STATUS    RESTARTS   AGE
    prometheus-operator-675f9d4b96-f9zxd   2/2     Running   0          8d
    prometheus-user-workload-0             6/6     Running   0          8d
    prometheus-user-workload-1             6/6     Running   0          8d
    thanos-ruler-user-workload-0           4/4     Running   0          8d
    thanos-ruler-user-workload-1           4/4     Running   0          8d

    Install Grafana Operator

    • Using the WebConsole, in the left side menu, select OperatorHub and then in the search field, search for Grafana Operator.
    • Make sure to change the project context to openshift-user-workload-monitoring at the top.
    • Click the operator, then click Install.
    • In Update Channel, select v5.
    • In Installation Mode, select A specific namespace on the cluster and choose openshift-user-workload-monitoring below.
    • In Update approval, select Automatic
    • Click Install.

    Now let's create a service account and assign permission to read metrics:

    oc project openshift-user-workload-monitoring
    oc create sa grafana-sa
    oc adm policy add-cluster-role-to-user cluster-monitoring-view -z grafana-sa
     
    Let's collect the grafana-sa service account token and create a secret for our Grafana instance:
    SECRET=`oc -n openshift-user-workload-monitoring describe sa grafana-sa | awk '/Tokens/{ print $2 }'`
    
    TOKEN=`oc -n openshift-user-workload-monitoring get secret $SECRET --template='{{ .data.token | base64decode }}'`
    
    cat <<EOF > grafana-secret-creds.yaml
    kind: Secret
    apiVersion: v1
    metadata:
      name: credentials
      namespace: openshift-user-workload-monitoring
    stringData:
      GF_SECURITY_ADMIN_PASSWORD: grafana   <------ Set the password you want to authenticate with Grafana
      GF_SECURITY_ADMIN_USER: root          <------ Set the desired user to authenticate in Grafana
      PROMETHEUS_TOKEN: '${TOKEN}'          <------ This variable will receive the token collected above
    type: Opaque
    EOF
    
    oc create -f grafana-secret-creds.yaml

    Now let's create our Grafana instance and it will read the credentials defined in the previously created secret:

    cat <<EOF > grafana-instance.yaml
    apiVersion: grafana.integreatly.org/v1beta1
    kind: Grafana
    metadata:
      name: grafana
      labels:
        dashboards: "grafana"
        folders: "grafana"
    spec:
      deployment:
        spec:
          template:
            spec:
              containers:
                - name: grafana
                  env:
                    - name: GF_SECURITY_ADMIN_USER
                      valueFrom:
                        secretKeyRef:
                          key: GF_SECURITY_ADMIN_USER
                          name: credentials
                    - name: GF_SECURITY_ADMIN_PASSWORD
                      valueFrom:
                        secretKeyRef:
                          key: GF_SECURITY_ADMIN_PASSWORD
                          name: credentials
      config:
        auth:
          disable_login_form: "false"
          disable_signout_menu: "true"
        auth.anonymous:
          enabled: "false"
        log:
          level: warn
          mode: console
    EOF
    Let's apply and validate our created instance:
    oc -n openshift-user-workload-monitoring create -f grafana-instance.yaml
    
    oc -n openshift-user-workload-monitoring get pods -l app=grafana
    NAME                                READY   STATUS    RESTARTS   AGE
    grafana-deployment-dd8d8d5d-vpnjh   1/1     Running   0          8d
    Now let's expose our Grafana service using an edge type route, we will use the service called grafana-service:
    oc get svc | awk '/grafana/'
    grafana-service                           ClusterIP   172.30.77.139    <none>        3000/TCP                      8d
    
    
    oc -n openshift-user-workload-monitoring create route edge grafana --service=grafana-service --insecure-policy=Redirect
    Displaying the route exposed to Grafana:
    oc -n openshift-user-workload-monitoring get route grafana -o jsonpath='{.spec.host}'
    Let's create our Grafana Datasource, which will connect to thanos-querier in the openshift-monitoring project and will use the grafana-sa service account token that is stored in secret credentials:
    cat <<EOF > grafana-datasource.yaml
    apiVersion: grafana.integreatly.org/v1beta1
    kind: GrafanaDatasource
    metadata:
      name: grafana-ds
      namespace: openshift-user-workload-monitoring  
    spec:
      valuesFrom:
        - targetPath: "secureJsonData.httpHeaderValue1"
          valueFrom:
            secretKeyRef:
              name: "credentials"
              key: "PROMETHEUS_TOKEN"
      instanceSelector:
        matchLabels:
          dashboards: "grafana"
      datasource:
        name: Prometheus
        type: prometheus
        access: proxy
        url: https://thanos-querier.openshift-monitoring.svc:9091
        isDefault: true
        jsonData:
          "tlsSkipVerify": true
          "timeInterval": "5s"
          httpHeaderName1: 'Authorization'
        secureJsonData:
          "httpHeaderValue1": "Bearer \${PROMETHEUS_TOKEN}"
        editable: true
    EOF
    Let's apply and validate our created Datasource:
    oc -n openshift-user-workload-monitoring create -f grafana-datasource.yaml
    
    oc -n openshift-user-workload-monitoring get GrafanaDatasource  
    NAME         NO MATCHING INSTANCES   LAST RESYNC   AGE
    grafana-ds                           56s           8d

    Creating Grafana dashboard

    Now let's create a Grafana dashboard, which will fetch the JSON externally from Github:

    cat <<EOF > grafana-dashboard-ocp-v.yaml
    apiVersion: grafana.integreatly.org/v1beta1
    kind: GrafanaDashboard
    metadata:
      name: grafana-dashboard-ocp-v
      labels:
        app: grafana
    spec:
      instanceSelector:
        matchLabels:
          dashboards: grafana  
      folder: "Openshift Virtualization"      
      url: https://raw.githubusercontent.com/leoaaraujo/articles/master/openshift-virtualization-monitoring/files/ocp-v-dashboard.json
    EOF
    Let's apply and validate our created Grafana dashboard:
    oc -n openshift-user-workload-monitoring create -f grafana-dashboard-ocp-v.yaml
    
    
    oc -n openshift-user-workload-monitoring get grafanadashboard
    NAME                      NO MATCHING INSTANCES   LAST RESYNC   AGE
    grafana-dashboard-ocp-v                                         3m54s

    Viewing the dashboard

    • Access Grafana, and in the left side menu, click Dashboards and then Browse.
    • A folder with the name OpenShift Virtualization and the dashboard OCP Virt—Metrics will be displayed, click dashboard.
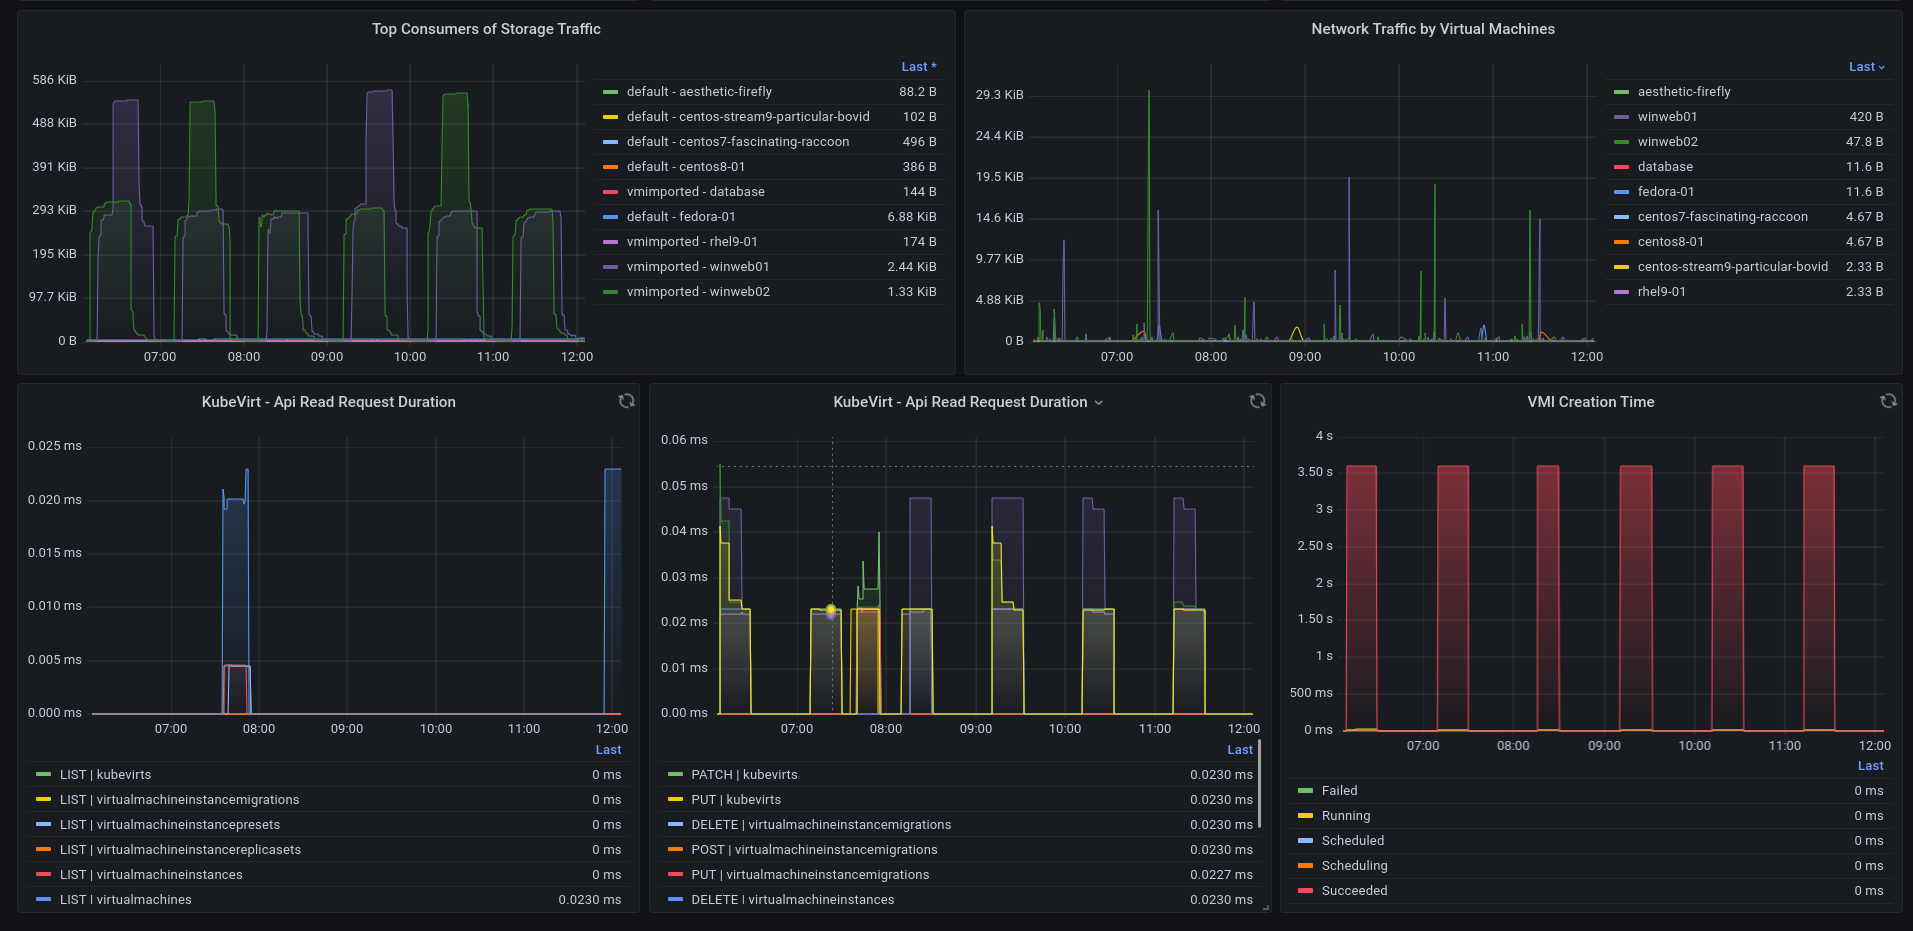
    • Dashboard (see Figure 1 and Figure 2).
    OpenShift Virtualization Dashboard displaying General Information
    Figure 1: The OpenShift Virtualization dashboard displaying various metrics.


    OpenShift Virtualization Dashboard showing Resources Information
    Figure 2: The OpenShift Virtualization dashboard displaying resources information.

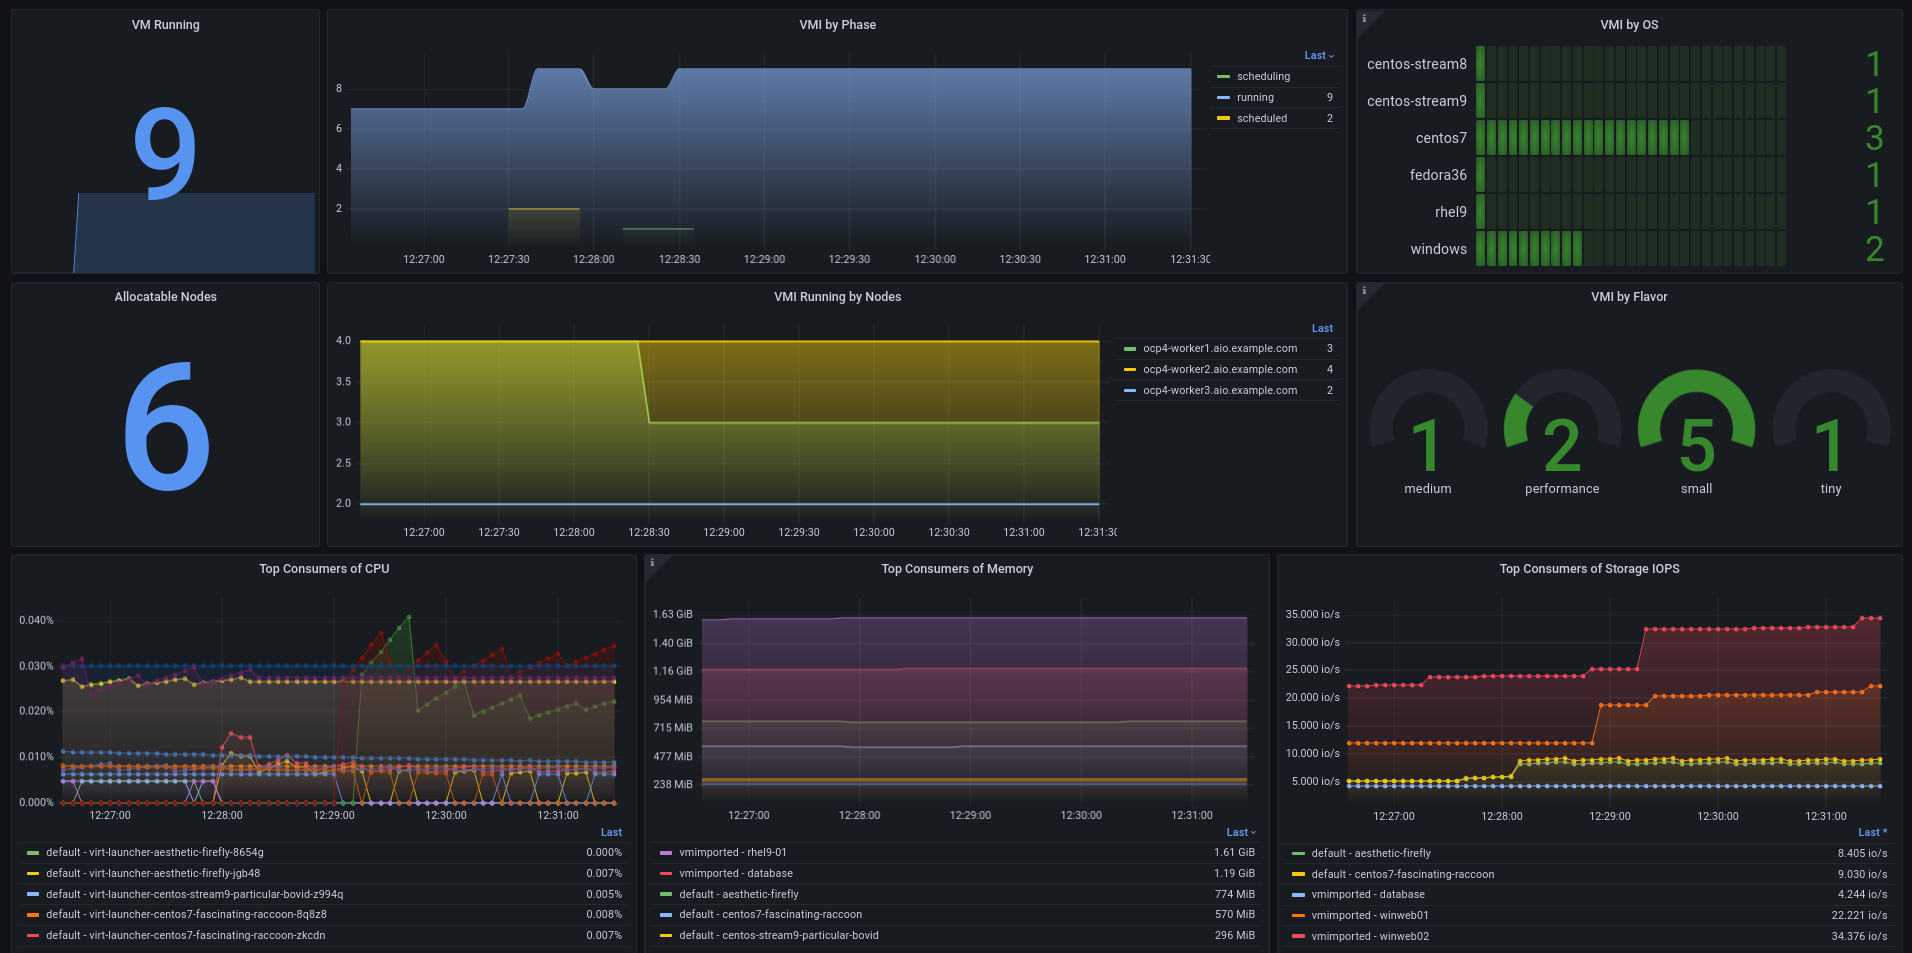
    In this dashboard, you can view the following metrics:

    • Number of VMs running
    • Number of Allocable Nodes
    • Number of VMs by status
    • Number of VMs per OS
    • Number of VMs per Resource Flavor
    • List of Top CPU Consumers
    • List of Top Memory Consumers
    • List of Top IOps Consumers
    • List of Top Storage Traffic Consumers
    • List of Top Network Consumers
    • Read request times in the Kubevirt API
    • Write request time in the Kubevirt API
    • VM creation time

    Conclusion

    In this article, we demonstrate how it is possible to monitor your OpenShift Virtualization in a simple way, using the openshift-monitoring and user-workload-monitoring stacks, creating and customizing your own dashboard and having a more managerial view of your environment.

    References

    • Enabling monitoring for user-defined projects
    • Managing metrics
    Last updated: September 13, 2024

    Related Posts

    • Visualizing Smog Sensor Data with the help of Vert.x, Prometheus, and Grafana

    • How to monitor 3scale API Management using Prometheus and Grafana

    • First steps with the data virtualization Operator for Red Hat OpenShift

    • Generate automated Grafana metrics dashboards for MicroProfile apps

    Recent Posts

    • More Essential AI tutorials for Node.js Developers

    • How to run a fraud detection AI model on RHEL CVMs

    • How we use software provenance at Red Hat

    • Alternatives to creating bootc images from scratch

    • How to update OpenStack Services on OpenShift

    What’s up next?

    Learn the foundations of OpenShift through hands-on experience deploying and working with applications, using a no-cost OpenShift cluster through the Developer Sandbox for Red Hat OpenShift.

    Start the activity
    Red Hat Developers logo LinkedIn YouTube Twitter Facebook

    Products

    • Red Hat Enterprise Linux
    • Red Hat OpenShift
    • Red Hat Ansible Automation Platform

    Build

    • Developer Sandbox
    • Developer Tools
    • Interactive Tutorials
    • API Catalog

    Quicklinks

    • Learning Resources
    • E-books
    • Cheat Sheets
    • Blog
    • Events
    • Newsletter

    Communicate

    • About us
    • Contact sales
    • Find a partner
    • Report a website issue
    • Site Status Dashboard
    • Report a security problem

    RED HAT DEVELOPER

    Build here. Go anywhere.

    We serve the builders. The problem solvers who create careers with code.

    Join us if you’re a developer, software engineer, web designer, front-end designer, UX designer, computer scientist, architect, tester, product manager, project manager or team lead.

    Sign me up

    Red Hat legal and privacy links

    • About Red Hat
    • Jobs
    • Events
    • Locations
    • Contact Red Hat
    • Red Hat Blog
    • Inclusion at Red Hat
    • Cool Stuff Store
    • Red Hat Summit

    Red Hat legal and privacy links

    • Privacy statement
    • Terms of use
    • All policies and guidelines
    • Digital accessibility

    Report a website issue