Observability is a crucial aspect of efficiently maintaining complex environments. It provides the capability to understand the internal state of the system by scraping runtime data. The collected data gives better view of the system at runtime and can be used to configure alerts and identify trends and insights about the element being monitored.
Prometheus is a widely used monitoring tool that scrapes data from configured targets using a pull-based approach. Prometheus expects the metric to be exposed in specific data exposition format. There are also projects like OpenMetrics, which aims to convert the Prometheus exposition format into a standard to help transmit metrics at scale.
In this article, we will see how we can scrape metrics from the newly released Red Hat build of Keycloak deployed on Red Hat OpenShift.
Install the Keycloak Operator
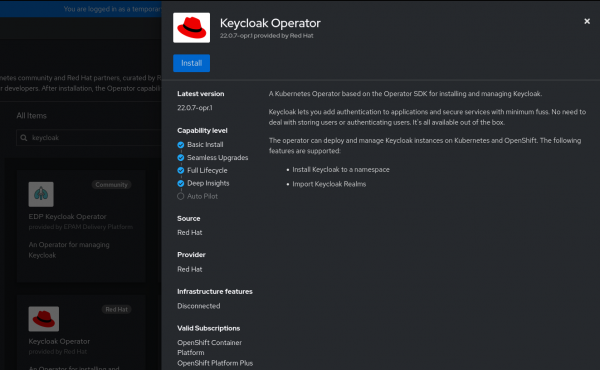
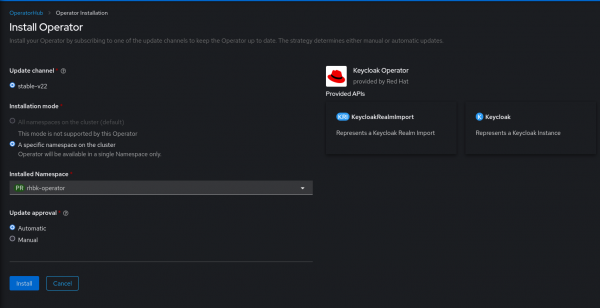
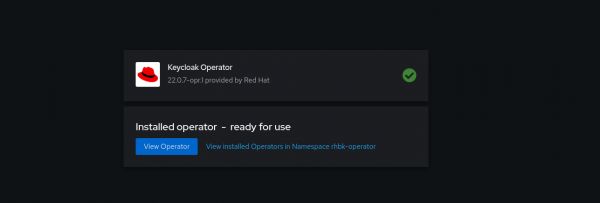
The Red Hat build of Keycloak is packaged as an Operator that can be deployed on OpenShift. We can deploy the Keycloak Operator using Operator Hub. The Keycloak Operator is built with the quarkus operator-sdk library.


Deploy the Keycloak Custom Resource
Now that the Keycloak Operator is installed, we can utilize the installed Keycloak Operator to start an instance of Red Hat build of Keycloak. This instance can be created using Keycloak Custom Resource.
To be able to create Keycloak custom resource, we need to have a database running (I have used PostgreSQL database) and the certificates along with private key to start the https port of Keycloak.
Create the database credential secret
We will first create a secret that will hold the username and password to connect with the database:
$ oc create secret generic keycloak-db-secret \
  --from-literal=username=postgres \
  --from-literal=password=password@123
Create the TLS secret
Next, we need to create a secret which will hold the certificates and the key that will be utilized to start https port of Keycloak.
Below are the steps to create a self-signed certificate. If this is a production setup, the certificate might need to be issued by a Certificate Authority.
Info alert: Note
The Prometheus metrics will be scraped from https endpoint; hence while generating certificate, add the Subject Alternative Name covering the service host (either through regex or exact service hostname). Alternatively, you can use the route host to scrape the metrics.
In the snippet below, I have created request.conf to generate the certificate with Subject alternative name:
# Created a configuration file with my requirements
$ cat request.conf
[req]
distinguished_name = req_distinguished_name
x509_extensions = v3_req
prompt = no

[req_distinguished_name]
C = IN
ST = MH
O = Company
OU = Division
CN = ${rhbk_hostname}

[v3_req]
keyUsage = keyEncipherment, dataEncipherment
extendedKeyUsage = serverAuth
subjectAltName = @alt_names

[alt_names]
DNS.1 = ${service_name}.${namespace}.svc.cluster.local

# Generating the certificate and key using above created request.conf
$ openssl req -x509 -nodes -days 365 -newkey rsa:2048 -keyout tls.key -out tls.crt -config request.conf -extensions 'v3_req'
$ ls
tls.key tls.crt
Replace ${rhbk_hostname} , ${service_name} , and ${namespace} with your Red Hat build of Keycloak hostname, service name, and the namespace.
Create the TLS secret using the above generated certificate and key:
$ oc create secret tls rhbk-tls-secret --cert tls.crt --key tls.key
secret/rhbk-tls-secret created
Create Keycloak CR
Now that we have created 2 secrets—one for the database credential and other for enabling https port—we can now create our Keycloak Custom Resource using the YAML provided below:
$ cat keycloak.yaml
apiVersion: k8s.keycloak.org/v2alpha1
kind: Keycloak
metadata:
  name: rhbk-keycloak
  labels:
    app: sso
  namespace: rhbk-operator
spec:
  db:
    database: rhbk_operator
    host: postgres.db.server
    passwordSecret:
      key: password
      name: keycloak-db-secret
    port: 5432
    schema: public
    usernameSecret:
      key: username
      name: keycloak-db-secret
    vendor: postgres
  hostname:
    hostname: keycloak-rhbk-operator.xxxxx.xxx.xxx.xxxx
  http:
    tlsSecret: rhbk-tls-secret
  instances: 1
  transaction:
    xaEnabled: false
The above example YAML would be useful as a skeleton for you; the specific value has to be filled as per the database configuration, secrets created, hostname expected, etc.
Checking status of Keycloak pod
The Keycloak pod should transition to Running status:
$ oc get pods
NAME                            READY   STATUS    RESTARTS   AGE
rhbk-keycloak-0                 1/1     Running   0          1h
rhbk-operator-5b97fdfd6-jb2d7   1/1     Running   0          1h
Enabling user monitoring in OpenShift cluster
To enable Prometheus scraping metrics from user defined project, we need to configure enableUserWorkload to true in cluster-monitoring-config configmap within openshift-monitoring namespace.
apiVersion: v1
kind: ConfigMap
metadata:
  name: cluster-monitoring-config
  namespace: openshift-monitoring
data:
  config.yaml: |
    enableUserWorkload: true
Adding ServiceMonitor
So now that we have our Keycloak server up and running and user monitoring enabled, we can create the ServiceMonitor object to scrape metrics exposed by the Keycloak service.
Before we create a ServiceMonitor, we have to update Keycloak custom resource to enable metrics endpoint. It can be done by updating metrics-enabled to true under spec.additionalOptions.
Update keycloak.yaml to enable metrics endpoint:
apiVersion: k8s.keycloak.org/v2alpha1
kind: Keycloak
metadata:
.....
spec:
  additionalOptions:
    - name: metrics-enabled
      value: 'true'
After the metrics-enabled is set to true, we can check if the metrics endpoint is exposed successfully using the route URL: https://keycloak-route-url/metrics
To create ServiceMonitor, we need to identify :
- The service port we need to monitor
- Secret with server certificate (required to enable SSL connection)
In current case we can utilize the tls.crt stored within rhbk-tls-secret in initial section.
Create ServiceMonitor
With the https port, Service URL and /metrics of Keycloak, along with the server certificate available in rhbk-tls-secret we can create a ServiceMonitor like following:
apiVersion: monitoring.coreos.com/v1
kind: ServiceMonitor
metadata:
  name: rhbk-service-monitor
  namespace: rhbk-operator
spec:
  endpoints:
    - interval: 30s
      path: /metrics
      port: https
      scheme: https
      tlsConfig:
        ca:
          secret:
            key: tls.crt
            name: rhbk-tls-secret
        serverName: ${service_name}.${namespace}.svc.cluster.local
  selector:
    matchLabels:
      app: keycloak
Observing the target
With ServiceMonitor created and its required element in place, as shown in Figure 4, we can see our Keycloak target Up under Observe → Targets. The Up status is crucial, as any other status signifies missing configuration.

Querying metrics
We can now query for specific metrics under Observe → Metrics in the OpenShift Console. Below is an example query:
sum(jvm_threads_peak_threads{namespace=’rhbk-operator’}) BY (pod, namespace)

Keycloak exposes metrics about the System, JVM, Database, HTTP, and Cache.
Conclusion
This article walked you through how to install the Keycloak Operator, create a Keycloak CR, and ultimately expose Keycloak metrics. Metrics empower us to effectively maintain our Keycloak installation by helping us peek behind the curtain to gain insights, identify bottlenecks, and more, for a more reliable Keycloak environment.
