The distributed tracing team at Red Hat is excited to announce the Tempo operator technology preview product on Red Hat OpenShift as part of distributed tracing. We have released Tempo operator to all supported OpenShift versions (4.10 and above).
In this article, we will describe the Tempo operator and features available on OpenShift. The Tempo operator is also available to the upstream Kubernetes users through operatorhub.io.
Why use Grafana Tempo?
The Tempo documentation states, “Grafana Tempo is an open source, easy-to-use, and high-volume distributed tracing backend. Tempo is cost-efficient and only requires object storage to operate. Tempo is deeply integrated with Grafana, Mimir, Prometheus, and Loki. You can use Tempo with open-source tracing protocols, including Jaeger, Zipkin, or OpenTelemetry.”
Why Tempo? Tempo aligns well with other Red Hat observability products (e.g., Prometheus and Loki). It also uses object storage to store data, has similar design, and therefore it should be operationally similar to the other observability backends. We believe that Tempo is a good choice, and it will give OpenShift users great user experience and improve observability capabilities.
One of the exciting Tempo features is TraceQL. It is a query language inspired by PromQL and LogQL. In the upcoming releases, OpenShift users will be able to use similar language to query all telemetry signals.
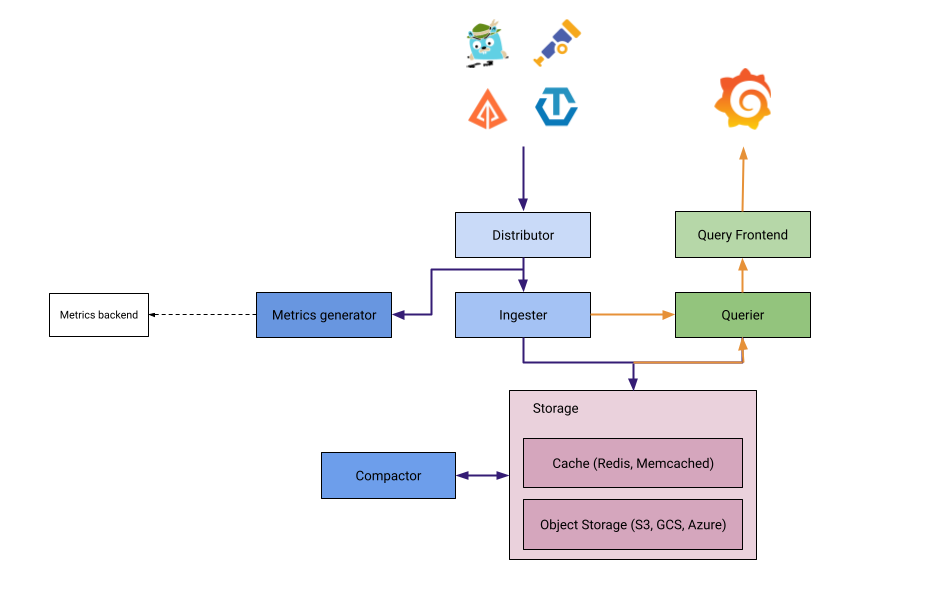
Tempo can be deployed in monolithic and microservices mode. The current Tempo operator supports only the microservices mode, which creates several deployments for Tempo components (Figure 1).
The Tempo operator features
The Tempo operator manages TempoStack Custom Resource Definition (CRD) that allows users to create Tempo instances the Kubernetes native way. It simplifies Tempo installation by giving users a curated set of configuration options and hides operational complexity by handling automated upgrades, for instance.
The operator features:
- Resource management: A single resource definition splitS across all Tempo containers.
- Authentication and authorization: OIDC with static RBAC or integration with OpenShift OAuth and SubjectAccessReview.
- Security: Internal communication is protected with mTLS.
- Automated monitoring: The operator configures Prometheus service monitors to scrape metrics from Tempo deployments.
- Networking: The Jaeger UI is exposed via the OpenShift route.
The Tempo user interface
The upstream Tempo project does not have any native user interface, however the TempoStack can be configured to deploy a Jaeger query with the Jaeger UI. This configuration option not only allows users to use Jaeger UI, but also exposes the Jaeger query APIs.
Grafana users can configure the Tempo datasource and use externally managed Grafana as a visualization tool for Tempo.
The following fraction of the TempoStack CR enables the Jaeger UI:
apiVersion: tempo.grafana.com/v1alpha1
kind: TempoStack
metadata:
  name: simplest
spec:
  template:
    queryFrontend:
      jaegerQuery:
        enabled: true
Object storage
The Tempo operator supports OpenShift Data Foundation, AWS S3, Azure, GCS and Minio for storing Tempo data. Follow the operator docs to learn how to create a secret for connecting to your preferred storage option.
How to install the Tempo operator
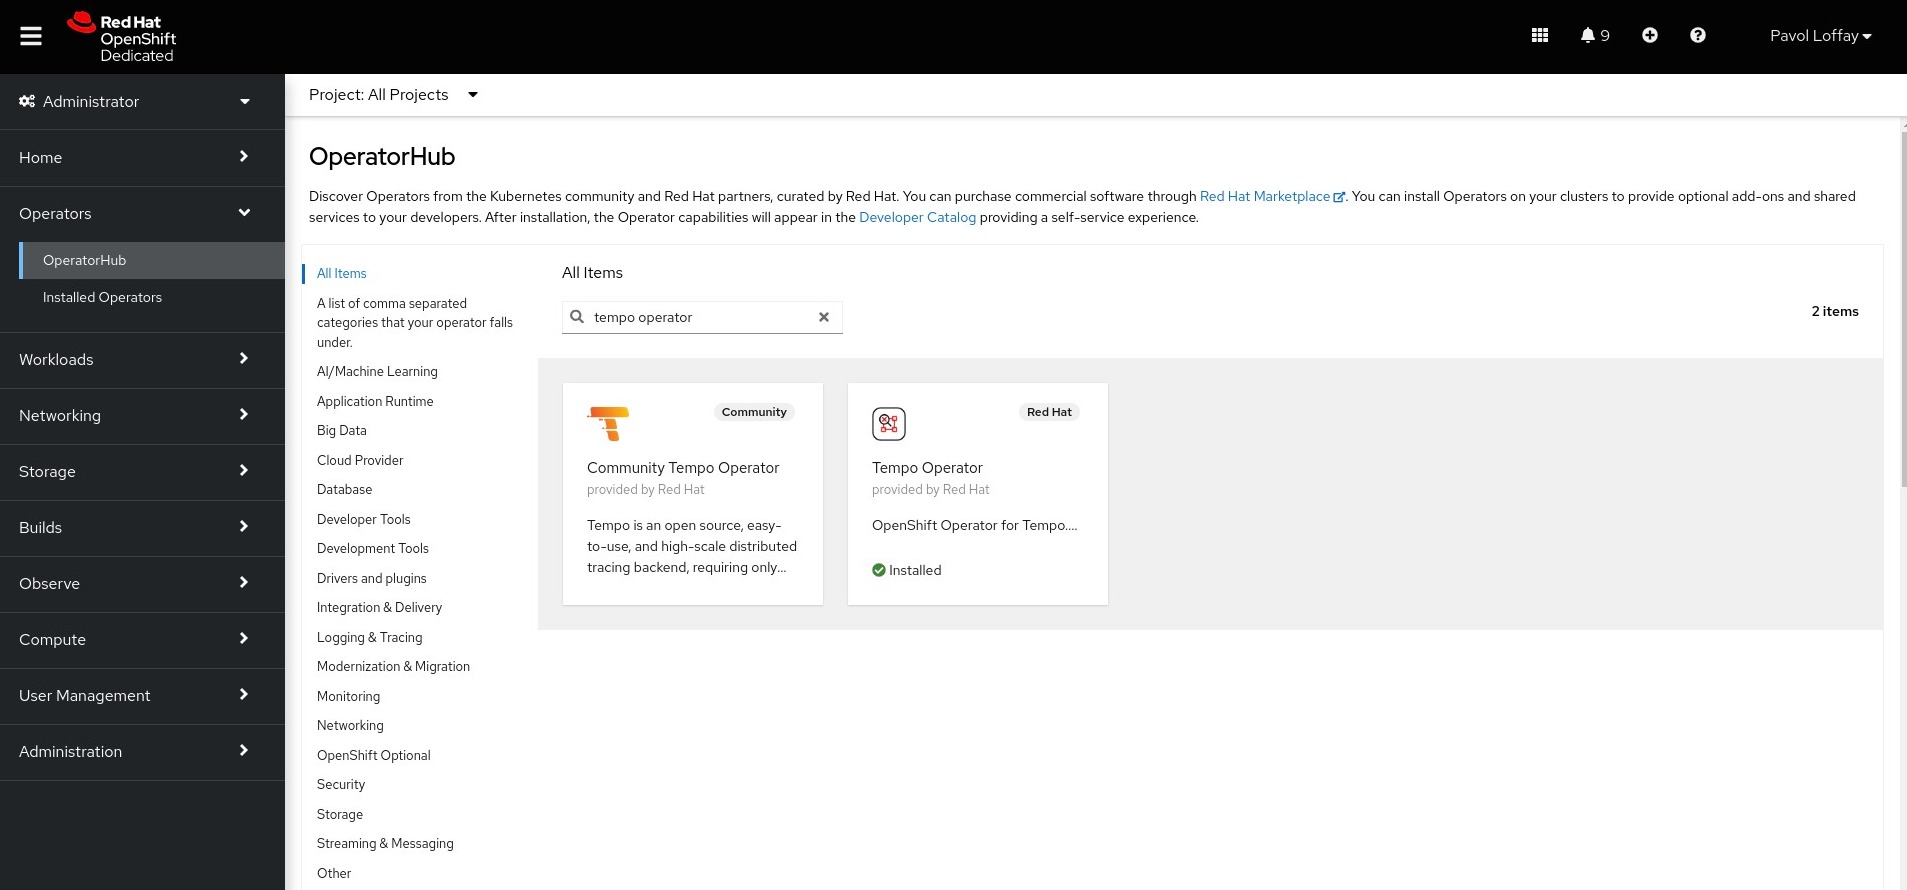
On OpenShift, you can install the operator directly from the Operator Hub (Figure 2). The Operator Hub will show two Tempo operators: the community distribution and the supported Red Hat OpenShift distributed tracing product:
A multitenancy example
Tempo is a native multitenant system. On OpenShift, the Tempo operator deploys a gateway that uses OpenShift OAuth (reading) and TokenReview (writing) for authentication, and SubjectAccessReview for authorization.
The following TempoStack CR enables authentication with multitenancy and configures two tenants with the names, dev and prod. The example uses S3 object storage with secret tempostack-dev-minio. Refer to the documentation to learn how to set it up.
kubectl apply -f - <<EOF
apiVersion: tempo.grafana.com/v1alpha1
kind:  TempoStack
metadata:
  name: simplest
  namespace: observability
spec:
  storage:
    secret:
      name: tempostack-dev-minio
      type: s3
  storageSize: 1Gi
  resources:
    total:
      limits:
        memory: 2Gi
        cpu: 2000m
  tenants:
    mode: openshift
    authentication:
      - tenantName: dev
        tenantId: "1610b0c3-c509-4592-a256-a1871353dbfa"
      - tenantName: prod
        tenantId: "6094b0f1-711d-4395-82c0-30c2720c6648"
  template:
    gateway:
      enabled: true
    queryFrontend:
      jaegerQuery:
        enabled: true
EOF
These are the main objects created by the operator:
NAME                                              HOST/PORT                                               PATH   SERVICES                 PORT     TERMINATION   WILDCARD
route.route.openshift.io/tempo-simplest-gateway   tempo-simplest-gateway-observability.apps-crc.testing          tempo-simplest-gateway   public   passthrough   None

NAME                                              TYPE        CLUSTER-IP     EXTERNAL-IP   PORT(S)                                                             AGE
service/tempo-simplest-compactor                  ClusterIP   10.217.5.105   <none>        7946/TCP,3200/TCP                                                   18h
service/tempo-simplest-distributor                ClusterIP   10.217.4.38    <none>        4317/TCP,3200/TCP                                                   18h
service/tempo-simplest-gateway                    ClusterIP   10.217.5.27    <none>        8090/TCP,8081/TCP,8080/TCP                                          18h
service/tempo-simplest-gossip-ring                ClusterIP   None           <none>        7946/TCP                                                            18h
service/tempo-simplest-ingester                   ClusterIP   10.217.4.27    <none>        3200/TCP,9095/TCP                                                   18h
service/tempo-simplest-querier                    ClusterIP   10.217.4.65    <none>        7946/TCP,3200/TCP,9095/TCP                                          18h
service/tempo-simplest-query-frontend             ClusterIP   10.217.4.222   <none>        3200/TCP,9095/TCP,16686/TCP,16687/TCP                               18h
service/tempo-simplest-query-frontend-discovery   ClusterIP   None           <none>        3200/TCP,9095/TCP,9096/TCP,16686/TCP,16687/TCP                      18h


NAME                                            READY   UP-TO-DATE   AVAILABLE   AGE

deployment.apps/tempo-simplest-compactor        1/1     1            1           18h
deployment.apps/tempo-simplest-distributor      1/1     1            1           18h
deployment.apps/tempo-simplest-gateway          1/1     1            1           18h
deployment.apps/tempo-simplest-querier          1/1     1            1           18h
deployment.apps/tempo-simplest-query-frontend   1/1     1            1           18h


NAME                                       READY   AGE
statefulset.apps/tempo-simplest-ingester   1/1     18h
The operator creates a tempo-simplest-gateway route to access the UI, however we need to create a ClusterRole to allow users accessing the UI. The following ClusterRole gives all OpenShift authenticated users access to the dev tenant. Then the Jaeger UI can be accessed on this URL: https://tempo-simplest-gateway-observability.{OpenShift base domain}/api/traces/v1/dev/search).
kubectl apply -f - <<EOF
apiVersion: rbac.authorization.k8s.io/v1
kind: ClusterRole
metadata:
  name: tempostack-traces-reader
rules:
  - apiGroups:
      - 'tempo.grafana.com'
    resources:
      - dev
    resourceNames:
      - traces
    verbs:
      - 'get'
---
apiVersion: rbac.authorization.k8s.io/v1
kind: ClusterRoleBinding
metadata:
  name: tempostack-traces-reader
roleRef:
  apiGroup: rbac.authorization.k8s.io
  kind: ClusterRole
  name: tempostack-traces-reader
subjects:
  - kind: Group
    apiGroup: rbac.authorization.k8s.io
    name: system:authenticated
EOF
To write, the data clients (e.g., OpenTelemetry collector) have to send the X-Scope-OrgID header with the tenant name (e.g., dev) and Kubernetes ServiceAccount token (e.g., /var/run/secrets/kubernetes.io/serviceaccount/token) as a bearer token. Therefore, the client’s ServiceAccount has to be associated with the ClusterRole giving write access for a given tenant.
The following example creates an OpenTelemetry collector and configures it to send data to the previously deployed Tempo:
kubectl apply -f - <<EOF
---
apiVersion: opentelemetry.io/v1alpha1
kind: OpenTelemetryCollector
metadata:
  name: dev
  namespace: observability
spec:
  config: |
    extensions:
      bearertokenauth:
        filename: "/var/run/secrets/kubernetes.io/serviceaccount/token"

    receivers:
      otlp:
        protocols:
          grpc:
          http:
      jaeger:
        protocols:
          thrift_binary:
          thrift_compact:
          thrift_http:
          grpc:

    processors:

    exporters:
      logging:
      otlp:
        endpoint: tempo-simplest-gateway.observability.svc.cluster.local:8090
        tls:
          insecure: false
          ca_file: "/var/run/secrets/kubernetes.io/serviceaccount/service-ca.crt"
        auth:
          authenticator: bearertokenauth
        headers:
          X-Scope-OrgID: "dev"

    service:
      extensions: [bearertokenauth]
      pipelines:
        traces:
          receivers: [otlp, jaeger]
          exporters: [otlp, logging]
---
apiVersion: rbac.authorization.k8s.io/v1
kind: ClusterRole
metadata:
  name: tempostack-traces-write
rules:
  - apiGroups:
      - 'tempo.grafana.com'
    resources:
      - dev
    resourceNames:
      - traces
    verbs:
      - 'create'
---
apiVersion: rbac.authorization.k8s.io/v1
kind: ClusterRoleBinding
metadata:
  name: tempostack-traces
roleRef:
  apiGroup: rbac.authorization.k8s.io
  kind: ClusterRole
  name: tempostack-traces-write
subjects:
  - kind: ServiceAccount
    name: dev-collector
    namespace: observability
EOF
We have successfully configured and deployed tracing data collection and storage. Now we can deploy an example application that will generate traces and report them to the OpenTelemetry collector:
kubectl apply -f - <<EOF
apiVersion: batch/v1
kind: Job
metadata:
name: telemetrygen
namespace: observability
labels:
app: telmeetrygen
spec:
ttlSecondsAfterFinished: 30
template:
spec:
restartPolicy: OnFailure
containers:
- name: telemetrygen
image: ghcr.io/open-telemetry/opentelemetry-collector-contrib/telemetrygen:v0.74.0
args: [traces, --otlp-endpoint=dev-collector:4317, --otlp-insecure, --duration=240s, --rate=4]
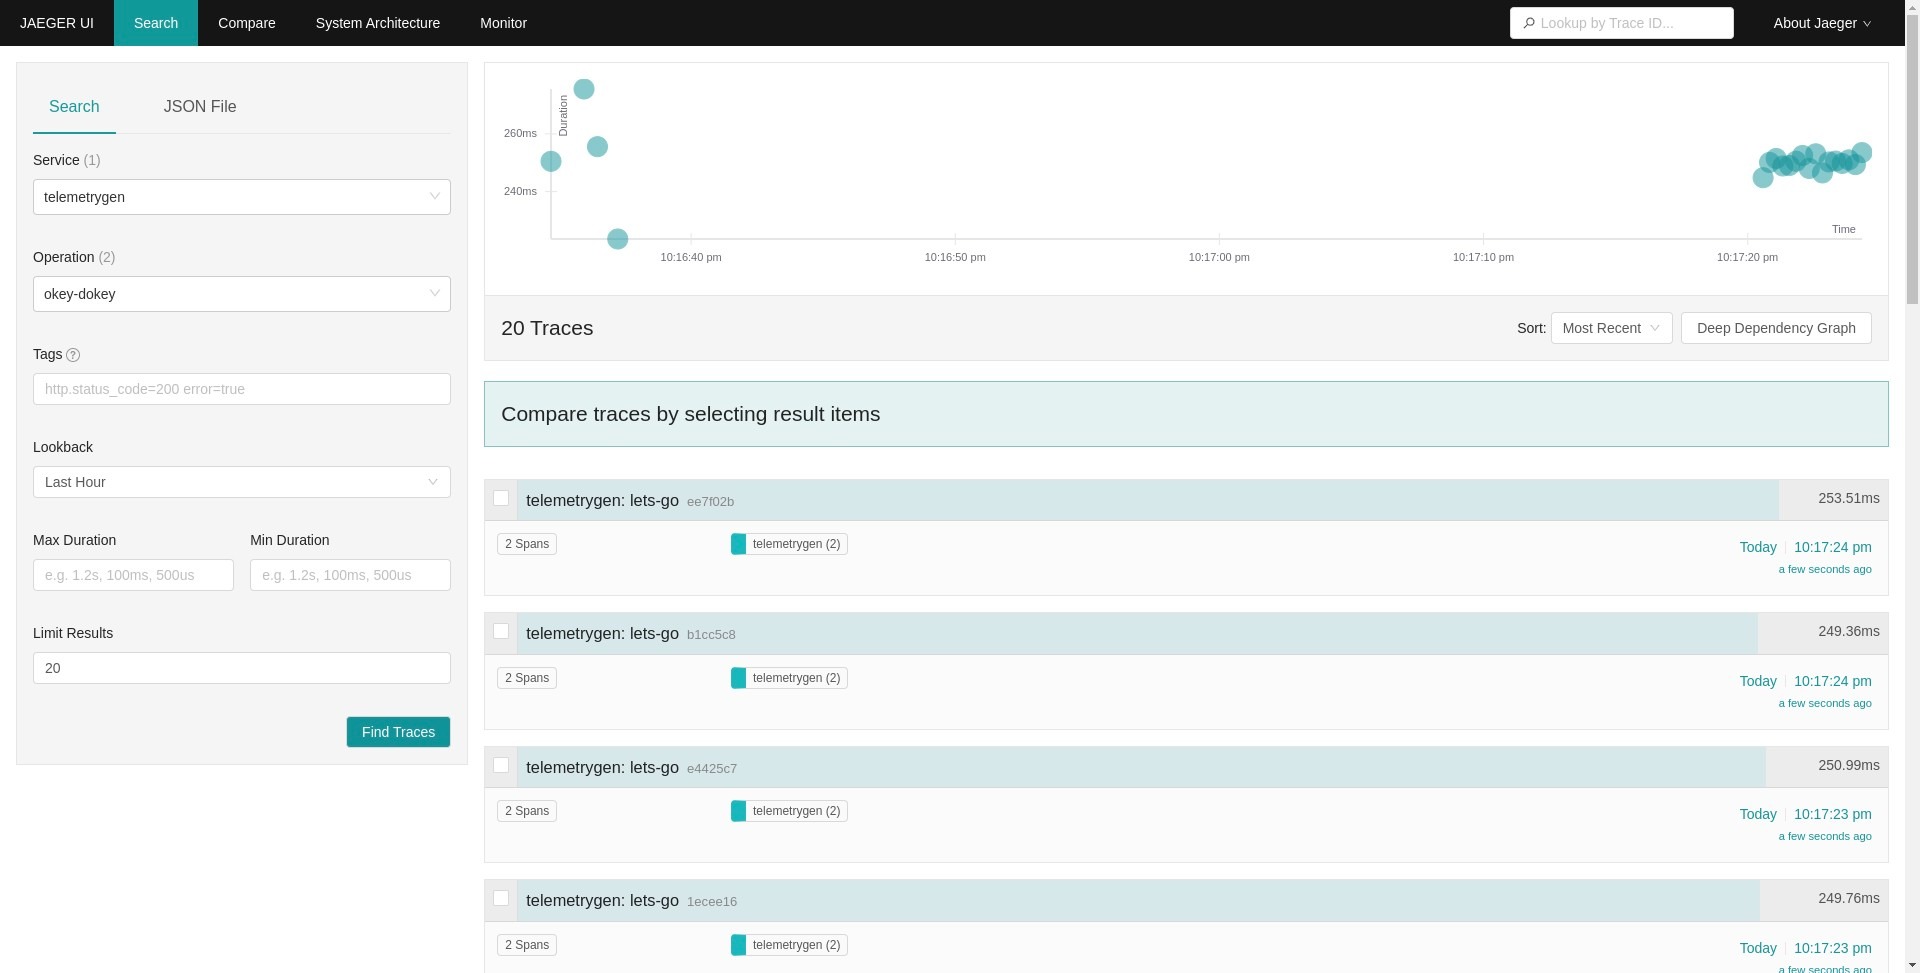
EOFThe Jaeger UI can be accessed on the URL: https://tempo-simplest-gateway-observability.apps-crc.testing/api/traces/v1/dev/search. This URL is from my local CRC cluster. The dev in the URL denotes the dev tenant (Figure 3).
Deploying the Tempo operator is simple
Deploying Tempo with the operator is a straightforward process and gives users a curated set of configuration options that are relevant for running Tempo on Kubernetes. The integration with OpenShift OAuth makes authentication simple and well integrated into the platform. The Tempo operator is a new project. We are looking forward to future releases to further improve user experience and give users exciting capabilities, such as TraceQL, span RED metrics, auto-tuning of configuration parameters, and automating Tempo operation.
Last updated: September 27, 2024