Red Hat 3scale API Management is a valuable tool that coordinates access to your services. This article demonstrates how to monitor 3scale API Management using Prometheus to collect statistics and Grafana to display them. We use the monitoring provided by the Red Hat OpenShift Container Platform.
The OpenShift Container Platform uses plugins installed from OperatorHub for monitoring. This article also demonstrates how to install the Grafana Operator. You don't have to install the Prometheus Operator because it is already installed in OpenShift monitoring, and the Prometheus user interface (UI) is integrated into the Monitoring page of the OpenShift console.
NOTE: There is a community Operator for Prometheus described in separate documentation for 3scale API Management. We don't use the community Operator. You can install either the OperatorHub Operator from this article or the community Operator, but not both. You must create a custom resource for Prometheus when using the community Operator, but not for the Operator in this article.
Environment
You must have accounts for the following services to perform the tasks in this article:
Enabling and confirming monitoring for 3scale API Management
The procedure for enabling monitoring requires you to configure your projects for monitoring and to install Grafana. The following subsections cover these tasks and how to confirm that everything is working.
Enabling monitoring for your projects on OpenShift
Create a ConfigMap named cluster-monitoring-config in the openshift-monitoring namespace:
apiVersion: v1
kind: ConfigMap
metadata:
  name: cluster-monitoring-config
  namespace: openshift-monitoring
data:
  config.yaml: |
    enableUserWorkload: true
Confirm that the pods related to Prometheus are running:
$ oc get pod -n openshift-user-workload-monitoring
NAME                                  READY   STATUS    RESTARTS   AGE
prometheus-operator-c7bdc5c48-znvkh   2/2     Running   0          2m26s
prometheus-user-workload-0            6/6     Running   0          2m23s
thanos-ruler-user-workload-0          3/3     Running   0          2m20s
Deploying Grafana
NOTE: Although Red Hat provides the information in this section, the procedure lies outside the scope of the posted Service Level Agreements and support procedures. This information is provided as-is and thereby unsupported by Red Hat. This article intends to provide information to accomplish the system's needs. The use of the information in this article is at the user's own risk.
On OperatorHub, install the Grafana Operator in the same project as 3scale API Management. Currently (according to this report), Grafana has to be in the same project (namespace) as the service it displays to show the service in a dashboard.
Create the Grafana resource:
apiVersion: integreatly.org/v1alpha1
kind: Grafana
metadata:
  name: grafana
spec:
  config:
    auth:
      disable_signout_menu: true
    auth.anonymous:
      enabled: true
    log:
      level: warn
      mode: console
    security:
      admin_password: secret
      admin_user: root
  dashboardLabelSelector:
    - matchExpressions:
        - key: app
          operator: In
          values:
            - 3scale-api-management
  ingress:
    enabled: true
Confirm that the thanos-querier route is in the openshift-monitoring namespace:
$ oc get route -n openshift-monitoring
Add the cluster-monitoring-view role to the grafana-serviceaccount service account:
$ oc project <your_3scale_project>
$ oc adm policy add-cluster-role-to-user cluster-monitoring-view -z grafana-serviceaccount
Get the access token of grafana-serviceaccount:
$ oc serviceaccounts get-token grafana-serviceaccount
Create the Grafana data source that refers to the thanos-querier service:
apiVersion: integreatly.org/v1alpha1
kind: GrafanaDataSource
metadata:
  name: prometheus-grafanadatasource
  namespace:  <your_3scale_project>
spec:
  datasources:
  - access: proxy
    editable: true
    isDefault: true
    jsonData:
      httpHeaderName1: 'Authorization'
      timeInterval: 5s
      tlsSkipVerify: true
    name: Prometheus
    secureJsonData:
      httpHeaderValue1: 'Bearer <ACCESS_TOKEN>'
    type: prometheus
    url: '<https://thanos-querier.openshift-monitoring.route>'
  name: prometheus-grafanadatasource.yaml
If you receive an error message about cross origin resource sharing (CORS), try using insecure http instead of https for testing purposes. Investigate the cause of the error message once the connection is confirmed:
Cross-Origin Request Blocked: The Same Origin Policy disallows reading the remote resource at https://thanos-querier-openshift-... (Reason: CORS request did not succeed).
The last configuration task is adding a monitoring parameter to the APIManager:
apiVersion: apps.3scale.net/v1alpha1
kind: APIManager
metadata:
  name: apimanager1
spec:
  wildcardDomain: <apps.example.com>
  monitoring:
    enabled: true
Confirming OpenShift monitoring
Now you can perform a few checks to make sure the installation and configuration worked.
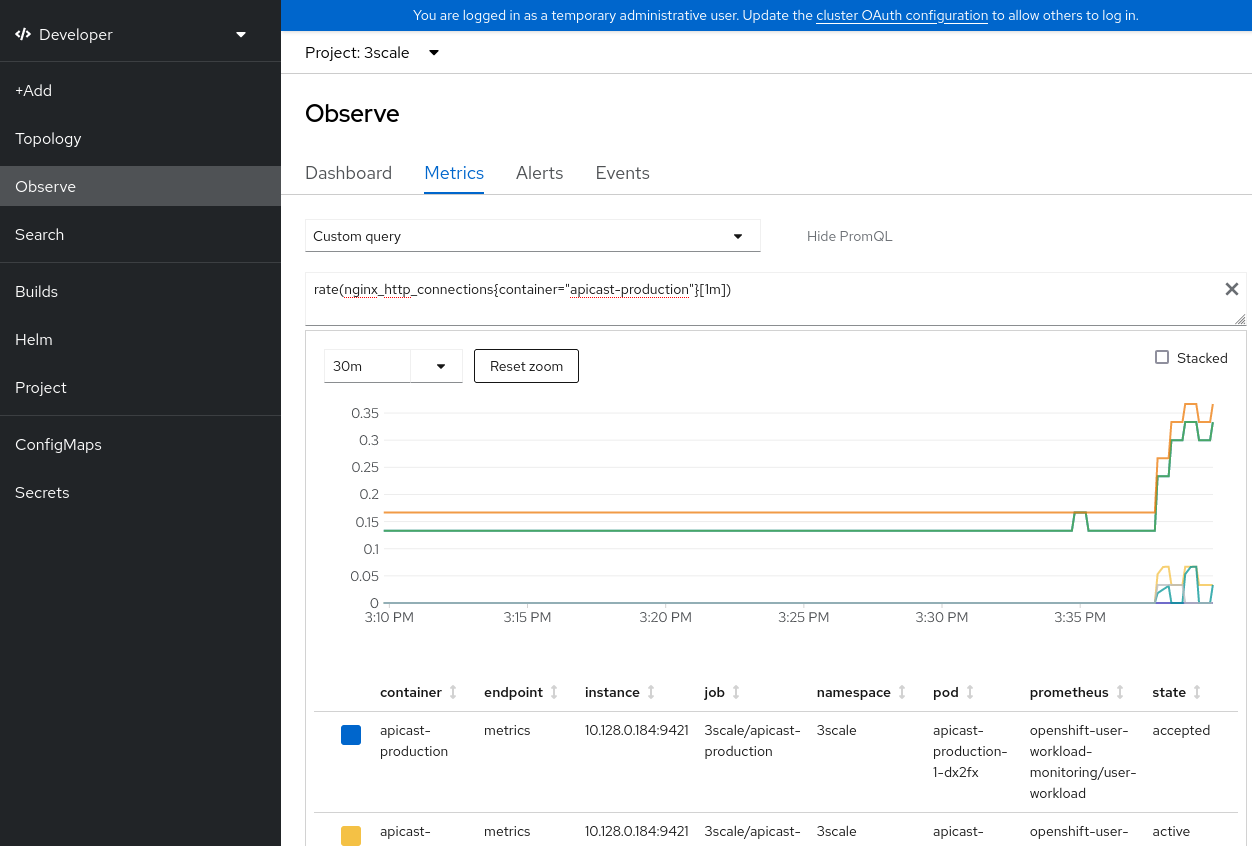
From the developer perspective of the UI, open Monitoring→Metrics. On the pulldown menu, select Custom Query. Enter a query in the Prometheus query language (PromQL) that refers to a 3scale API Management metric:
rate(nginx_http_connections{container="apicast-production"}[1m])
Confirm that the PromQL executed (Figure 1).
Open the Alert tab, and confirm that alerts from 3scale API Management are listed (Figure 2).

Send requests to the production APIcast of an API that results in an authentication failure. Confirm that the ThreescaleApicastHttp4xxErrorRate alert is in the Pending state (Figure 3).

For more details about alerts, refer to "Managing alerts" in the OpenShift documentation.
Confirming Grafana displays
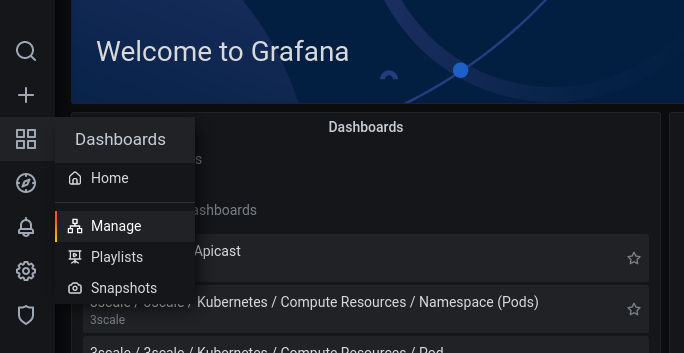
Open https://grafana-route-3scale.apps.<ocp_base_domain> in your browser.
From the left-side dropdown menu, open the Manage menu (Figure 4).
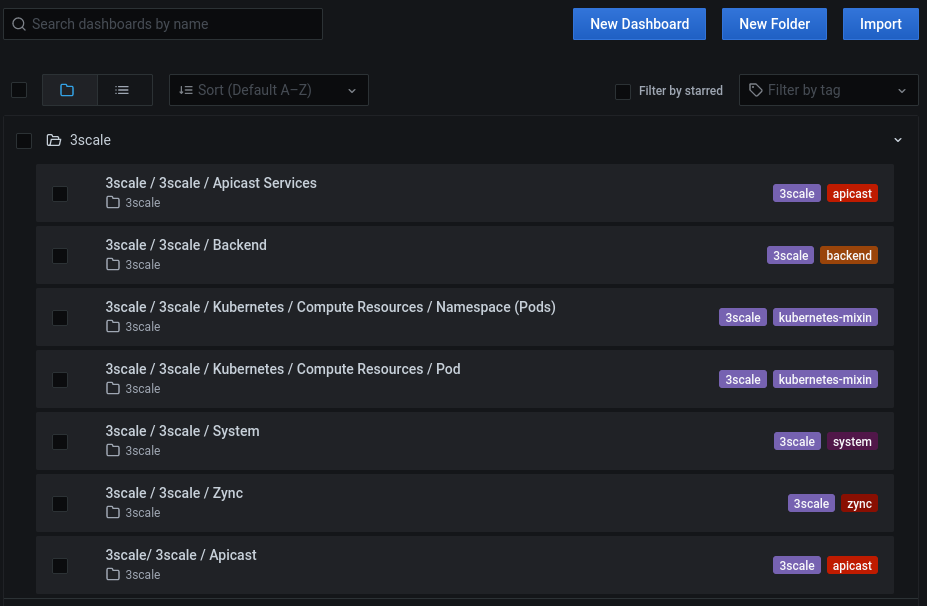
Dashboards for 3scale API Management should be listed (Figure 5).
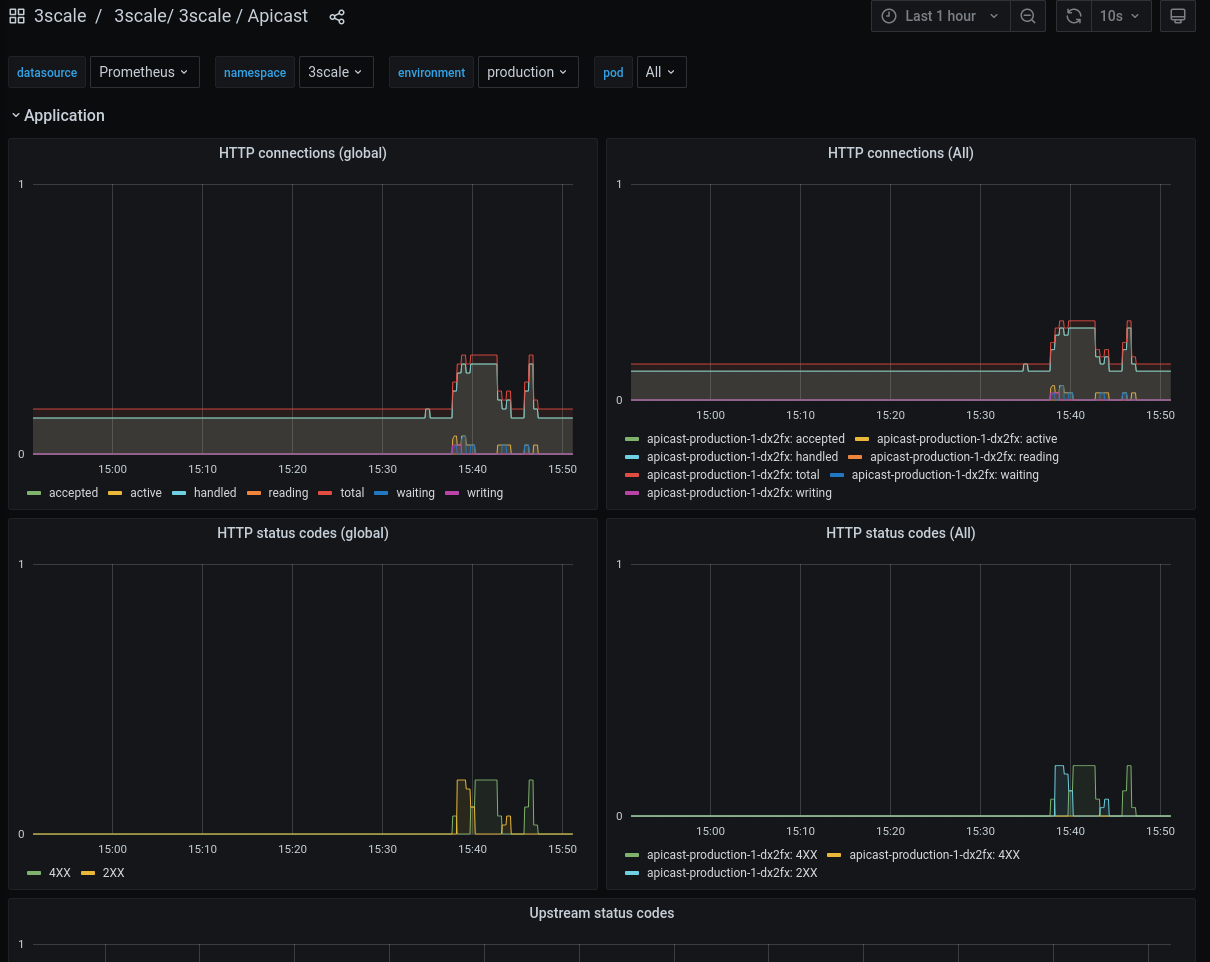
You can dig into the statistics by clicking an item. For instance, if you click 3scale / 3scale / Apicast, the APIcast dashboard should appear (Figure 6).
Summary
We hope you found this demonstration to be informative and easy. Check out the Custom Grafana Dashboard for custom metrics. You can find more resources on GitHub 3scale Monitoring Resources and in chapter 3: Monitoring 3scale. To learn more about enabling monitoring for user-defined projects, read chapter 5: OpenShift Container Platform.
Last updated: September 19, 2023