When debugging an application within a Red Hat OpenShift container, it is important to keep in mind that the Linux environment within the container is subject to various constraints. Because of these constraints, the full functionality of debugging tools might not be available:
- An unprivileged OpenShift container is restricted from accessing kernel interfaces that are required by some low-level debugging tools.
Note: Almost all applications on OpenShift run in unprivileged containers. Unprivileged containers allow the use of standard debugging tools such as
gdbserverorstrace. Examples of debugging tools that cannot be used in unprivileged containers includeperf, which requires access to the kernel’sperf_eventsinterface, and SystemTap, which depends on the kernel’s module-loading functionality.
- Debug information for system packages within OpenShift containers is not accessible. There is ongoing work (as part of the elfutils project) to develop a file server for debug information (
debuginfod), which would make such access possible. - The set of packages in an OpenShift container is fixed ahead of time, when the corresponding container image is built. Once a container is running, no additional packages can be installed. A few debugging tools are preinstalled in commonly used container base images, but any other tools must be added when the container image build process is configured.
To successfully debug a containerized application, it is necessary to understand these constraints and how they determine which debugging tools can be used.
Debugging tools preinstalled in container images
Most container base images for the OpenShift platform include at least a minimal level of preinstalled debugging functionality. General-purpose base images such as the Red Hat Enterprise Linux (RHEL) Universal Base Image include the gdbserver component of the GDB debugger, while container base images intended for higher-level language runtimes usually include debugging functionality specific to those runtimes.
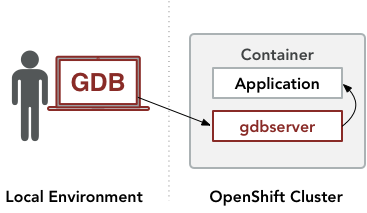
The general-purpose Red Hat Enterprise Linux container base images include the gdbserver component of the commonly-used GDB debugger. Gdbserver can be used by configuring an interactive GDB session that runs outside the OpenShift cluster to pass remote commands to a gdbserver instance within a container. This gdbserver instance has direct access to the containerized application. In response to remote commands from the GDB session, gdbserver will collect information from the application and pass it back to the GDB session:
The following debugging session illustrates how gdbserver can be attached to a program in a container based on the Red Hat Universal Base Image (UBI). The commands in this session should also work with containers based on earlier Red Hat Enterprise Linux container base images. This procedure was tested on an OpenShift 4.2.8 cluster managed with CodeReady Containers 1.2.0.
We begin the session by creating a container:
$ oc new-app --name='ubi8-example' nodeshift/ubi8-s2i-web-app:latest~https://github.com/lholmquist/react-web-app
Obtain the name of the container with the oc get pods operation:
$ oc get pods
NAME                        READY   STATUS             RESTARTS   AGE
ubi8-example-1-22wlk        1/1     Running            0          2m45s
ubi8-example-1-build        0/1     Completed          0          5m20s
ubi8-example-1-deploy       0/1     Completed          0          2m53s
To verify that the container includes the gdbserver package, use the oc exec operation to execute an rpm command within the container:
$ oc exec -it ubi8-example-1-22wlk -- rpm -qa | grep gdbserver
gdb-gdbserver-8.2-6.el8.x86_64
We need the process ID of the program we want to debug. To obtain it, execute a ps command within the container:
$ oc exec -it ubi8-example-1-22wlk -- ps -ax
PID TTY      STAT   TIME COMMAND
  1 ?        Ss     0:00 /bin/bash /usr/libexec/s2i/run
  9 ?        Sl     0:00 /usr/bin/node /usr/bin/npx serve -s /opt/app-root/output -l
 48 pts/0    Rs+    0:00 ps -ax
Next, launch a local GDB session and connect to gdbserver within the container:
$ gdb
(gdb) target extended-remote | oc exec -i ubi8-example-1-22wlk -- gdbserver --multi -
Remote debugging using | oc exec -i ubi8-example-1-22wlk -- gdbserver --multi -
Remote debugging using stdio
Here, GDB is instructed to connect to a gdbserver process in the container. This gdbserver process is started with an oc exec operation and configured to listen for commands on its standard input. The OpenShift infrastructure passes the standard input and standard output of the gdbserver process over the network to the local GDB session.
Next, instruct GDB to attach to the main server process in the container, which is identified by the process ID we obtained earlier:
(gdb) attach 9
Attaching to process 9
Attached; pid = 9
Reading /usr/bin/node from remote target...
...
0x00007fd1cb44228e in epoll_pwait () from target:/lib64/libc.so.6
At this point, GDB is ready to debug the process.
Restrictions on GDB functionality within OpenShift containers
In a Red Hat OpenShift container, certain GDB functionality could be unavailable depending on how the container is configured.
For example, GDB functions that depend on access to debug information will be unavailable. Although debug information packages are available in many Linux distributions, including Red Hat Enterprise Linux, these packages can only be included in a container image ahead of time, and cannot be installed in an unprivileged container once that container is already running.
Nevertheless, there is a subset of GDB’s functions which can be used in the absence of debug information:
- GDB can trigger breakpoints and tracepoints at function entry points.
- GDB can use the mechanism of statically-defined tracing (SDT) markers in order to trigger breakpoints or tracepoints on various high-level events in the program.
- GDB can generate a core file of the program’s memory. The core file can be saved and inspected outside of the OpenShift environment.
- GDB can obtain stack traces from the program.
The following example shows how the command thread apply all bt can be used to obtain a stack trace of each thread in a process:
    (gdb) attach 9
    (gdb) thread apply all bt

    Thread 11 (Thread 9.19):
    #0  0x00007fd1cb71747c in pthread_cond_wait@@GLIBC_2.3.2 ()
       from target:/lib64/libpthread.so.0
    #1  0x00005585ba200d7d in uv_cond_wait ()
    #2  0x00005585ba1eea22 in worker ()
    #3  0x00007fd1cb7112de in start_thread () from target:/lib64/libpthread.so.0
    #4  0x00007fd1cb442133 in clone () from target:/lib64/libc.so.6

    ...

    Thread 2 (Thread 9.10):
    #0  0x00007fd1cb44228e in epoll_pwait () from target:/lib64/libc.so.6
    #1  0x00005585ba203f7e in uv.io_poll ()
    #2  0x00005585ba1f3ea0 in uv_run ()
    #3  0x00005585ba10faa4 in node::WorkerThreadsTaskRunner::DelayedTaskScheduler::Start()::{lambda(void*)#1}::_FUN(void*) ()
    #4  0x00007fd1cb7112de in start_thread () from target:/lib64/libpthread.so.0
    #5  0x00007fd1cb442133 in clone () from target:/lib64/libc.so.6

    Thread 1 (Thread 9.9):
    #0  0x00007fd1cb44228e in epoll_pwait () from target:/lib64/libc.so.6
    #1  0x00005585ba203f7e in uv.io_poll ()
    #2  0x00005585ba1f3ea0 in uv_run ()
    #3  0x00005585ba0e3c7a in node::NodeMainInstance::Run() ()
    #4  0x00005585ba072eb4 in node::Start(int, char**) ()
    #5  0x00007fd1cb369873 in __libc_start_main () from target:/lib64/libc.so.6
    #6  0x00005585ba00f14e in _start ()
Secondly, GDB functions that require stopping the application are incompatible with periodic health checks. If a container has been configured to run periodic health checks, the OpenShift infrastructure will periodically send a message to the containerized application to verify that it is running. If the application has been paused by GDB, it will fail to respond to the message and OpenShift will restart the container on the assumption that the application has crashed. This restart will interrupt the debugging session and reset the application state. In this situation, it is not feasible to pause the program for an extended period of time. For such situations, GDB supports background execution and dynamic tracing. GDB’s background execution commands, such as attach&, allow GDB to attach to a program without pausing it. GDB’s tracepoint facilities can collect data while the program continues running.
Debugging tools for higher-level languages
Container base images that include higher-level language runtimes might include corresponding debugging functionality. For example, Java container images include support for the Java remote debugging protocol, and Node.js container images include the Node.js inspector agent. An earlier article by Jeff Maury describes how to enable and use debugging features in container images for the Java runtime, and an article by Lucas Holmquist describes how to enable and use debugging features in container images for Node.js applications.
Although many commonly used container base images include debugging facilities, there is no absolute guarantee that a container base image will include them. It is necessary to examine the contents of a container image in order to understand the included debugging facilities and determine whether additional packages need to be installed.
Installing debugging tools at container image build time
There are debugging tools that can be used within containers but are not preinstalled in container base images. Tools such as strace or Valgrind must be included in a container during the container image build process.
In order to add a debugging tool to a container, the container image build process must be configured to perform additional package installation commands. Whether or not package installation is permitted during the image build process depends on the method being used to build the container image. OpenShift provides several methods of building container images. These methods are called build strategies. Currently, OpenShift supports the Dockerfile, Source-to-Image (S2I), Pipeline, and Custom build strategies. Not all build strategies allow package installation: Of the most commonly-used strategies, the Dockerfile strategy permits package installation but the S2I strategy does not, because an S2I build process builds the container image in an unprivileged environment. A build process within an unprivileged environment lacks the ability to invoke package installation commands.
Debugging tool packages installed during the Dockerfile build process for a container image are included in that container image. For example, the following Dockerfile commands specify a container that includes the strace package:
FROM registry.access.redhat.com/ubi8/ubi-init
RUN yum -y install strace
Debugging tools requiring privileged containers
A debugging tool cannot operate within an OpenShift container if the container does not have the privileges to access the operating system functionality required by the tool. For example, the SystemTap default kernel module backend cannot operate in containers that lack the privileges to load kernel modules. Similarly, perf requires access to the kernel perf_events interface, and bcc requires access to BPF tracing functionality. These functions are not available within unprivileged OpenShift containers. In general, a debugging tool that requires elevated privileges can only be used within a privileged container created by a cluster administrator.
In general, to determine whether a debugging tool can be used within an OpenShift container, it is necessary to investigate the set of operating system interfaces the tool relies on, and then to identify whether the OpenShift container has sufficient privileges to access these interfaces. Commonly used debugging tools such as gdbserver or strace are able to operate within unprivileged OpenShift containers because they rely on the ptrace() system call, which is available by default in unprivileged containers.
Conclusion
This article gave a summary of various options for debugging a containerized application on OpenShift. Currently, in order to troubleshoot a running OpenShift application, it is necessary to anticipate the set of debugging tools that might be required, and steps must be taken ahead of time to ensure that these debugging tools will be present within the container.
Last updated: November 8, 2023