This is the third of a series of three articles based on a session I held at Red Hat Tech Exchange EMEA. In the first article, I presented the rationale and approach for leveraging Red Hat OpenShift or Kubernetes for automated performance testing, and I gave an overview of the setup. In the second article, we looked at building an observability stack. In this third part, we will see how the execution of the performance tests can be automated and related metrics gathered.
An example of what is described in this article is available in my GitHub repository.
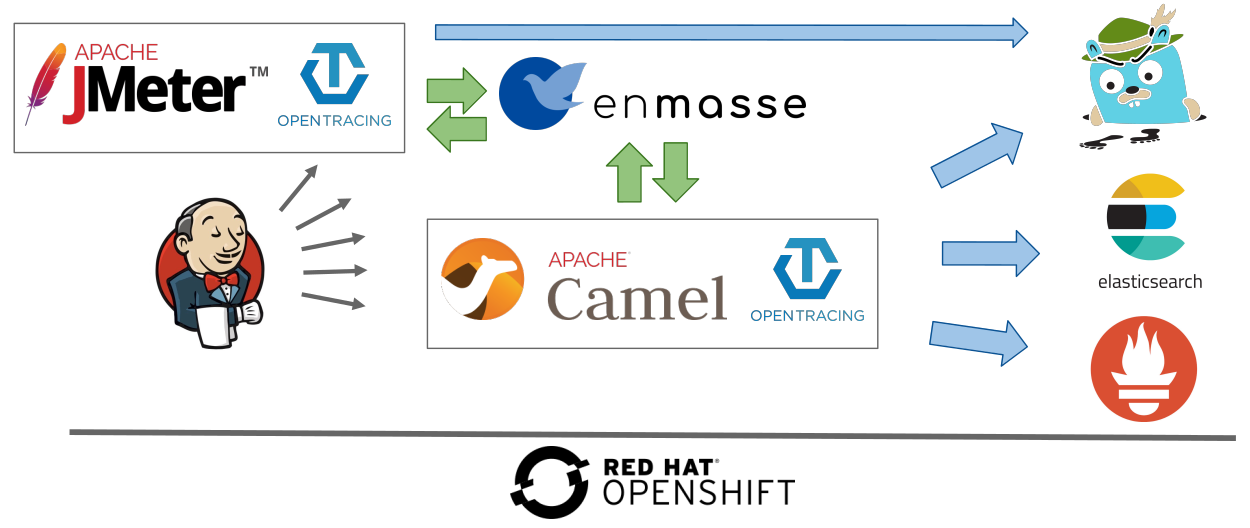
Overview of the setup
Test automation
Test plan
As we saw in the first article, there are several aspects that need to be taken into consideration for building a test plan that is representative of production scenarios and can easily be reused. Let's go through the examples provided in my GitHub repository and see how we can approach them.
My first advice was to use the JMeter GUI (I used JMeter 4 for this article) and its standard components for quick experimentation and as a feedback loop during the design phase. Here is an example.
When we are happy with the design, we can move on to writing custom components in Groovy (a dynamic language for the Java platform that's also compatible with Java syntax), which provides more power and flexibility but also requires more effort. See examples here. Running the JMeter GUI is as simple as downloading the archive, extracting it, and calling ./bin/jmeter.
Let's go through the JMS test suite using JSR 223 samplers (Groovy).
General structure
The test plan example is composed of the following:
- Thread groups containing controllers/samplers, timers, and data sets
- User-defined variables
- Listeners: a data writer and a back-end listener
Assertions are not used here.
Per the JMeter documentation, a thread group is the starting point of any JMeter test plan. All the elements of a test plan must be defined under the thread group. Setup and teardown thread groups are also used: they are special forms of thread groups used to perform necessary actions before and after, respectively, execution of regular thread groups. We use them for loading a message template and creating a connection to the broker.
We make use of global user-defined variables for allocating connection string parameters or for defining flags when we want the code to be processed only once inside a thread.
In regard to listeners, data writers and back-end listeners provide access to the information collected by JMeter about the test cases and allow it to be recorded in files (see Simple Data Writer) or InfluxDB (see Backend Listener).
Configuration externalization
There are two ways to pass properties to a JMeter test plan. The first is to define them in ./bin/user.properties. The second is to pass them at startup using -J, for example, -JBROKER. We will see how this latter form can easily be leveraged when JMeter runs in a container on OpenShift with a simple startup script passing injected environment variables as properties.
Properties can then be used among others in user-defined variables. This is what we are using, for instance, for the AMQP connection string:
${__P(BROKER,messaging-perftest.apps.sandbox.com)}amqps://${__P(BROKER,messaging-perftest.apps.sandbox.com)}:${__P(PORT,443)}?transport.trustStoreLocation=${__P(JKS_LOCATION,/myrepolocation/auto-perf-test/camel-amq-fakeapp/src/main/resources/amqp-certs/amqp.jks)}&transport.trustStorePassword=${__P(JKS_PWD,redhat)}&transport.verifyHost=false
With this example, if no parameter named BROKER is passed, the default value, messaging-perftest.apps.sandbox.com, applies. The variable can then be retrieved in Groovy with vars.get("connection_string") and the property with props.get("PAIN_TEMPLATE_LOCATION"). In a declarative component, ${connection_string} (confer the JMS Purge element in the example provided in my GitHub repository) can be used.
The same strategy applies to certificate configuration where the Java Key Store (JKS) location and password are passed as properties. The JKS itself is injected into the container file system by mounting a secret containing it.
Furthermore, test parameters like the number of messages, the injection rate, the duration, and so on can be injected through properties so that different test cases can be run one after the other without human intervention or replicating the test code.
Data sets
As stated in part 1 of this series, we should use data sets that are representative of the data in production. It should be possible to reuse them between runs. JMeter provides a convenient way for that through CSV Data Set Config. It is indeed possible to provide a CSV file with headers like this one. Variables are created using the header names and populated with the raw values. The next line of the CSV file is used by the next iteration. This, combined with Groovy templating capabilities, is a strong tool for creating workloads that reflect the diversity of production data and the occurrences of different patterns. A simple XML template is used as part of the demo.
Additional libraries
It is often required to provide libraries to JMeter so that the test plan can send messages to a broker or integrate with external systems like Jaeger. Therefore, the desired libraries just need to be added to the JMeter lib directory.
Cleansing first
We saw previously that a clean environment is required before the tests can be run. Therefore, the test plan purges the queues. Using thread groups with different offsets (startup delay), it is possible to let the purge action finish before messages get sent to the broker. This was configured in the test plan using the JMS point-to-point component.
Injection pattern
In the first part, we saw that latency and, to some extent, throughput get impacted by the way messages get injected. JMeter allows re-creating complex injection patterns using various timer components. In the demo, we have configured a constant throughput timer that targets sending 600 messages per minute. This is applied to all active threads in the current thread group, but JMeter allows other options and provides various timers out of the box. If none of them are suitable, it is also possible to code one in Groovy.
Extending observability
Measurement points matter for getting the real story and having test results that reflect what is expected from the application in production. With brokered messages, the enqueued time spent by messages is often more important than the time required by the application for processing.
To get values close enough to the end-to-end elapsed time, it is possible to use JMS timestamps. This is what has been done in the demo. The sender sets the time when the message is ready to be sent, and the receiver subtracts it from the JMS timestamp set by the message publisher inside the application. It is still an approximation, but it's usually not off by more than a few milliseconds. This allows moving away from the requirement of "instantaneous" reads.
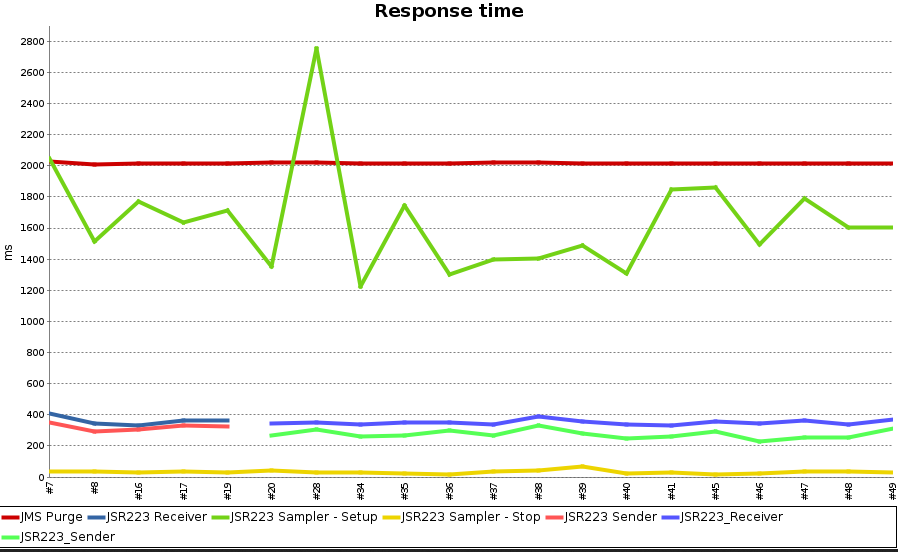
All the results gathered by JMeter can be saved in a file. This is what is done by the simple data writer in the demo. JMeter is also able to export results to InfluxDB. A backend listener does that out of the box (as in the demo). It is again possible to use a Groovy script for this purpose, which would provide additional flexibility in terms of data selection.
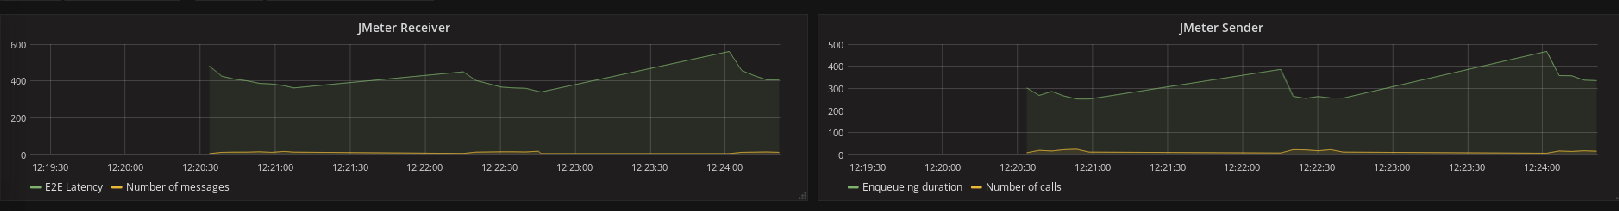
The JMeter data in InfluxDB can be retrieved and displayed through Grafana. This is what is done in the dashboard presented in the second part of this series. Here are the JMeter graphs.
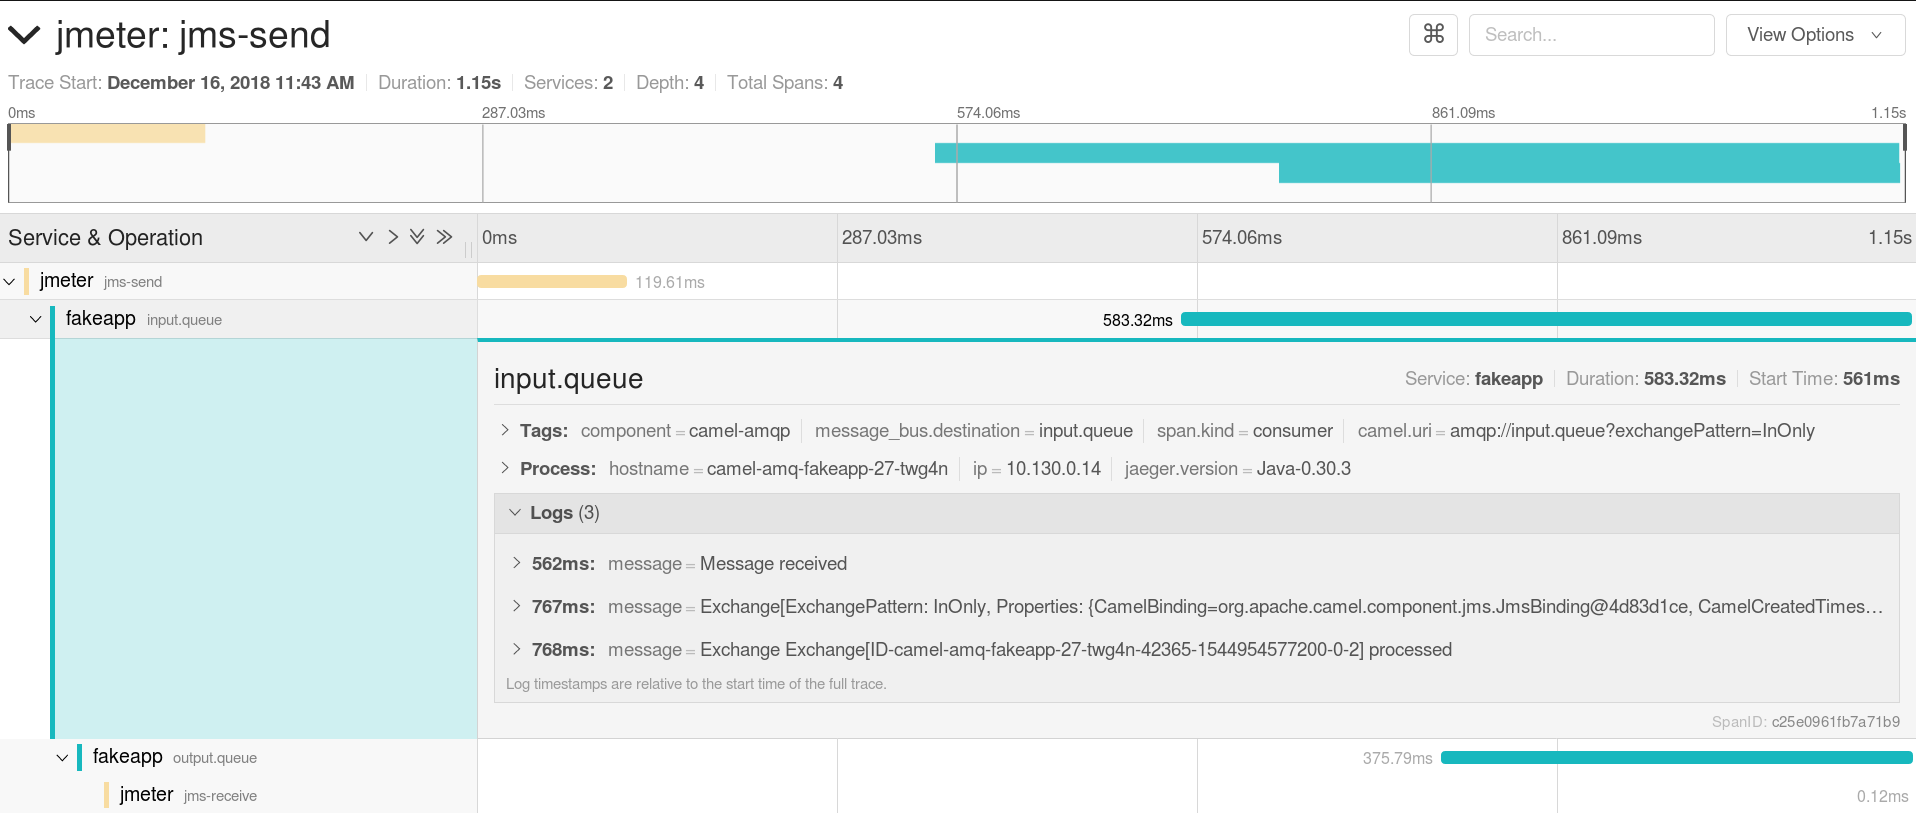
In a similar way, the tracing span we saw in the previous article can be extended to include a JMeter sender and receiver. For the demo, the OpenTracing and Jaeger libraries have been added to the lib directory. A tracer is created per thread in the setUp Thread group and added to the properties. It can then be retrieved in the sender code, where a TracingMessageProducer is used instead of the standard JMS producer. Similarly, a TracingMessageConsumer is used with the tracer instead of the standard JMS component in the consumer code. This produces the result in Jaeger that we already saw in the previous article.
Containerization
The first step for running JMeter in a container is to create an image with it and the libraries we have added. This is done through this Dockerfile in the demo.
Another aspect is that the parameters need to be provided to the JMeter process at startup. The startup script does that. The logic is based on the following convention: every environment variable prefixed with J_ gets passed to the JMeter process.
The script also runs the test plans that have been provided in a specific directory. This allows us to mount a configMap into the container file system and have the test plans provided by it with the required data sets and templates executed without the need to re-create a container image. In a similar way, certificates used to communicate with the broker are injected through secrets and mounted into the container file system. The test results are stored on a persistent volume, which makes it possible to have the same directory mounted into the Jenkins container.
Finally, the script makes a REST call if a URL has been provided to notify Jenkins (it would work with other CI tools as well) that the execution of the test plan(s) has completed.
The last point is that a sidecar container is used for taking over the communication with the Jaeger server. This can be seen in the deployment configuration.
Detailed instructions on how to build the container image and run it on OpenShift are available in my GitHub repository.
Orchestration
The last missing bit is how can we automate the complete chain: from re-creating a clean environment with the latest code version to triggering the test run, asserting the results, tagging the code, performing configuration, creating container images and eventually promoting them to the next environment?
Pipeline
Jenkins is the tool of choice for CI/CD on Kubernetes and it is shipped with OpenShift. Pipelines are the recommended approach for automating these processes. When you start using Jenkins and pipelines for more and more components, you will see lots of similarities between them. For reusability, it is then best to use shared libraries. This was not done in our demo, but it is a simple task left to the reader.
Let's look now at the steps of the demo Pipeline.
Trigger
Ideally, performance tests would run after every commit to the trunk. They should indeed be part of non-regression testing. There are plugins for integrating with various version control systems (VCS) like this one, which enable just that. It may, however, not be possible due to high resource requirements or the length of the tests. In that case, on-schedule runs are the next best thing. This can be done with the following single line in our Jenkins file, which will execute the pipeline once a day with automated distribution (you don’t want all your tests to be triggered at the exact same time).
cron('H H * * *')
Interacting with the OpenShift cluster
The necessary plugins for interacting with OpenShift come configured out of the box with the default Jenkins container. Lots of operations are then made easy by the OpenShift Jenkins pipeline plugin, for instance, displaying the name of the current project:
openshift.withCluster() {
  openshift.withProject() {
    echo "Using project: ${openshift.project()}"
  }
}
Clean sheet
When we run our test plan, we want to make sure that we are testing the desired code version and that there is no impact due to leftovers from previous test runs. Therefore, "delete and re-create" is the best approach. This can be done at the project/namespace level or labels can be used for a fine-grained approach. It is easy to apply a common label to all the objects deployed as part of the test run. They can then be retrieved and deleted using the following lines, where testPlanName is specific to the pipeline or pipeline run if we want to allow parallel runs.
if (openshift.selector("all", [ "testplan" : testPlanName ]).exists()) {
  openshift.selector("all", [ "testplan" : testPlanName ]).delete()
}
// all not being all
if (openshift.selector("secrets", [ "testplan" : testPlanName ]).exists()) {
    openshift.selector("secrets", [ "testplan" : testPlanName ]).delete()
}
if (openshift.selector("configMaps", [ "testplan" : testPlanName ]).exists()) {
    openshift.selector("configMaps", [ "testplan" : testPlanName ]).delete()
}
Provisioning
Templates may be used for creating the required objects:
openshift.withCluster() {
  openshift.withProject() {
    // "template" is the name of the template loaded in OpenShift
    openshift.newApp(template)
  }
}
Or single objects can also be created:
def testPlanPath = 'https://raw.githubusercontent.com/fgiloux/auto-perf-test/master/jmeter/openshift/apt-jmx-cm.yaml'
def testPlanCm = openshift.create(testPlanPath).object()
// Applying label makes it is easy to recognise for cleansing
testPlanCm.metadata.labels['testplan'] = testPlanName
openshift.apply(testPlanCm)
However, in real life you may want to have the complete configuration stored in a VCS, checked out, and created by the build pipeline from the cloned repository (same code as above executed in a loop over the config files available in a directory).
Building the application image
For this, there are two schools of thought. The simplest approach is to have the build done in OpenShift with S2I. In that case, you would just start the build (potentially passing the repo branch/tag as a parameter) using a build configuration created during the environment provisioning, and OpenShift does the rest:
def builds = openshift.selector("bc", 'camel-amq-fakeapp-s2i').startBuild("--wait=true")
Another approach is to use a Maven slave (running in a container on OpenShift) to build the artifacts, push them to an artifact repository (like Nexus or Artifactory), have them scanned through SonarQube, and released (version number updated) and used for building the final container image with the source code, image, and artifacts similarly tagged. However, describing this goes beyond the scope of this article.
Rolling out the application
Now that the image has been created, we can run the application in our test environment and wait until it has been started before the tests are launched:
def dc = openshift.selector("dc", 'camel-amq-fakeapp').rollout()
timeout(5) {
    openshift.selector("dc", 'camel-amq-fakeapp').related('pods').untilEach(1) {
        return (it.object().status.phase == "Running")
}
Test plan execution
We are now far enough along that the tests can be run. We may first want to register a webhook, which is passed to the script running JMeter that we saw earlier:
def hook = registerWebhook()
def callbackUrl = hook.getURL()
The next step is to run JMeter (best as a job) with the required parameters, where BUILD_NUMBER is automatically generated by Jenkins and identifies the run:
def models = openshift.process("apt-jmeter-job", "-p", "JMX_CONFIGMAP=${testPlanName}","-p","RESULT_SUB_DIR=${JOB_NAME}/${BUILD_NUMBER}","-p","CALLBACK_URL=${callbackUrl}")
The Jenkins plugin lets us easily manipulate the object definition and, for instance, add a label to our job:
for ( o in models ) {
  o.metadata.labels['testplan'] = testPlanName
}
The result can be applied to OpenShift:
def created = openshift.create(models)
At this point, the JMeter container is executing the test plan. We can wait until it has finished:
timeout(10) {
  print "Waiting for tests to complete..."
  waitForWebhook hook
}
As we saw earlier, the test results are available on a shared drive mounted by Jenkins, so we can get them now processed by the Jenkins performance plugin:
perfReport sourceDataFiles: "/opt/performances/${JOB_NAME}/${BUILD_NUMBER}/*.jtl", compareBuildPrevious: true, modePerformancePerTestCase: true, modeOfThreshold: true, relativeFailedThresholdPositive: 50, relativeUnstableThresholdNegative: 40, relativeUnstableThresholdPositive: 40
// Job delete required due to the jaeger-agent sidecar not terminating with JMeter
openshift.selector('job', ['testplan': testPlanName]).delete()
This plugin provides a few graphs that give a quick overview of how the tests performed.
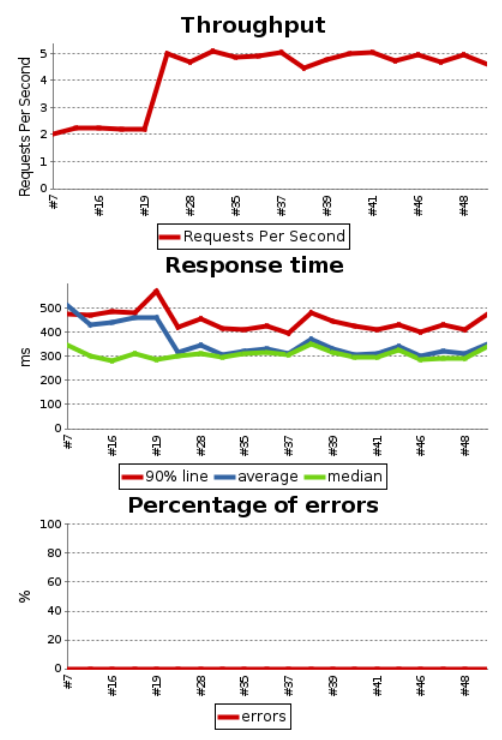
More importantly, the plugin provides the possibility of conditioning the pipeline result and next stages (pass or fail) on thresholds or deviations of previous runs.
Tagging
Finally, we may want to tag our image according to the outcome:
openshift.tag("camel-amq-fakeapp:latest", "camel-amq-fakeapp:staging")
Image extension
As we have seen going through the pipeline we may use additional plugins. In a disconnected environment, it is required to add them to the Jenkins image. In OpenShift, this is straightforward through the S2I process. The standard Jenkins template has also been amended to have the Jenkins container mount the persistent volume with the test result. This is available here.
Conclusion
Whew; this was quite a long series! Congratulations to the readers who made it to the end. My last sentence is for saying thanks to my colleague Shrish Srivastava, who helped me with Prometheus and Grafana.
All articles in the "Leveraging OpenShift or Kubernetes for automated performance tests" series
- Part 1: Rationale and approach
- Part 2: Building an observability stack
- Part 3: Automating tests and metrics gathering (this article)
Last updated: March 27, 2023