This is the first article in a series of three articles based on a session I hold at Red Hat Tech Exchange EMEA. In this first article, I present the rationale and approach for leveraging Red Hat OpenShift or Kubernetes for automated performance testing, give an overview of the setup, and discuss points that are worth considering when executing and analyzing performance tests. I will also say a few words about performance tuning.
In the second article, we will look at building an observability stack, which—beyond the support it provides in production—can be leveraged during performance tests. Open sources projects like Prometheus, Jaeger, Elasticsearch, and Grafana will be used for that purpose. The third article will present the details for building an environment for performance testing and automating the execution with JMeter and Jenkins.
Rationale
More and more companies are putting significant efforts into reducing the time it takes to bring product innovation to market or for adapting to market and regulatory changes. This has created a surge of interest in microservice architectures and DevOps practices.
More frequent releases sound great, but they also bring a number of challenges. With monthly, weekly, or daily releases, it is critical to avoid breaking things when releasing code to production. Testing is the primary way to build confidence that the code is ready for release. However, some types of testing has traditionally required weeks to months of manual effort, which is unsustainable with the pace of releases we are now talking about. Automation is becoming critical.
Functional tests have historically had a fairly good level of automation through the use of unit tests that run when an application gets built. That is not the case with nonfunctional integration and performance tests. Even though this article focuses on performance aspects, the approach and setup can be reused for nonfunctional and integration aspects.
Setup overview
This figure shows an overview of the setup process:
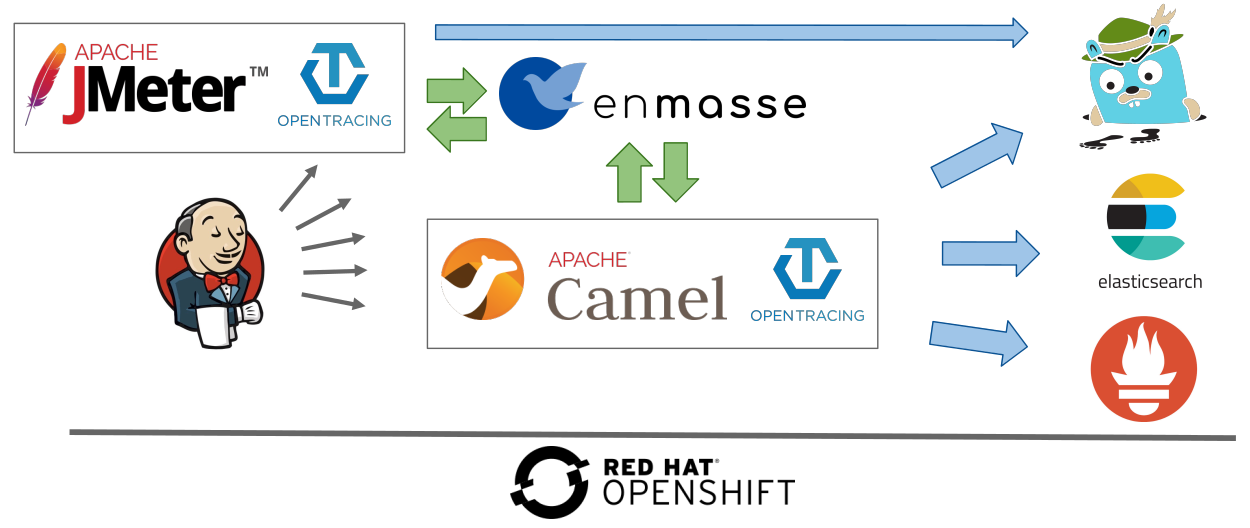
Application aspects
The application I use for a demonstration is a very simple Camel route consuming messages from a queue and forwarding them to another queue. The application can be configured for injecting some load and latency, but really the interesting part is not the application itself but everything around it.
I decided to use asynchronous communication because that is something I see increasingly used by customers who are embracing microservices and event-driven design. It is also interesting because most JMeter and OpenTracing examples and documentation are focused on synchronous calls. Bringing asynchronicity into the picture makes it slightly more complex.
All the application code and instructions for reproducing the setup can be found in my Github repository.
Configuration externalization
An important characteristic and the main benefit of container images is that they are immutable. This drastically simplifies the release process and decreases the level of risk inherent in it. Regarding tests, immutability also makes it easy to guarantee that what has been validated is what is promoted to the next environment: from integration to UAT to staging to production, for instance.
For this to work, it is important to remove specific details of the runtime environment such as database connection info, message broker addresses, or credentials from the application and the container image. In Kubernetes and OpenShift (Red Hat's enterprise distribution of Kubernetes), these details can easily be made external by using configMaps and secrets. Data in configMaps and secrets can be injected into a running container either as environment variables or as files mounted into the container file system. Both work in a similar way, but secrets have additional restrictions for guaranteeing the confidentiality of sensitive information.
But what about application tuning parameters? By that, I mean things like the number of message consumers, the size of connection pools, etc. These parameters can have a big impact on the behavior of the application in production, which speaks for having them buried in the immutable container image. Remember: we want to promote exactly what we have tested. On the other hand, not being able to modify them during the performance tests (we would need to re-create the image) may slow down or reduce the breadth of the tests that can be run in a period of time.
I see two options:
- The first option is to comply with the immutable principle and to have the tuning parameters be part of the image. This would need to be supported by a more complex continuous integration pipeline. This pipeline would create several images with different tuning parameters.
- The second option is more pragmatic. It consists of externalizing these parameters into configMaps as well. To mitigate the risk of releasing something different from what has been tested, the source of the configMaps information should be recorded in a version control system such as git or a CMDB and tagged for each release. I recommend not having these files directly with the code. Having them in a different repository helps with "promoting" the configuration in a similar way as we would promote our code without the need to create a new code release when only the configuration has changed. Having separate repositories for each environment (integration, UAT, production) allows us to have a clear picture of what version is running in each environment and to easily promote the code from one to another.
Observability

Running automated performance tests is a great thing, but for them to bring their full value we need to understand how the application behaves when put under load. Leveraging the observability features built for production readiness is a straightforward way of getting this insight: identifying bottlenecks, error states, resource consumption under load, etc. Three pillars can be used for that:
- Application metrics, which can be collected through JMX/Jolokia or Prometheus endpoints, for instance
- Application traces/performance, which can be captured thanks to OpenTracing and Jaeger
- Logs, which with OpenShift automatically are aggregated into Elasticsearch and made available for querying and reporting in Kibana when the application writes them to the standard output
I have also used with some success commercial products covering the first two points. However, as open source projects, Prometheus and Jaeger have the advantage of getting ideas, innovation, and commitment from more than a single company.
We will take a closer look at the setup of the observability layer in my second article.
Broker and external services

Applications rely on an infrastructure to fulfill usual functions such as message brokering here. Load balancing or state persistence are other examples. The challenge introduced by these systems is that they are often shared. The results of performance tests may, hence, be influenced by external factors. File system reads and writes and network communication may also be influenced. There are, however, a few mitigation strategies:
- We can monitor our infrastructure to see how much load it is handling besides the load created by the application tests and we can identify whether there is contention.
- The good thing with automated tests is that we can schedule them at a later point in time and select a time when traffic external to the application is minimal.
- We can use infrastructure, which provides good isolation.
Regarding this last point, I like the approach taken by the message broker used in this demo. EnMasse, created with OpenShift in mind from day one, can spawn a new, dedicated broker on demand. We can have it provisioned for the test run and decommissioned afterward. No other application is using the broker, which provides isolation and decommissioning after test runs ensures minimal resources are reserved. Monitoring the broker will also provide confidence that it is not a limiting factor with respect to performance under load.
Test automation
For test automation, I am relying on two tools:
- JMeter for load creation
- Jenkins for the orchestration
Both tools can leverage OpenShift and run as containers on it. I will demonstrate how this can be done in my third article.
JMeter

Many tools are available for supporting test automation, such as JMeter, Gatling, Locust, Grinder, and Tsung. They provide a robust, scalable, and flexible way to produce test loads. Message templates, test data sets, or load injection patterns can easily be configured. An aspect that I like in JMeter is the possibility to design and experiment tests using its UI and let them run afterward from the command line, which is a must for scheduled tests with higher load. The UI also helps when we need to interact with less-technical staff in the design phase or have them change and refine the test cases once the technical aspects have been settled.
Similar to what has been said for the application, it is advantageous to externalize test parameters (the number of messages, injection rate, duration, etc.) so that different test cases can be run one after the other without human intervention or replicating the test code.
Running JMeter as a container makes its setup easily portable and disposable. OpenShift also allows you to control the resources that are allocated to JMeter and the application and it provides access to a larger resource pool. When the tests are finished, both can be disposed of.
Observability is also relevant for JMeter to make sure that it is not under resource constraints nor is it a limiting factor for performing the tests; briefly stated, it ensures that the thermometer is not broken. Another aspect is that it also helps with measuring performance at boundaries. When you use OpenTracing, it is not enough to know how long the application took to process a message; it is also important to know how long the message waited in the queue before being picked up. Instrumenting JMeter can provide a better approximation of that.
Jenkins

For running automated tests, it is best to have a conductor. That is what Jenkins is. It will automate
- builds
- provisioning of the environment
- deployments
- the triggering of test execution with various configurations
- cleansing/decommissioning
It may also provide a high-level view of the test results: pass or fail. It also integrates nicely with JMeter to have a quick view of trends. By adding the capability to build from scratch and decommission at the end of the tests, Jenkins provides confidence that what is tested is what was intended and tracked in the version control system.
Jenkins allows us to have the tests run on schedule and/or, for instance, every time a change is committed to the trunk. It is the tool of choice for continuous integration and continuous delivery. It provides the necessary functions for making performance tests a part of automated nonregression testing.
Considerations
Be aware of the following considerations.
Avoiding wasting resources
Performance tests often require a significant amount of resources because it is best to run the tests in an environment that replicates production. By leveraging OpenShift and Jenkins pipelines, it is possible to create in minutes an environment for the time the tests are run and to decommission it right after. By doing that, we don’t need to mobilize the resources for longer than required, which may mean significant savings in energy and costs.
Repeatability
Being able to see the impact of code or configuration changes on performance allows us to understand the trade-offs made by a design or an implementation decision and to react quickly when we don’t feel comfortable with the implications. The delete and re-create approach offers a clean starting point for comparing apples to apples between runs. Moreover, it provides confidence that what is being tested is also what is available and tagged in repositories (code source, configuration, and container registry).
With a highly dynamic platform such as OpenShift, it is important to make sure that the same amount of resources can get mobilized during runs in order to be able to compare them. Therefore, we need to configure the deployments with CPU/memory requests that are equal to the CPU/memory limits. We don’t want to allow any fluctuation of resources based on the load (by other applications) of the nodes where the component instances are running. This differs to what we may have in production, where we may want to mobilize as many resources as available.
In a similar way, it is important to limit contention at the broker level, network, or file system, as stated earlier. It is best to monitor the broker, I/O, and NIO during the tests.
Data set
Latency and throughput are often significantly affected by the data being processed. It is important to have a data set representative of the data in production that can be reused between runs. As to the difference in functional testing, it is not only necessary to account for the diversity of production data but also for the occurrences of specific data sets. It is best to use a real production data set that may have been anonymized if the data is sensitive.
In this respect, Kafka is very interesting with its "replay" capability. Its use would, however, require a very different architectural design and test approach, which are out of scope for this article.
Injection pattern
It is important to know the injection pattern of data in production for creating significant test cases because latency and, to some extent, throughput are affected by it. Is our application processing a batch or streams of messages? Are there strong variations during a day, a minute, or a second? 1.8 million messages per hour is not the same as 30,000 messages per minute or 500 per second. Uniform distribution is not a given. I have seen systems that were performing quite well with 1.8 million messages per hour uniformly distributed, but the SLA was missed for 90% of the messages in real life due to batch injection. It only took 20 minutes to inject the messages and this was happening every hour.
In the opposite way, another system was performing poorly under tests. About 80 messages were injected every second, as fast as the mock component could do. Distributing the messages evenly over the second 90% of the messages met the targeted SLA. This is, by the way, configurable in JMeter.
In case of a greenfield application, assumptions on the injection rate will need to be made and revisited as soon as some experience has been gathered in production.
Measurement points
The following graphics depict how a component is coping with the load. The first shows a component that is coping with the load; the second shows a component that is not coping with the load.
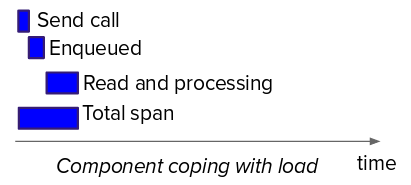
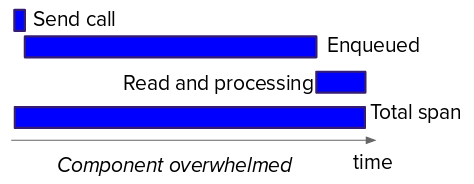
To get the real picture of how an application is performing, it is important to pay attention to the measurement points. When you are looking at applications using brokerage, the time the message is enqueued is more relevant than the time it is dequeued by the customer (also, both provide valuable information). When the component is not able to cope with the load, the time spent by messages waiting to be processed is affected the most. The above diagrams provide an idea: look for a usual pattern of how the time spent in "enqueued" and "read and processing" evolve when components get overwhelmed.
There is also quite a lot of confusion on memory consumption with Java applications. The heap size and its utilization ratio is just part of the picture. Metaspace and thread stacks (the default setting may be up to 1MB per thread) may also take a significant part. On top of that, comes the memory utilized at the system level for opened files/sockets, for instance. The memory used at the system level is not that easy to account for due to the way the operating system optimizes its use with sharing and caching. When the application runs inside a container on OpenShift, the values reported by cgroups are the ones to monitor.
Coordinated omission
The idea with coordinated omission is that the response time of the system under test may affect the measurement. JMeter is configured with a limited number of threads and also has limited resources. If the call to send messages is blocked for a longer period of time, which also means high latency, that may also prevent JMeter from sending the targeted number of messages during the interval; hence, it will result in getting fewer measurements when the system behaves badly. This would distort the latency percentile and average values that are calculated. This demo aims at validating application (not broker) performance/behavior. There is also the possibility to publish asynchronously and, hence, nonblocking. With this in mind, I can make the following assumptions:
- JMeter is able to produce the load requested (thanks to the scalability provided by OpenShift)
- The broker is able to ingest the messages in a timely fashion (not blocking JMeter)
Interesting resources on coordinated omission and latency measurements are available here and here.
Performance tuning
When reporting on test results, it is handy to have two levels. A simplistic one, which only tells whether the test passed or failed with a high-level view of trends, and a second level, which can leverage observability and provides valuable information for troubleshooting performance issues or degradation. It is critical to see in a few minutes how the application performed during tests. If it takes too long for the analysis, the team won’t look at the results on a regular basis. When we talk about performance, we usually look at three aspects:
- Throughput
- Latency
- Resource (RAM, CPU, etc.) consumption
Application stages

Looking at performance tuning, it is important to understand and decide on what we want to optimize and what we are ready to compromise on. Besides performance versus resource consumption, the application may behave differently during the following phases depending on the choices that have been made:
- Startup
- Initialization
- Steady state
- Peak load
In the past, tuning has usually been done for peak load, the time when the application is most challenged to meet its SLA. Startup and initialization were rare events. Moving to disposable containers, the choice may not be that clear anymore. Considering auto-scaling, cluster rebalancing containers may get stopped and started more frequently. Being able to auto-scale does not help if our application instance needs minutes to start and we have to respond to the load created by the start of a batch producing thousand of messages per seconds. Also, the first messages processed after startup may have a higher latency during the warmup phase (JIT compilation and optimization, pool loading, etc.).
When conducting tests, warming up the application is something that we may want to consider.
In term of tuning, there are several decisions and trade-offs to be made, which will impact throughput and latency at different phases and startup time:
- Should all libraries be loaded during startup?
- Should connection and other pools be fully populated during startup?
- Would SubstrateVM and AOT compilation (reducing startup time and memory consumption at the cost of lower throughput) become options?
Tuning hints

There are a few screws that can be adjusted to improve performance. Here is a non-exhaustive list for the application type described in this article:
- Message ordering: Guaranteeing message ordering prevents parallelism or requires reordering, which usually has a big impact on performance. It should be done only when it is strictly required. It is often worth investigating where it can be relaxed for part of the processing.
- Prefetch strategy: Prefetch is a very useful optimization for throughput. It prevents the application threads from waiting for the message to be fetched from the broker over the network before the message can get processed. With nonexclusive consumers we should, however, pay attention that one instance does not starve the pool of waiting messages; otherwise, we may end up with the funny pattern where instance 1 consumes and process up to, let's say, 50 messages (the prefetch size) when instance 2 does nothing followed by instance 2 consuming and processing 50 messages while instance 1 does nothing, and so on.
- Thread contention: If we have a multi-threaded application, we need to pay attention to the amount of time the threads spend in blocked or waiting states.
- Context-switching: More threads does not mean better throughput. The time spent in context switching may significantly impact performance. We need to be in control of the number of threads created by our application.
- Pools, memory retention, and garbage collection: This is a large topic and I can recommend this article. It should also be noted that changes related to the points previously mentioned may affect any tuning made on garbage collection.
- I/O and file system: For several good reasons, a container usually writes to network storage rather than to the local file system. This may introduce additional latency. Asynchronous writes and caching may, for instance, be considered for mitigating the impact.
Conclusion
Thanks for reading this article. I hope you found this first part interesting. The second part will present how observability can easily be built using very successful open source projects. The third and last part will do a deep dive into test automation and orchestration.
