Redhat Developers  Logo
  • Products

    Platforms

    • Red Hat Enterprise Linux
      Red Hat Enterprise Linux Icon
    • Red Hat AI
      Red Hat AI
    • Red Hat OpenShift
      Openshift icon
    • Red Hat Ansible Automation Platform
      Ansible icon
    • See all Red Hat products

    Featured

    • Red Hat build of OpenJDK
    • Red Hat Developer Hub
    • Red Hat JBoss Enterprise Application Platform
    • Red Hat OpenShift Dev Spaces
    • Red Hat OpenShift Local
    • Red Hat Developer Sandbox

      Try Red Hat products and technologies without setup or configuration fees for 30 days with this shared Red Hat OpenShift and Kubernetes cluster.
    • Try at no cost
  • Technologies

    Featured

    • AI/ML
      AI/ML Icon
    • Linux
      Linux Icon
    • Kubernetes
      Cloud icon
    • Automation
      Automation Icon showing arrows moving in a circle around a gear
    • See all technologies
    • Programming languages & frameworks

      • Java
      • Python
      • JavaScript
    • System design & architecture

      • Red Hat architecture and design patterns
      • Microservices
      • Event-Driven Architecture
      • Databases
    • Developer experience

      • Productivity
      • Tools
      • GitOps
    • Automated data processing

      • AI/ML
      • Data science
      • Apache Kafka on Kubernetes
    • Platform engineering

      • DevOps
      • DevSecOps
      • Red Hat Ansible Automation Platform for applications and services
    • Secure development & architectures

      • Security
      • Secure coding
  • Learn

    Featured

    • Kubernetes & cloud native
      Openshift icon
    • Linux
      Rhel icon
    • Automation
      Ansible cloud icon
    • AI/ML
      AI/ML Icon
    • See all learning resources

    E-books

    • GitOps cookbook
    • Podman in action
    • Kubernetes operators
    • The path to GitOps
    • See all e-books

    Cheat sheets

    • Linux commands
    • Bash commands
    • Git
    • systemd commands
    • See all cheat sheets

    Documentation

    • Product documentation
    • API catalog
    • Legacy documentation
  • Developer Sandbox

    Developer Sandbox

    • Access Red Hat’s products and technologies without setup or configuration, and start developing quicker than ever before with our new, no-cost sandbox environments.
    • Explore the Developer Sandbox

    Featured Developer Sandbox activities

    • Get started with your Developer Sandbox
    • OpenShift virtualization and application modernization using the Developer Sandbox
    • Explore all Developer Sandbox activities

    Ready to start developing apps?

    • Try at no cost
  • Blog
  • Events
  • Videos

Building a oversaturation detector with iterative error analysis

November 24, 2025
Alon Kellner
Related topics:
Artificial intelligenceData ScienceObservabilitySystem Design
Related products:
Red Hat AI

    Sometimes mistakes are opportunities, and wasting half of your LLM performance benchmarking budget, as we discovered in part 1, was one heck of an opportunity. In part 2, we covered how we built the ideal metric to define success (the Soft-C-Index metric) and our augmented dataset.

    Now, we're finally ready to build the oversaturation detector (OSD) itself.

    The first time we tried to build our OSD was before we had our 4,506-run dataset, so we tried to model the oversaturation problem theoretically. We designed a complex, elegant algorithm based on our whiteboard assumptions. Once we had real data, our entire theoretical model broke. When put to the test, our "smart" modeled algorithm was one of the worst performers. It was time to throw the theory out and follow the data.

    Building an oversaturation detector

    We adopted a process of iterative error analysis. The loop is simple:

    1. Start with a simple baseline algorithm.
    2. Evaluate it and find where it fails (the errors).
    3. Form a hypothesis about why it failed.
    4. Create a simple new rule to fix that one error.
    5. Go back to step 2.

    We started by analyzing the errors. Here's what the data showed us.

    Insight 1: The messy start

    Our first baseline algorithms were a mess, constantly firing false alerts (stopping good runs) in the first minute. We looked at the Time to First Token (TTFT) and total concurrent requests plots of these good runs to see why.

    The clue

    Look at the concurrent (blue) and TTFT (yellow) plots in Figure 1. The first minute is erratic and noisy before it ramps up and stabilizes. Our algorithm was mistaking this initial chaos for real saturation.
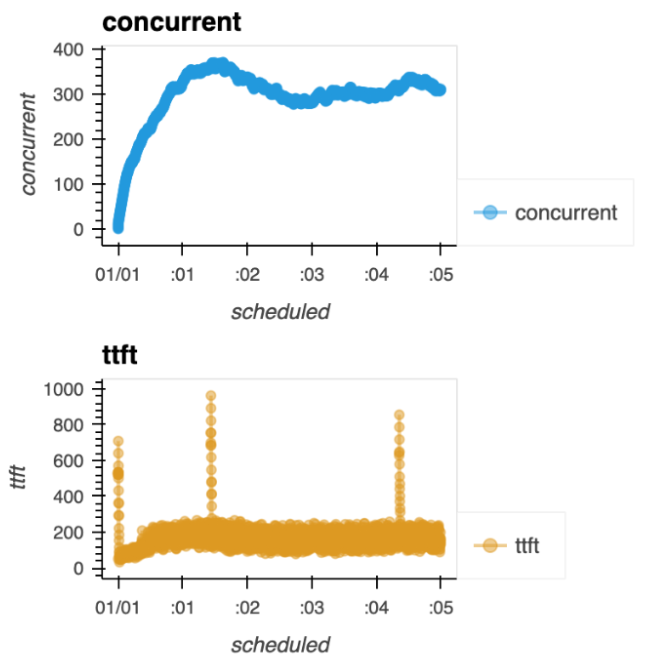
    Two time-series performance metrics, "concurrent" and "ttft," showing how the concurrent load stabilizes around 300 while the ttft metric experiences several temporary, sharp spikes.
    Figure 1: A good (undersaturated) run. Our algorithm kept flagging the messy ramp-up phase at the beginning as "panic."

    The fix

    We built our first rule: Ignore the initial phase. We ignore the first 25% of requests. This simple rule dramatically reduced our false alerts.

    Insight 2: The indistinguishable shoot-up

    Our next error analysis showed we were still flagging good runs, even after the 25% fix.

    The clue

    We found a strange "shoot-up" phase: before the very first request is completed, the number of concurrent requests increases in a perfectly linear line (Figure 2). During this brief window, a good run and a bad run look identical.
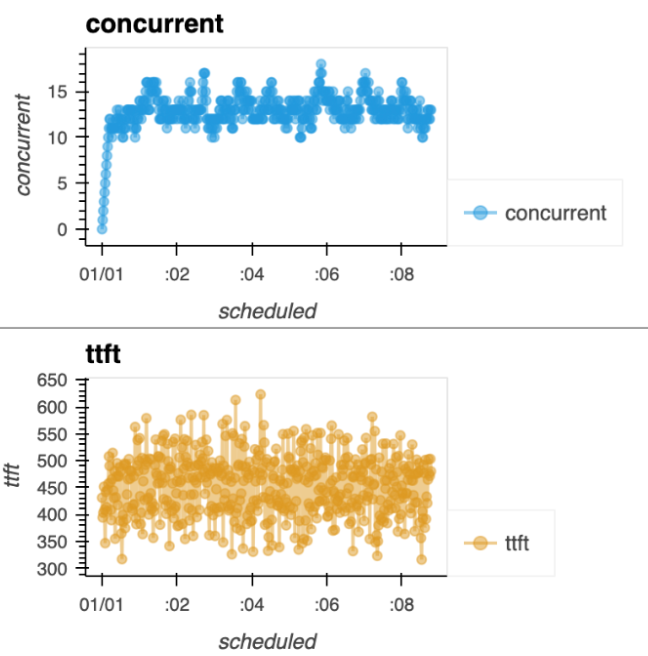
    Concurrent requests and TTFT plots over time. At the very first few seconds the concurrent requests seem to shoot up, then they stabilize, the TTFT starts stable.
    Figure 2: Another good (undersaturated) run. Notice how concurrent requests (blue) surge in the first few seconds.

    The fix

    We added a grace period. The algorithm must now wait at least 30 seconds and wait until the median TTFT is over 2.5 seconds (proving the server is actually delaying responses) before it can raise an alert.

    Insight 3: The "true panic" signal

    With our false alerts now mostly fixed, we had the opposite problem: we were missing real saturation.

    The clue

    The graph in Figure 3 is the "panic" we described in part 1. Look at the concurrent (blue) plot and the TTFT (yellow) plot. They aren't just messy—they are climbing in a consistent, relentless, positive line. This is the true signal of oversaturation.
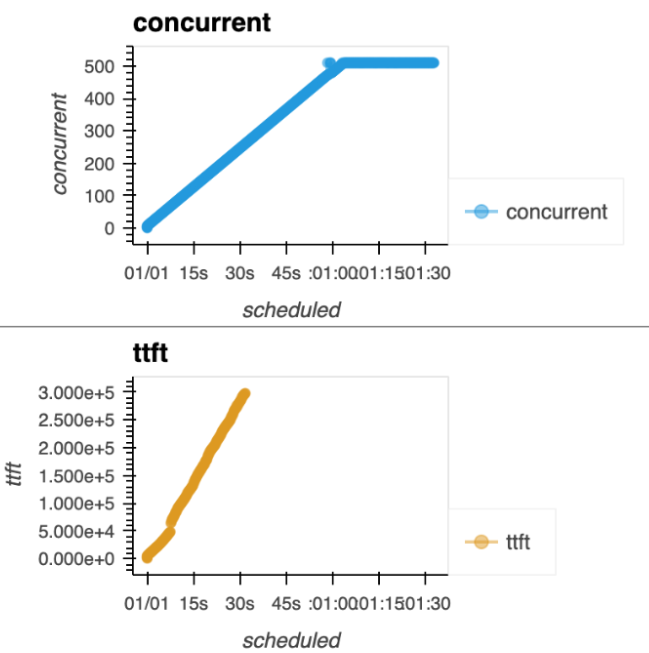
    Concurrent requests and TTFT plots over time. The concurrent requests are linearly increasing for the most part, and so does the TTFT.
    Figure 3: A bad (oversaturated) run. This is the so-called smoking gun we were looking for.

    The fix

    We added our final, primary rule. An alert is only raised when both TTFT and request concurrency show a consistently positive slope (which we measure using confidence intervals).

    Our final, "handcrafted" algorithm

    And that's it. Our best algorithm isn't a complex model; it's a set of three simple, hard-won rules:

    • Ignore the first 25% of requests to get past the "messy" start.
    • Wait 30 seconds and for a 2.5-second median TTFT to get past the "indistinguishable shoot-up."
    • Alert only if both TTFT and concurrency are climbing in a consistent, positive line.

    This simple, rules-based algorithm was the winner.

    Did it work?

    Yeah! A couple of months ago, we needed to run another suite of LLM performance benchmarks, and this time we were equipped with an oversaturation detector. It immediately stopped any oversaturated performance benchmarks, reducing the costs by more than a factor of 2, giving us the ability to run double the amount of tests with the same infrastructure.

    Conclusion

    And with that, we've wrapped up this three-part technical deep dive.

    In part 1, you learned how oversaturation can ruin your LLM benchmarking day. In part 2, we discussed how to build an evaluation metric (Soft-C-Index). In this final part 3, you saw how to use data-driven detective work to build an algorithm from scratch. We wanted to share our learning journey with you, and we appreciate you taking that journey with us.

    What's next?

    We're working on integrating this algorithm into the Red Hat AI ecosystem to make LLM benchmarking more efficient and cost-effective for our customers. Stay tuned!

    Related Posts

    • Defining success: Evaluation metrics and data augmentation for oversaturation detection

    • Reduce LLM benchmarking costs with oversaturation detection

    • How to run performance tests using benchmark-runner

    • Benchmarking with GuideLLM in air-gapped OpenShift clusters

    • Ollama vs. vLLM: A deep dive into performance benchmarking

    • GPU benchmarking and how to choose a GPU framework

    Recent Posts

    • External IP visibility in Red Hat Advanced Cluster Security

    • How I used Red Hat Lightspeed image builder to create CIS (and more) compliant images

    • Building a oversaturation detector with iterative error analysis

    • Introduction to distributed inference with llm-d

    • How to build your dynamic plug-ins for Developer Hub

    Red Hat Developers logo LinkedIn YouTube Twitter Facebook

    Platforms

    • Red Hat AI
    • Red Hat Enterprise Linux
    • Red Hat OpenShift
    • Red Hat Ansible Automation Platform
    • See all products

    Build

    • Developer Sandbox
    • Developer tools
    • Interactive tutorials
    • API catalog

    Quicklinks

    • Learning resources
    • E-books
    • Cheat sheets
    • Blog
    • Events
    • Newsletter

    Communicate

    • About us
    • Contact sales
    • Find a partner
    • Report a website issue
    • Site status dashboard
    • Report a security problem

    RED HAT DEVELOPER

    Build here. Go anywhere.

    We serve the builders. The problem solvers who create careers with code.

    Join us if you’re a developer, software engineer, web designer, front-end designer, UX designer, computer scientist, architect, tester, product manager, project manager or team lead.

    Sign me up

    Red Hat legal and privacy links

    • About Red Hat
    • Jobs
    • Events
    • Locations
    • Contact Red Hat
    • Red Hat Blog
    • Inclusion at Red Hat
    • Cool Stuff Store
    • Red Hat Summit
    © 2025 Red Hat

    Red Hat legal and privacy links

    • Privacy statement
    • Terms of use
    • All policies and guidelines
    • Digital accessibility

    Report a website issue