Kubernetes and Red Hat OpenShift clusters have become standard infrastructure in most organizations with applications running in their own pods or virtual machines (VMs). That’s why performance testing before deploying to a production environment is so important. Clusters run pods, but they can also run Windows or Linux VMs.
When running at a low scale at the beginning, everything works fine. But what happens when you scale up the number of pods or VMs and realize your cluster can’t handle it? To address this, the OpenShift Virtualization Performance and Scale team developed the benchmark-runner framework, which runs performance tests on any cluster and verifies whether it can scale effectively.
Recommended cluster sizing for performance
Benchmark-runner is a containerized open-source project that everyone can use to run performance tests on their own cluster with a simple single command. Benchmark-runner can execute various performance tests to evaluate your cluster’s scalability across multiple aspects, including hardware, network, storage, database and boot storm (rapid creation and boot of many VMs) scenarios for pods and VMs, and easily generate the results for you.
Benchmark-runner includes two run types: perf-ci and func-ci, each requiring a different cluster type.
Operators requirement: OpenShift Virtualization Operator (CNV)/ KubeVirt is required for both run types, while local storage operator (LSO) or OpenShift Data Foundation (ODF) storage are required for perf-ci, depending on the workload.
The cluster size required for func-ci run type is a small SNO cluster with 8 CPUs and 16 GB of RAM.
For perf-ci run type, the following cluster size is required:
3 Masters:
- CPU: 48
- Memory: 256GB
3 Workers:
- CPU: 48/96 (depends on the scale)
- Memory: 256/512GB (depends on the scale)
- Network: 10/25Gb (depends on the scale)
- Extra Storage:
- ODF: 3 disks per workers
- Type: SSD (NVMe recommended)
- Size 1000GB
- IOPS 20,000 (recommended)
- Throughput 750 (recommended)
The benchmark-runner workflow
Benchmark-runner can run workloads on any Kubernetes or OpenShift cluster. The benchmark-runner workflow includes stages for running workloads, collecting results into ElasticSearch, and displaying them in a dedicated Grafana dashboard (Figure 1).
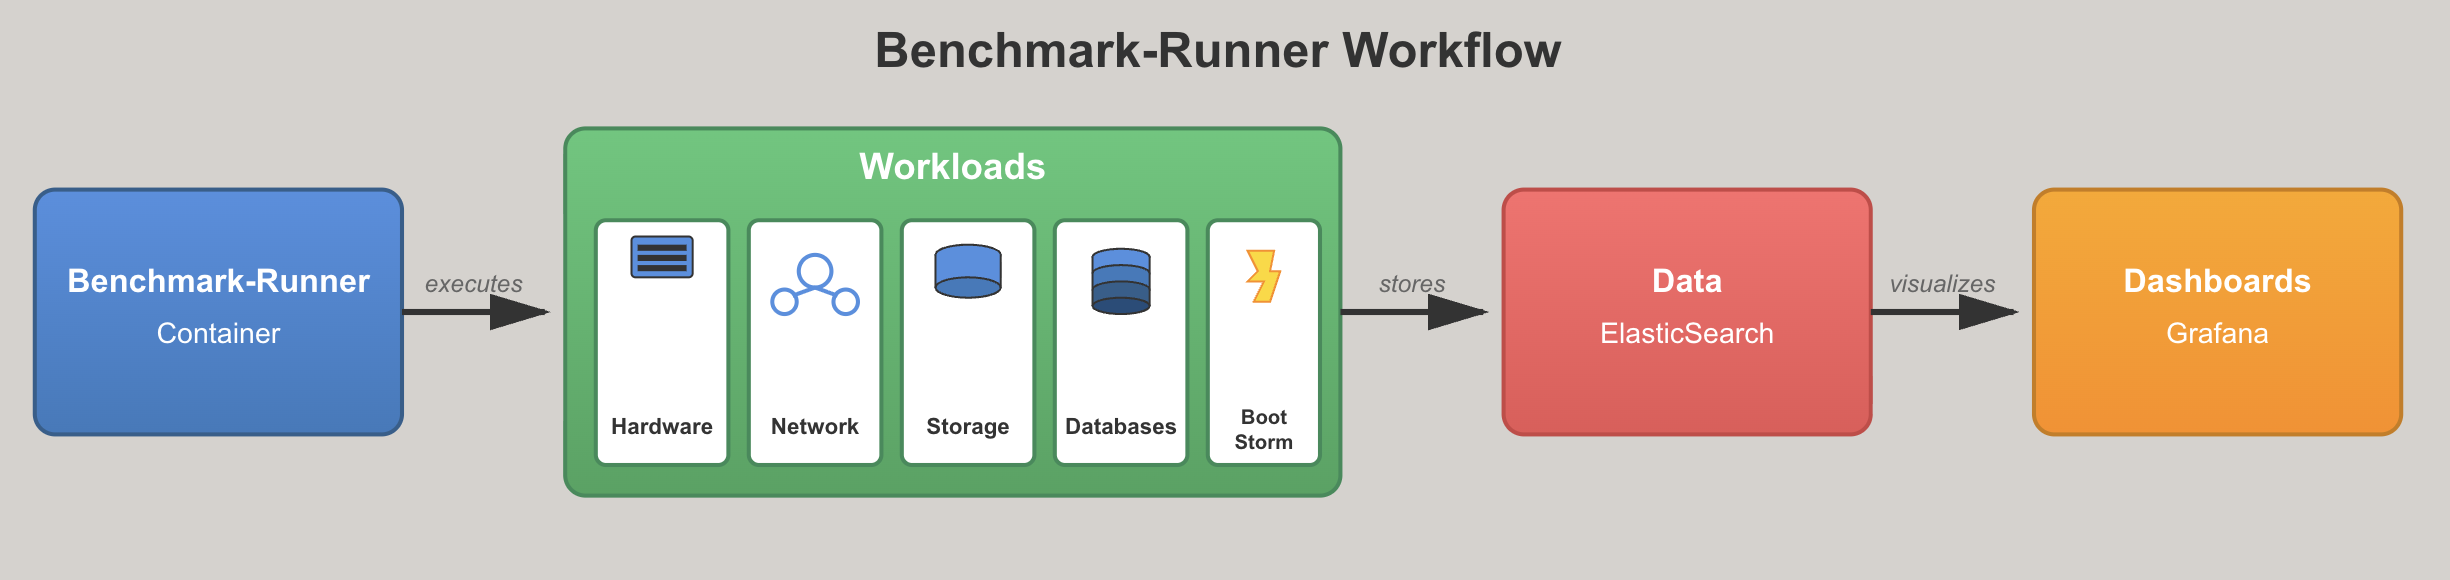
You can find the details on existing workloads and how to run them in the next section. In addition, you can get more details from the benchmark-runner documentation.
Benchmark-runner can collect run logs for pods and VMs and save them locally or externally in an S3 bucket in any cloud or a shared Google Drive. It also collects all metrics and stores them in ElasticSearch for future reference. In addition, you can visualize the ElasticSearch data in a dedicated Grafana dashboard.
Benchmark-runner supports the following workloads for the pod and VM:
- Stress-ng (Hardware CPU/ Memory)
- Uperf (Network)
- HammerDB (Database: MSSQL, Mariadb, PostgreSQL) - required LSO/ ODF operators
- Vdbench (Storage) - required LSO/ ODF operators
- Bootstorm (Scale Windows/ Linux VMs)
You can configure each workload by command line arguments and run in two run types: func-ci (functional oriented) and perf-ci (performance oriented).
Hardware workload
Stress-ng is a versatile Linux workload generator designed to stress test a system’s CPU, memory, I/O, and other subsystems. It supports hundreds of stressors that simulate various workloads, allowing you to push your hardware and software to their limits. In performance testing, stress-ng is often used to identify bottlenecks, validate stability under load, and evaluate how a cluster behaves in high-stress scenarios.
WORKLOAD="stressng_pod" OR WORKLOAD="stressng_vm"
RUN_TYPE="func_ci/perf_ci"( func_ci configuration or perf_ci configuration )
PIN_NODE1/PIN_NODE2  [Optional] for worker node selector
Save logs locally: (by default no logs locally)
SAVE_ARTIFACTS_LOCAL="True"
On local server run:
1. mkdir -p /tmp/benchmark-runner-run-artifacts
2. Add: -v /tmp/benchmark-runner-run-artifacts:/tmp/benchmark-runner-run-artifacts
Running as a pod or VM:
podman run -it --rm --name stressng_container -e WORKLOAD="stressng_pod" -e KUBEADMIN_PASSWORD="1234" -e RUN_TYPE="func_ci" -e SAVE_ARTIFACTS_LOCAL="True" -e log_level=INFO -v /tmp/benchmark-runner-run-artifacts:/tmp/benchmark-runner-run-artifacts -v /root/.kube/config:/root/.kube/config --privileged quay.io/benchmark-runner/benchmark-runner:latestMonitoring the running of stress-ng VM/pod:
$ oc get vmi -n benchmark-operator
NAME                            AGE   PHASE        IP    NODENAME   READY
stressng-vm-workload-842559be   22s   Running      10.128.1.64   server2
$ oc get pod -n benchmark-operator
The following snippet shows the logs (including yaml files and results) and the results in file stressng-vm-workload-f59f947c.
$ cd /tmp/benchmark-runner-run-artifacts/stressng-vm-2025-09-02-10-57-48
$ ls
benchmark-controller-manager-68b5448db-pz7ck
describe-benchmark-controller-manager
events.log
stressng-vm-workload-f59f947c
benchmark_runner.log
describe-stressng-vm-workload
namespace.yaml
stressng_vm.yamlThe following is the ElasticSearch index: (default names).
Default index name(func_ci run type): stressng-func-ci-results
Perf index name(perf_ci run type): stressng-results
Network workload
Uperf is a network performance benchmarking tool designed to measure throughput, latency, and other key metrics for various network protocols. It can simulate different traffic patterns, from simple node-to-node tests to complex multi-flow workloads, making it ideal for evaluating cluster networking performance under realistic conditions.
WORKLOAD="uperf_pod" OR WORKLOAD="uperf_vm"
RUN_TYPE="func_ci/perf_ci"( func_ci configuration or perf_ci configuration )
PIN_NODE1/PIN_NODE2:  [Mandatory] for client server pod/vm, should configure different worker nodes for reliable results
Save logs locally: (by default no logs locally)
SAVE_ARTIFACTS_LOCAL="True"
On local server run:
1. mkdir -p /tmp/benchmark-runner-run-artifacts
2. Add: -v /tmp/benchmark-runner-run-artifacts:/tmp/benchmark-runner-run-artifacts
Running as a pod or VM:
podman run -it --rm --name uperf_container -e WORKLOAD="uperf_vm" -e KUBEADMIN_PASSWORD="1234" -e PIN_NODE_BENCHMARK_OPERATOR="worker-0" -e PIN_NODE1="worker-1" -e PIN_NODE2="worker-2" -e RUN_TYPE="test_ci" -e log_level=INFO -e SAVE_ARTIFACTS_LOCAL="True" -v /tmp/benchmark-runner-run-artifacts:/tmp/benchmark-runner-run-artifacts -v /root/.kube/config:/root/.kube/config --privileged quay.io/benchmark-runner/benchmark-runner:latestMonitoring the uperf client/server VM/pod:
$ oc get vmi -n benchmark-operator
NAME                                 AGE   PHASE     IP             NODENAME                  READY
uperf-client-10-128-1-132-42e959a4   18s   Running   10.128.1.134   server1   True
uperf-server-0-42e959a4              70s   Running   10.128.1.132   server2   True
$ oc get pod -n benchmark-operator
The following shows the logs (including yaml files and results) and results in file uperf-client-10-128-1-138-36475c41:
$ cd /tmp/benchmark-runner-run-artifacts/uperf-vm-2025-09-02-12-55-42
$ ls
describe-uperf-client
namespace.yaml
uperf_vm.yaml
benchmark_runner.log
describe-uperf-server
uperf-client-10-128-1-138-36475c41
describe-benchmark-controller-manager
events.log
uperf-server-0-36475c41The following is the ElasticSearch index name: (default names).
Default index name(func_ci run type): uperf-func-ci-results
Perf index name(perf_ci run type): uperf-results
Database workload
HammerDB is an open-source database benchmarking tool that supports popular databases such as Microsoft SQL Server, MySQL, and PostgreSQL. It can simulate transactions per minute (TPM) workloads, making it ideal for testing database performance, scalability, and reliability under realistic application scenarios.
You can run three databases on the pod and VM: MariaDB, PostgreSQL, MSSQL using the local storage operator (LSO) or OpenShift Data Foundation (ODF) storage.
WORKLOAD="hammerdb_pod_mariadb" OR WORKLOAD="hammerdb_vm_mariadb" (ODF)
WORKLOAD="hammerdb_pod_postgres" OR WORKLOAD="hammerdb_vm_postgres" (ODF)
WORKLOAD="hammerdb_pod_mssql" OR WORKLOAD="hammerdb_vm_mssql" (ODF)
WORKLOAD="hammerdb_pod_XXX_lso" OR WORKLOAD="hammerdb_vm_XXX_lso" (LSO)
For LSO required 2 environment variables:
LSO_DISK_ID="wwn-0xxxxxxx"
LSO_NODE="worker-1"
RUN_TYPE="func_ci/perf_ci"( func_ci configuration or perf_ci configuration )
PIN_NODE1/PIN_NODE2: [Mandatory] for client server pod database

Save logs locally: (by default no logs locally)
SAVE_ARTIFACTS_LOCAL="True"
On local server run:
1. mkdir -p /tmp/benchmark-runner-run-artifacts
2. Add: -v /tmp/benchmark-runner-run-artifacts:/tmp/benchmark-runner-run-artifacts
Running as a pod or VM:
podman run -it --rm --name hammerdb_container -e WORKLOAD="hammerdb_vm_mariadb" -e KUBEADMIN_PASSWORD="1234" -e RUN_TYPE="test_ci" -e SAVE_ARTIFACTS_LOCAL="True" -e log_level=INFO -v /tmp/benchmark-runner-run-artifacts:/tmp/benchmark-runner-run-artifacts -v /root/.kube/config:/root/.kube/config --privileged quay.io/benchmark-runner/benchmark-runner:latestMonitoring the hammerdb workload VM/pod:
$ oc get vmi -n benchmark-operator (including database)
NAME                            AGE   PHASE     IP             NODENAME   READY
hammerdb-vm-workload-8e114132   36s   Running   10.128.3.146   worker-2   True
$ oc get pod -n benchmark-operator
# Pod Databases:
$ oc get pod -n mariadb-db
$ oc get pod -n postgres-db
$ oc get pod -n mssql-db
The following shows the logs (including yaml files and results) and results in file hammerdb-vm-workload-8e114132:
# cd /tmp/benchmark-runner-run-artifacts/hammerdb-vm-mariadb-2025-09-07-14-37-28
# ls
Benchmark-controller-manager-68b5448db-v4f75
describe-benchmark-controller-manager
events.log
hammerdb_vm_mariadb.yaml
Benchmark_runner.log
Describe-hammerdb-vm-workload
hammerdb-vm-workload-8e114132
namespace.yamlThe ElasticSearch index: (default names) follows:
Default index name(func_ci run type): hammerdb-func-ci-results
Perf index name(perf_ci run type): hammerdb-results
Storage workload
Vdbench is a command-line storage benchmarking tool that generates configurable I/O workloads to test and validate storage system performance. It supports various workload profiles (e.g., sequential, random, and mixed reads/writes), making it ideal for measuring throughput, latency, and stability under heavy disk activity. There is an option to run Vdbench pods/VMs at scale. The benchmark-runner will automatically synchronize them to start at the exact same time to ensure reliable results.
It supports these database application types, especially in testing ODF storage: OLTP1, OLTP2, OLTP-HW, ODSS2, and ODSS128. Learn more in this blog.
WORKLOAD="vdbench_vm" OR WORKLOAD="vdbench_vm"
SCALE="3" Number of Vdbench VMs or Pods per node that will run in parallel (remove it when need 1 Pod/VM)
SCALE_NODES="[ 'worker-0', 'worker-1', 'worker-2' ]"(List of scale nodes)
REDIS="redis-deployment.benchmark-runner.svc.cluster.local" (Only for Scale - redis for synchronization between the VMs/Pods)
THREADS_LIMIT="10" (# Physical CPU on bastion server, default 20)
RUN_TYPE="func_ci/perf_ci"( func_ci configuration or perf_ci configuration )
Save logs locally: (by default no logs locally)
SAVE_ARTIFACTS_LOCAL="True"
On local server run:
1. mkdir -p /tmp/benchmark-runner-run-artifacts
2. Add: -v /tmp/benchmark-runner-run-artifacts:/tmp/benchmark-runner-run-artifacts
Important: -it required to read VMI output
Running as a pod or VM:
podman run --rm -it -e WORKLOAD="vdbench_vm" -e KUBEADMIN_PASSWORD="1234" -e RUN_TYPE="test_ci" -e SCALE="3" -e SCALE_NODES="[ 'worker-0', 'worker-1', 'worker-2' ]" -e REDIS="redis-deployment.benchmark-runner.svc.cluster.local" -e THREADS_LIMIT="10" -e SAVE_ARTIFACTS_LOCAL="True" -e log_level=INFO -v /tmp/benchmark-runner-run-artifacts:/tmp/benchmark-runner-run-artifacts -v /root/.kube/config:/root/.kube/config --privileged quay.io/benchmark-runner/benchmark-runner:latestRemove the SCALE parameter when you need only 1 pod/VM.
Monitoring scale Vdbench VM/pod:
# oc get vmi -n benchmark-runner
NAME                    AGE    PHASE     IP             NODENAME   READY
vdbench-vm-49d6054c-0   100s   Running   10.131.1.152   worker-0   True
vdbench-vm-49d6054c-1   100s   Running   10.131.1.150   worker-0   True
vdbench-vm-49d6054c-2   100s   Running   10.131.1.151   worker-0   True
vdbench-vm-49d6054c-3   100s   Running   10.129.2.91    worker-1   True
vdbench-vm-49d6054c-4   100s   Running   10.129.2.89    worker-1   True
vdbench-vm-49d6054c-5   100s   Running   10.129.2.90    worker-1   True
vdbench-vm-49d6054c-6   100s   Running   10.128.2.100   worker-2   True
vdbench-vm-49d6054c-7   100s   Running   10.128.2.101   worker-2   True
vdbench-vm-49d6054c-8   100s   Running   10.128.2.99    worker-2   True
The logs (including yaml files) and results in vdbench-results in vdbench-vm-78cf0484-0.csv as follows:
# cd /tmp/benchmark-runner-run-artifacts/vdbench-vm-2025-09-08-09-10-49
# ls
Benchmark_runner.log
vdbench_vm_0.yaml
vdbench_vm_1.yaml
vdbench_vm_2.yaml
vdbench_vm_3.yaml
vdbench_vm_4.yaml
vdbench_vm_6.yaml
vdbench_vm_5.yaml
vdbench_vm_7.yaml
Vdbench_vm_8.yaml
vdbench-vm-78cf0484-0
Vdbench-vm-78cf0484-0.csv
vdbench-vm-78cf0484-1
Vdbench-vm-78cf0484-1.csv
vdbench-vm-78cf0484-2
Vdbench-vm-78cf0484-2.csv
vdbench-vm-78cf0484-3
Vdbench-vm-78cf0484-3.csv
vdbench-vm-78cf0484-4
Vdbench-vm-78cf0484-4.csv
vdbench-vm-78cf0484-5
Vdbench-vm-78cf0484-5.csv
vdbench-vm-78cf0484-6
Vdbench-vm-78cf0484-6.csv
vdbench-vm-78cf0484-7
Vdbench-vm-78cf0484-7.csv
vdbench-vm-78cf0484-8
vdbench-vm-78cf0484-8.csv
Namespace.yaml
state_signals_exporter_pod.yaml The following shows the ElasticSearch index: (default names).
Default index name(func_ci run type): vdbech-func-ci-results
Perf index name(perf_ci run type): vdbech-results
BootStorm workload
BootStorm is a performance test designed to stress a virtualized environment by simultaneously booting a large number of virtual machines. It measures the cluster’s ability to handle rapid provisioning and startup operations, helping identify bottlenecks in compute, storage, and networking during peak load events.
It can run Linux/Windows VMs in parallel across the worker nodes and verify that each VM is accessible via SSH using the VirtCtl protocol, which indicates that the VM has reached the login prompt. In addition, it measures the time taken for each VM to become SSH-accessible.
WORKLOAD="bootstorm_vm" OR WORKLOAD="windows_vm"
SCALE="3" Number of VMs per node that will run in parallel
SCALE_NODES="[ 'worker-0', 'worker-1', 'worker-2' ]"(List of scale nodes)
FEDORA_CONTAINER_DISK="quay.io/ebattat/fedora37-container-disk:latest" (By default quay.io/ebattat/fedora37-container-disk:latest )
WINDOWS_URL="http://127.0.0.1:8083/windows11.qcow2" (Local qcow2 Windows image is shared via NGINX. verify that the Windows image uses VirtIO drivers)
DELETE_ALL="True/ False" (By default, this is set to True, meaning all VMs will be deleted. If you want to keep them running after the run, change it to False)
RUN_STRATEGY="True/ False" (By default ‘False’, set it to ‘True’ for VMs that need to start in a running state)
CREATE_VMS_ONLY="True/ False" (By default ‘False’, creating VMs only w/o verification for fast deploying, default False when True: configure RUN_STRATEGY: True/ DELETE_ALL: False)
VERIFICATION_ONLY="True/ False" VM sshable verification using VirtCtl protocol (By default ‘False’, verification only, w/o running or deleting any resources)
TIMEOUT="3600" (timeout in seconds)
THREADS_LIMIT="10" (# Physical CPU on bastion server, default 20)
RUN_TYPE="func_ci/perf_ci"( func_ci configuration or perf_ci configuration )
LOCAL_LOGS_PATH="/tmp/benchmark-runner-run-artifacts" (local log path for debugging purpose)
MUST_GATHER_LOG="True/False" (By default ‘False’, set it to ‘True for collection OCP and ODF/CNV operators must gather logs)
TEST_NAME="windows-vms-verification" (Optional)
Save logs locally: (by default no logs locally)
SAVE_ARTIFACTS_LOCAL="True"
On local server run:
1. mkdir -p /tmp/benchmark-runner-run-artifacts
2. Add:-v /tmp/benchmark-runner-run-artifacts:/tmp/benchmark-runner-run-artifacts
Important: -it required to read VMI output
BootStorm workload: Fedora VM deployment
The following example shows how to run multiple Fedora VMs in parallel across the worker nodes and calculate the BootStorm time for each Fedora VM.
For fast deployment without VM loading verification, add: -e CREATE_VMS_ONLY="True" -e RUN_STRATEGY="True".
To keep the VM running: -e DELETE_ALL="False".
podman run -it --rm -e WORKLOAD="bootstorm_vm" -e KUBEADMIN_PASSWORD="1234" -e RUN_TYPE="test_ci" -e SCALE="3" -e SCALE_NODES="[ 'worker-0', 'worker-1', 'worker-2' ]" -e RUN_STRATEGY="True" -e THREADS_LIMIT='20' -e TIMEOUT='3600' -e SAVE_ARTIFACTS_LOCAL="True" -e log_level=INFO -v /tmp/benchmark-runner-run-artifacts:/tmp/benchmark-runner-run-artifacts -v /root/.kube/config:/root/.kube/config --privileged quay.io/benchmark-runner/benchmark-runner:latest
Monitoring the BootStorm VM:
# oc get vmi -n benchmark-runner
NAME                      AGE   PHASE     IP             NODENAME   READY
bootstorm-vm-92ca4834-0   37s   Running   10.129.3.220   worker-1   True
bootstorm-vm-92ca4834-1   37s   Running   10.129.3.221   worker-1   True
bootstorm-vm-92ca4834-2   37s   Running   10.128.3.135   worker-2   True
bootstorm-vm-92ca4834-3   37s   Running   10.129.3.219   worker-1   True
bootstorm-vm-92ca4834-4   37s   Running   10.129.3.222   worker-1   True
bootstorm-vm-92ca4834-5   37s   Running   10.129.3.218   worker-1   True
bootstorm-vm-92ca4834-6   37s   Running   10.128.3.136   worker-2   True
bootstorm-vm-92ca4834-7   37s   Running   10.129.3.217   worker-1   True
bootstorm-vm-92ca4834-8   37s   Running   10.128.3.134   worker-2   True
The following shows the logs (including yaml files).
# cd /tmp/benchmark-runner-run-artifacts/bootstorm-vm-2025-09-10-07-35-30
# ls
Benchmark_runner.log
bootstorm_vm_0.yaml
bootstorm_vm_1.yaml
bootstorm_vm_2.yaml
bootstorm_vm_3.yaml
bootstorm_vm_4.yaml
bootstorm_vm_6.yaml
bootstorm_vm_5.yaml
bootstorm_vm_7.yaml
bootstorm_vm_8.yaml
Namespace.yamlThis is the ElasticSearch index: (default names).
Default index name(func_ci run type): bootstorm-func-ci-results
Perf index name(perf_ci run type): bootstorm-results
BootStorm workload: Windows VM deployment
The following example shows how to run multiple Windows VMs in parallel across the worker nodes and calculate the BootStorm time for each Windows VM.
For fast deployment, add: -e CREATE_VMS_ONLY="True" -e RUN_STRATEGY="True".
To keep the VM running: -e DELETE_ALL="False".
podman run -it --rm -e WORKLOAD="windows_vm" -e KUBEADMIN_PASSWORD="1234" -e RUN_TYPE="test_ci" -e SCALE="3" -e SCALE_NODES="[ 'worker-0', 'worker-1', 'worker-2' ]" -e WINDOWS_URL="http://localhost:8083/windows11.qcow2" -e RUN_STRATEGY="True" -e DELETE_ALL="False" -e THREADS_LIMIT='20' -e TIMEOUT='3600' -e SAVE_ARTIFACTS_LOCAL="True" -e log_level=INFO -v /tmp/benchmark-runner-run-artifacts:/tmp/benchmark-runner-run-artifacts -v /root/.kube/config:/root/.kube/config --privileged quay.io/benchmark-runner/benchmark-runner:latestRegarding the WINDOWS_URL: The Windows container disk image can use a VirtIO-based disk instead of SATA for better performance. You can store the qcow2 image locally and share it via NGINX, since it is too large to store on quay.io or other container registries.
Monitoring the Windows VM:
# oc get vmi -n benchmark-runner
NAME                      AGE   PHASE     IP             NODENAME   READY
windows-vm-e3f06e2b-0   49s   Running   10.128.3.151   worker-2   True
windows-vm-e3f06e2b-1   49s   Running   10.129.2.116   worker-1   True
windows-vm-e3f06e2b-2   49s   Running   10.129.2.112   worker-1   True
windows-vm-e3f06e2b-3   49s   Running   10.129.2.115   worker-1   True
windows-vm-e3f06e2b-4   49s   Running   10.129.2.114   worker-1   True
windows-vm-e3f06e2b-5   49s   Running   10.128.3.150   worker-2   True
windows-vm-e3f06e2b-6   49s   Running   10.129.2.111   worker-1   True
windows-vm-e3f06e2b-7   49s   Running   10.129.2.113   worker-1   True
windows-vm-e3f06e2b-8   49s   Running   10.128.3.152   worker-2   True
The following shows the logs (including yaml files):
# cd /tmp/benchmark-runner-run-artifacts/bootstorm-vm-2025-09-10-07-35-30
# ls
Benchmark_runner.log
windows_vm_0.yaml
windows_vm_1.yaml
windows_vm_2.yaml
windows_vm_3.yaml
windows_vm_4.yaml
windows_vm_6.yaml
windows_vm_5.yaml
windows_vm_7.yaml
windows_vm_8.yaml
Namespace.yamlThis is the ElasticSearch index: (default names).
Default index name(func_ci run type): bootstorm-func-ci-results
Perf index name(perf_ci run type): bootstorm-results
BootStorm workload: Fedora VM verification
The following example shows how to verify multiple Fedora VMs in parallel across the worker nodes. You can use it to confirm that all VMs are running and remain accessible over time.
Prerequisites:
You need to have Fedora VMs running before starting the verification. Run the Fedora VMs deployment without deleting the existing VMs, and make sure the scale number matches the one used in the following verification step.
To run the Fedora VM verification using the VirtCtl protocol: add -e DELETE_ALL='False' -e VERIFICATION_ONLY='True' for VM verification and to keep the VM running.
podman run -it --rm -e WORKLOAD="bootstorm_vm" -e KUBEADMIN_PASSWORD="1234" -e SCALE="3" -e SCALE_NODES="[ 'worker-0', 'worker-1', 'worker-2' ]" -e DELETE_ALL='False' -e VERIFICATION_ONLY='True' -e THREADS_LIMIT='20' -e TIMEOUT='3600' -e SAVE_ARTIFACTS_LOCAL="True" -e log_level=INFO -v /tmp/benchmark-runner-run-artifacts:/tmp/benchmark-runner-run-artifacts -v /root/.kube/config:/root/.kube/config --privileged quay.io/benchmark-runner/benchmark-runner:latestBootStorm workload: Windows VM verification
The following example shows how to verify multiple Windows VMs in parallel across the worker nodes. You can use it to confirm that all VMs are running and remain accessible over time.
Prerequisites:
You need to have Windows VMs running before starting the verification. Run the Windows VMs deployment without deleting the existing VMs, and make sure the scale number matches the one used in the following verification step.
To run the Windows VM verification using the VirtCtl ssh protocol, add this for vm verification and to keep the VM running:
-e DELETE_ALL='False' -e VERIFICATION_ONLY='True'.
podman run -it --rm -e WORKLOAD="bootstorm_vm" -e KUBEADMIN_PASSWORD="1234" -e SCALE="3" -e SCALE_NODES="[ 'worker-0', 'worker-1', 'worker-2' ]" -e WINDOWS_URL="http://localhost_ip:8083/windows11.qcow2" -e DELETE_ALL='False' -e VERIFICATION_ONLY='True' -e THREADS_LIMIT='20' -e TIMEOUT='3600' -e SAVE_ARTIFACTS_LOCAL="True" -e log_level=INFO -v /tmp/benchmark-runner-run-artifacts:/tmp/benchmark-runner-run-artifacts -v /root/.kube/config:/root/.kube/config --privileged quay.io/benchmark-runner/benchmark-runner:latestRegarding the WINDOWS_URL, the Windows container disk image can use a VirtIO-based disk instead of SATA for better performance. You can store the qcow2 image locally and share it via NGINX, since it is too large to store on quay.io or other container registries.
Collecting benchmark-runner logs
There are three ways to collect the benchmark logs for each workload: locally, in an S3 bucket on any cloud, or in a shared Google Drive. Each workload’s logs include all relevant workload YAML logs and the benchmark-runner logs.
Local logs
By default, the logs are not saved locally, so they won’t fill up your local disk. If you need to save them for future use, add an environment variable and mount the log path.
Enable local logs by adding an environment variable: -e SAVE_ARTIFACTS_LOCAL="True"
- On local:
mkdir -p /tmp/benchmark-runner-run-artifacts - Mount your local disk to the benchmark-runner running container: -
v /tmp/benchmark-runner-run-artifacts:/tmp/benchmark-runner-run-artifacts
S3 bucket
To upload benchmark-runner logs to an S3 bucket, fill in the following variable, which provides the S3 bucket details for your cloud provider. Once you've configured the S3 bucket variables, the workload results will upload to the S3 bucket.
REGION_NAME='region'
ENDPOINT_URL='endpoint_url'
ACCESS_KEY_ID='access_key'
SECRET_ACCESS_KEY='secret_key'
BUCKET='bucket_name'
KEY='bucket_key'
This following is an example run using the s3 bucket:
podman run -it --rm -e WORKLOAD="bootstorm_vm" -e KUBEADMIN_PASSWORD="1234" -e SCALE="100" -e SCALE_NODES="["worker-0", "worker-1", "worker-2"]"
-e REGION_NAME='${REGION_NAME}' \
-e ENDPOINT_URL='${ENDPOINT_URL}' \
-e ACCESS_KEY_ID='${ACCESS_KEY_ID}' \
-e SECRET_ACCESS_KEY='${SECRET_ACCESS_KEY}' \
-e BUCKET='${BUCKET}' \
-e KEY='${IBM_KEY}' \
-e THREADS_LIMIT='20' -e TIMEOUT='3600' -e SAVE_ARTIFACTS_LOCAL="True" -e log_level=INFO -v /tmp/benchmark-runner-run-artifacts:/tmp/benchmark-runner-run-artifacts -v /root/.kube/config:/root/.kube/config --privileged quay.io/benchmark-runner/benchmark-runner:latest
Google Drive
To upload benchmark-runner logs to Google Drive, fill in the following variable with the shared Google Drive details. Once you've configured the Google Drive variables, the workload results will upload to Google Drive.
Mandatory variables:
GOOGLE_DRIVE_PATH='https://drive.google.com/drive/folders'
GOOGLE_DRIVE_CREDENTIALS_FILE=google_credentials_file
GOOGLE_DRIVE_TOKEN_FILE=google_token_file
GOOGLE_DRIVE_SHARED_DRIVE_ID=google_folder_id
This following is an example run using a Google shared drive:
podman run -it --rm -e WORKLOAD="bootstorm_vm" -e KUBEADMIN_PASSWORD="1234" -e SCALE="100" -e SCALE_NODES="["worker-0", "worker-1", "worker-2"]"
-e GOOGLE_DRIVE_PATH='${GOOGLE_DRIVE_PATH}' \
-e GOOGLE_DRIVE_CREDENTIALS_FILE='${DESTINATION_PATH}/${GOOGLE_CREDENTIALS_FILE}' \
-e GOOGLE_DRIVE_TOKEN_FILE='${DESTINATION_PATH}/${GOOGLE_TOKEN_FILE}' \
-e GOOGLE_DRIVE_SHARED_DRIVE_ID='${GOOGLE_DRIVE_SHARED_DRIVE_ID}' \
-e THREADS_LIMIT='20' -e TIMEOUT='3600' -e SAVE_ARTIFACTS_LOCAL="True"
-e log_level=INFO -v /tmp/benchmark-runner-run-artifacts:/tmp/benchmark-runner-run-artifacts -v /root/.kube/config:/root/.kube/config --privileged quay.io/benchmark-runner/benchmark-runner:latest
ElasticSearch
To upload benchmark-runner workload metrics to ElasticSearch, fill in the following variable with your ElasticSearch details. Once you've configured the ElasticSearch variables, the workload metrics will upload automatically. There is no need to specify an index name because each workload uses a default index.
ELASTICSEARCH=DNS Server name
ELASTICSEARCH_PORT=9200
ELASTICSEARCH_USER=(optional)
ELASTICSEARCH_PASSWORD=(optional)
This following is an example run using ElasticSearch:
podman run -it --rm -e WORKLOAD="bootstorm_vm" -e KUBEADMIN_PASSWORD="1234" -e SCALE="100" -e SCALE_NODES="["worker-0", "worker-1", "worker-2"]"
-e ELASTICSEARCH='${ELASTICSEARCH}' -e ELASTICSEARCH_PORT='${ELASTICSEARCH_PORT}' -e SAVE_ARTIFACTS_LOCAL="True" -e log_level=INFO -v /tmp/benchmark-runner-run-artifacts:/tmp/benchmark-runner-run-artifacts
-v /root/.kube/config:/root/.kube/config --privileged quay.io/benchmark-runner/benchmark-runner:latest
The results will automatically update in the dedicated ElasticSearch index as follows. There is no need to pass the index through an environment variable, it will generate automatically according to the following index name convention:
- RUN_TYPE = perf_ci, elastic index name: {workload}-results (e.g., uperf-result, vdbench-results, hammerdb-results, bootstorm-results)
- RUN_TYPE =func_ci (default) , elastic index name: {workload}-func-ci-results (e.g., uperf-func-ci-result, vdbench-func-ci-results, hammerdb-func-ci-results, bootstorm-func-ci-results)
Deploying your ElasticSearch/Kibana/Grafana
You can use the benchmark-runner pod-Ci to deploy your ElasticSearch/Kibana/Grafana.
sudo podman pod create --name ci_pod  -p 9200:9200 -p 5601:5601 -p 3000:3000 -p 8083:80 -p 8800:8888 -p 80:4004
# Elastic/ Kibana/ Grafana - 9200 / 5601 / 3000
sudo podman run --name elasticsearch --pod ci_pod -d -e "discovery.type=single-node" -e "xpack.security.enabled=false" -v "$CI_PATH"/elastic:/usr/share/elasticsearch/data --privileged docker.elastic.co/elasticsearch/elasticsearch:7.16.0
sudo podman run --name kibana --pod ci_pod -d -e "ELASTICSEARCH_HOSTS=http://localhost:9200" --privileged docker.elastic.co/kibana/kibana:7.16.0
sudo podman run --name grafana --pod ci_pod -d -v "$CI_PATH"/grafana/grafana.ini:/etc/grafana/grafana.ini  -v "$CI_PATH"/grafana:/var/lib/grafana  --privileged quay.io/mimehta/custom-grafana:latest
For more details you can use part of ci_pod deployment for it.
Fetching Prometheus metrics
Benchmark-runner can collect Prometheus logs during the run. You can find the virt list queries fetched each run here. To get the Prometheus logs, you just need to add the environment variables to the run.
Add an environment variable: -e ENABLE_PROMETHEUS_SNAPSHOT='True'.
The whole Prometheus logs per run will grab into tar file, so you can query it later according to your needs. For more details, refer to the doc, how to inspect prometheus snapshot.
podman run -it --rm -e WORKLOAD="bootstorm_vm" -e KUBEADMIN_PASSWORD="1234" -e SCALE="100" -e SCALE_NODES="["worker-0", "worker-1", "worker-2"]"
-e ENABLE_PROMETHEUS_SNAPSHOT="True" -e SAVE_ARTIFACTS_LOCAL="True" -e log_level=INFO -v /tmp/benchmark-runner-run-artifacts:/tmp/benchmark-runner-run-artifacts
-v /root/.kube/config:/root/.kube/config --privileged quay.io/benchmark-runner/benchmark-runner:latest
Displaying results in the Grafana dashboard
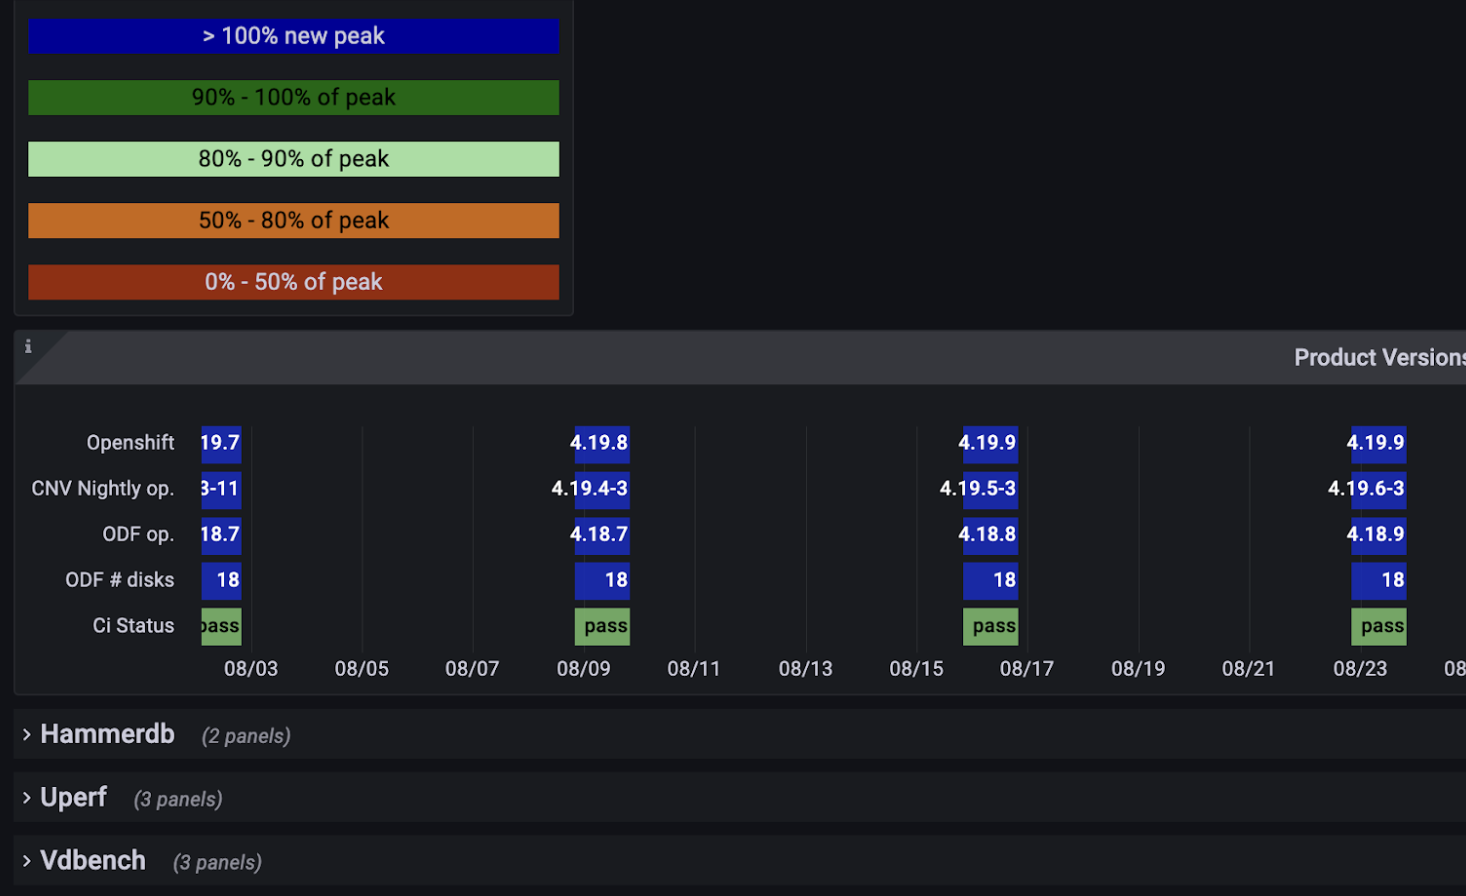
You can create your own Grafana dashboard to display the ElasticSearch workload metric results.
To do this, follow these steps:
- Add data source for ElasticSearch in Grafana data source option.
- Add Grafana metadata. It can be a hard-coded JSON file or jsonnet code that generates automatically using terraform.
- JSON file - import JSON file
- Grafonnet code - deploy code by terraform (see Makefile)
- Open you Grafana dashboard PerfCI-Regression-Summary (Figure 2).
Summary report using JupyterLab Notebook
Once your regression is running, it will upload many rows into ElasticSearch, making it difficult to track the results across cluster versions, especially if you have multiple runs per cluster version over time.
To address this, we created a summary report template that aggregates each workload’s results per version and uses a geometric-mean algorithm to summarize the results, allowing you to easily compare workload performance across cluster versions. It aggregates the results per workload and shows the percentage difference, so you can easily see whether workload results improved between cluster versions (Figure 3).
You must configure the following variable in the prerequisites step before running this Jupyter notebook template:
# ElasticSearch data
es_host = ElasticSearch host
es_port = ElasticSearch port
es_user = ElasticSearch user
es_password = ElasticSearch password
# Grafana data
os.environ['grafana_url'] = Grafana URL just for displaying in the report
os.environ['network_speed'] = Network speed just for displaying in the report
## fetching the number of days from ElasticSearch, default '365' days
os.environ['fetch_ocp_versions_days'] = '365'
## filter data by vm, for comparing vm workloads
os.environ['filter_kind'] = 'vm'
# S3 bucket data
service_name = s3
region_name = region_name
endpoint_url= endpoint_url per cloud provider
aws_access_key_id = access_key_id
aws_secret_access_key = secret_access_key
bucket = bucket name
key = key name (folder name inside bucket)
#Google drive
google_drive_path = google_drive_path
google_drive_token_file = google_drive_token_file (need to generate in gcp credentials)
google_drive_credentials_file = google_drive_credentials_file (need to generate in gcp credentials)
google_drive_shared_drive_id = google_drive_shared_drive_id, where to upload the logs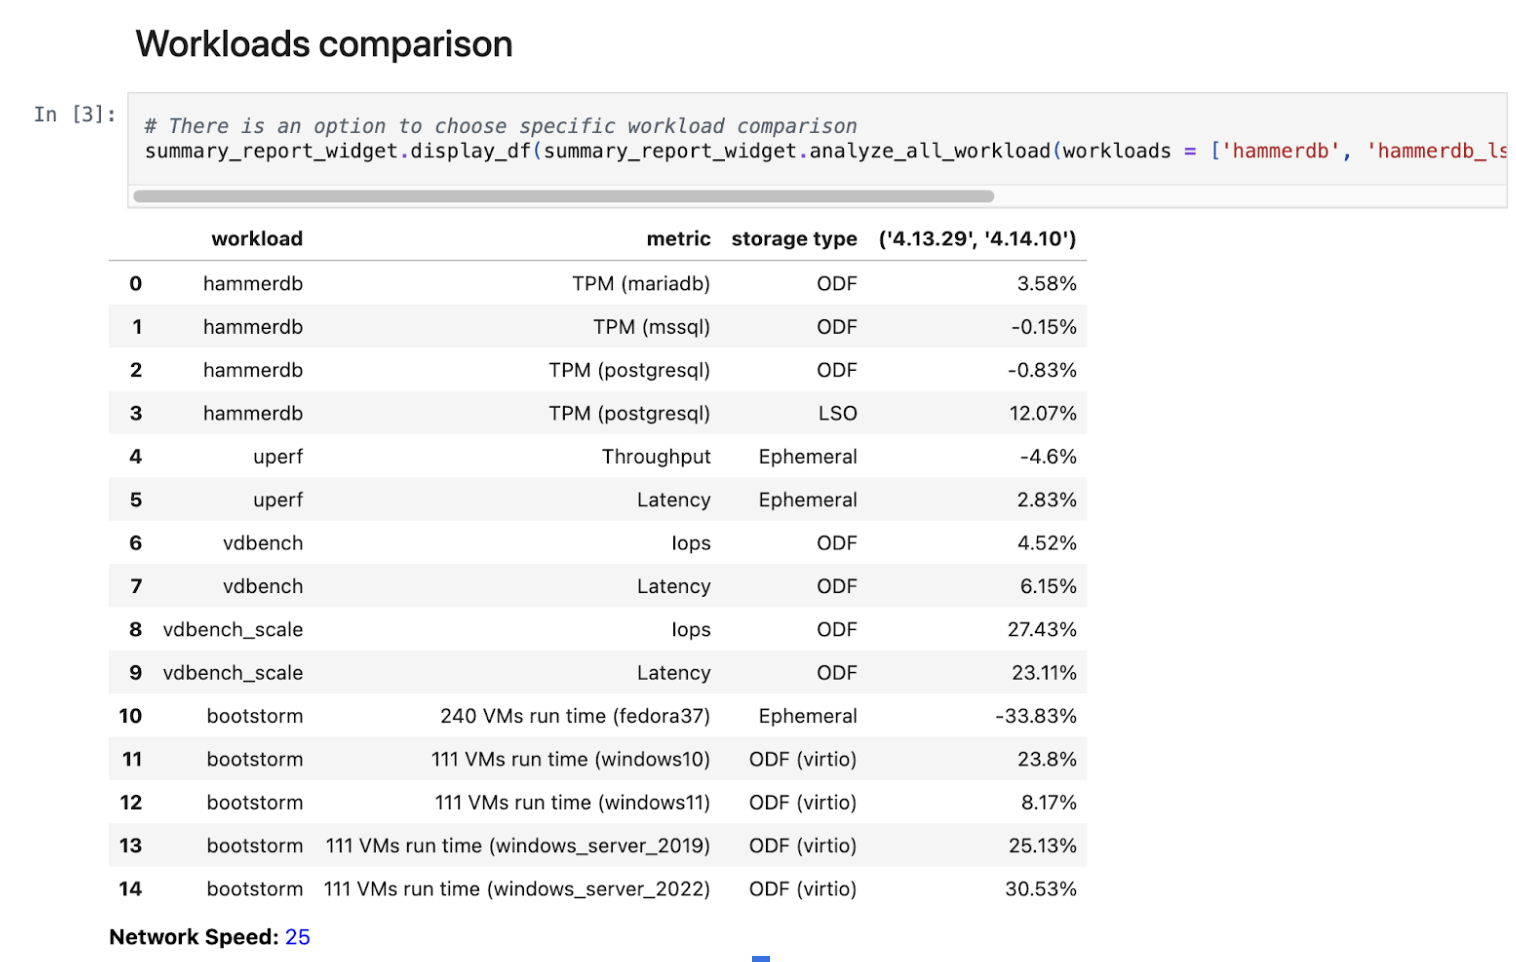
You can read more on jupyterlab notebooks.
Summary
This article demonstrated how you can easily use the benchmark-runner framework to run benchmarks for various workloads across cluster functionalities, including compute, network, storage, and databases, for pods and VMs. Benchmark-runner supports two running modes: functional and performance. It automatically collects and stores metrics in ElasticSearch. Additionally, you can create custom dashboards to visualize and compare results across different cluster versions, making it easier to identify performance trends and improvements over time. This makes benchmark-runner particularly useful for cluster administrators, SREs, and performance engineers who want a clear and consistent view of workload behavior and cluster performance.