While Red Hat OpenShift Virtualization is nothing new, there is still a lot to talk about to get the most out of the platform. Once you start using OpenShift Virtualization for your virtual machine (VM) workloads you really start to see the power that this technology brings to your enterprise. Utilizing Red Hat’s ultra-reliable, fully tried and tested KVM/libvirt engine helps ensure stability and a production-ready environment. Running it on Red Hat OpenShift’s flexible Kubernetes-based application platform gives you the ability to manage virtual machines the same way as your container-based applications.
But to truly enhance control of your VM and container workloads, turn to Red Hat Advanced Cluster Management for Kubernetes (RHACM). RHACM 2.12 is leveraging the included Cluster Monitoring Operator (CMO), a powerful open source monitoring solution for both workloads and clusters, to add multiple detailed OpenShift virtualization dashboards. Using this combo allows you to observe your entire virtualization stack at scale. Figure 1 shows a preview of the dashboards.

Introduction to observability for OpenShift Virtualization
First things first: let’s understand how to navigate into RHACM’s Observability console. As soon as you log in to RHACM, you can see the Clusters view (see Figure 2). At the top right corner of your screen, there is a link that takes you to the Grafana dashboards.

Once you’re in the dashboards page, go to the search box at the very top, and search for "Virtualization" or simply follow the breadcrumbs and click on the folders: Home → Dashboards → ACM/OpenShift Virtualization (Figure 3).

Understanding the dashboards
Now that we've successfully deployed both dashboards, let’s take a deeper look at each of them.
OpenShift Virtualization: Cluster overview
The Clusters Overview dashboard is focused on displaying all aggregated information from all clusters running OpenShift Virtualization within the RHACM management fleet, displaying the entire virtualization infrastructure capacity. This is a huge value add for the Operations team managing thousands of VMs across the fleet.
The information is segregated into four sections, which we detail below:
General Information
Operator Health
Additional Virtual Machine Details
Resources Utilization
General Information and Operator Health
This is a section of the dashboard that aims to provide a detailed overview of key high-level infrastructure data. Here, administrators can quickly assess a complete look and feel of their virtualized environment. See Figure 4.
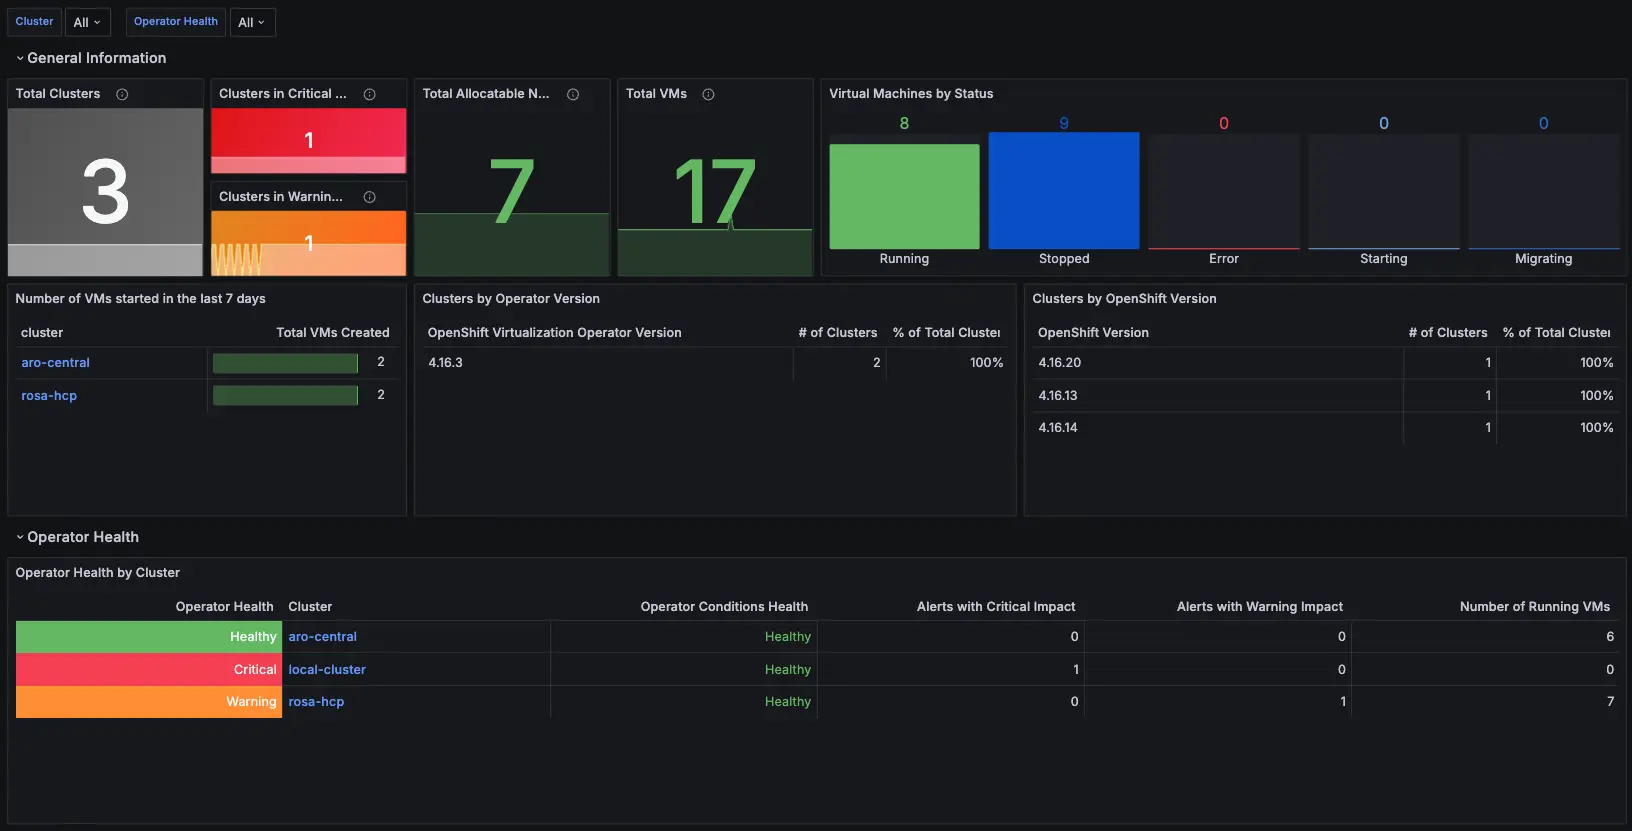
Some information you'll see includes:
- Total number of clusters running OpenShift Virtualization.
- Clusters in Critical Health.
- Clusters in Warning Health.
- OpenShift version of each cluster.
- OpenShift Virtualization version of each cluster.
- Total number of nodes that can host virtual machines.
- Total number of VMs.
- Total number of VMs by status (running, stopped, error, starting, migrating).
- Number of recently created and started VMs in the last 7 days.
- Graph showing the total number of VMs running in each cluster.
- Operator Health Alerts aggregated by each cluster.
Additional Virtual Machine Details
In this row, you can see details across all virtual machines regarding their statuses and operating systems, as well as a visual timeline on their hosts (nodes) and clusters. See Figure 5.

Resources Utilization
Under this section (shown in Figure 6), you will dive deeper into the history of resource consumption, and identify potential bottlenecks, idle resources, or even unexpected consumption peaks per cluster.

Here, you will see:
- Aggregated CPU usage by each cluster.
- Aggregated memory usage by each cluster.
- Aggregated network usage by each cluster, showing both inbound and outbound traffic.
- Aggregated storage usage in IOPs by each cluster.
OpenShift Virtualization: Single Cluster View
The OpenShift Virtualization Single Cluster View dashboard is more focused on detailed visualizations in a specific OpenShift Virtualization cluster. Figure 7 depicts this.

The key connection here is that once you’re in the Clusters Overview dashboard, and you wish to have a deeper look on a single OpenShift Virtualization cluster or within a specific datacenter, you can just click on the name of the cluster on any panel on the Clusters Overview dashboard that shows a specific cluster, and it will redirect you to the Single Cluster View dashboard for that specific cluster. Try it out!
Let’s break it down one more time. The information in the Single View dashboard is also segregated into four very similar sections: General Information, Additional Virtual Machine Details, Resources, and Alerts.
General Information
This section of the dashboard is aimed to provide a more specific view of the cluster infrastructure, displaying information to quickly assess the state of the virtualization cluster. See Figure 8.

Some information you'll see includes:
- Cluster name: displays the name of the cluster being analyzed.
- Provider: displays which provider/infrastructure the cluster is running on.
- OpenShift Virtualization version.
- OpenShift Cluster version.
- Total nodes used to provision VMs.
- Total VMs created.
- Total VMs running.
- Total VMs not running.
- List of the names of the last VMs created.
- Timeline of total VMs running.
- Timeline of total VMs running on each node.
- Total VMs aggregated by phase, except non running.
- Total VMs aggregated by Operating System.
Additional Virtual Machine Details
The Additional Virtual Machine Details section is shown in Figure 9. Information you'll see here includes:
- Timeline of total VMs running by status (starting, running, migrating, error, and stopped).
- Timeline of total VMs running on each node.

Resources
Similarly, under this section, you’ll be able to dive deeper into the history of resource consumption and identify potential bottlenecks, idle resources, or even unexpected consumption peaks per node and per Virtual Machine (not per Cluster, as in the Clusters Overview dashboard). See Figures 10 and 11.


Some information you'll see:
- Aggregate CPU usage by each node and VM.
- Aggregate memory usage by each node and VM.
- Aggregate network usage by each node and VM, showing both incoming and outgoing traffic.
- Aggregate storage usage in IOPs by each node and VM.
Alerts
In this section you’re able to see the main alerts, status and health of not only the OpenShift Virtualization operator, but all virtualization related alerts in a specific Cluster (Figure 12).

Some information you'll see includes:
- Alerts by severity: Critical, Warning, and Information.
- List of Alerts related to OpenShift Virtualization and not only Operator Health, displaying alert name, virtual machine, namespace, and severity.
Conclusion
We’ve just seen how OpenShift Virtualization expands your application platform by letting you run virtual machines and containers side by side. At scale, a strong monitoring system can keep everything running smoothly, cut costs, and right-size, ensuring you never lose access to your critical applications. But wait! There’s more: future articles in this series will follow along to delve deeper into how to read the additional panels and how to further customize them according to your own needs.
If you want to learn more about the solutions, don’t hesitate to access the Getting started with OpenShift Virtualization page and watch the RHACM playlist on YouTube. Feedback is welcome at acm-contact@redhat.com.
In the next installment, we'll discuss three additional dashboards: Monitoring OpenShift Virtualization at scale with Red Hat Advanced Cluster Management: Part 2