In Part 1 of this series, we discussed two important dashboards—OpenShift Virtualization Clusters Overview and Single Cluster Overview—which, together with three additional dashboards, will be introduced in Red Hat Advanced Cluster Management for Kubernetes (RHACM) 2.12. These dashboards simplify the monitoring of Red Hat OpenShift Virtualization at scale. This second part dives into the additional three dashboards that will also be available in RHACM 2.12: Single Virtual Machine View, Virtual Machines Inventory, and Virtual Machines by Time in Status.
We will explore how these dashboards can help system administrators manage virtual machines (VMs) more efficiently, especially in large, distributed Red Hat OpenShift environments.
What are these three new dashboards, and how can they help me manage VMs more efficiently?
With RHACM 2.12, three new dashboards are introduced to streamline VM monitoring and management:
- Single Virtual Machine View
- Virtual Machines Inventory
- Virtual Machines by Time in Status
Each dashboard is designed to provide system administrators with actionable insights, helping to optimize resources, improve troubleshooting, and ensure smooth operations across clusters.
What does the Single Virtual Machine View dashboard do?
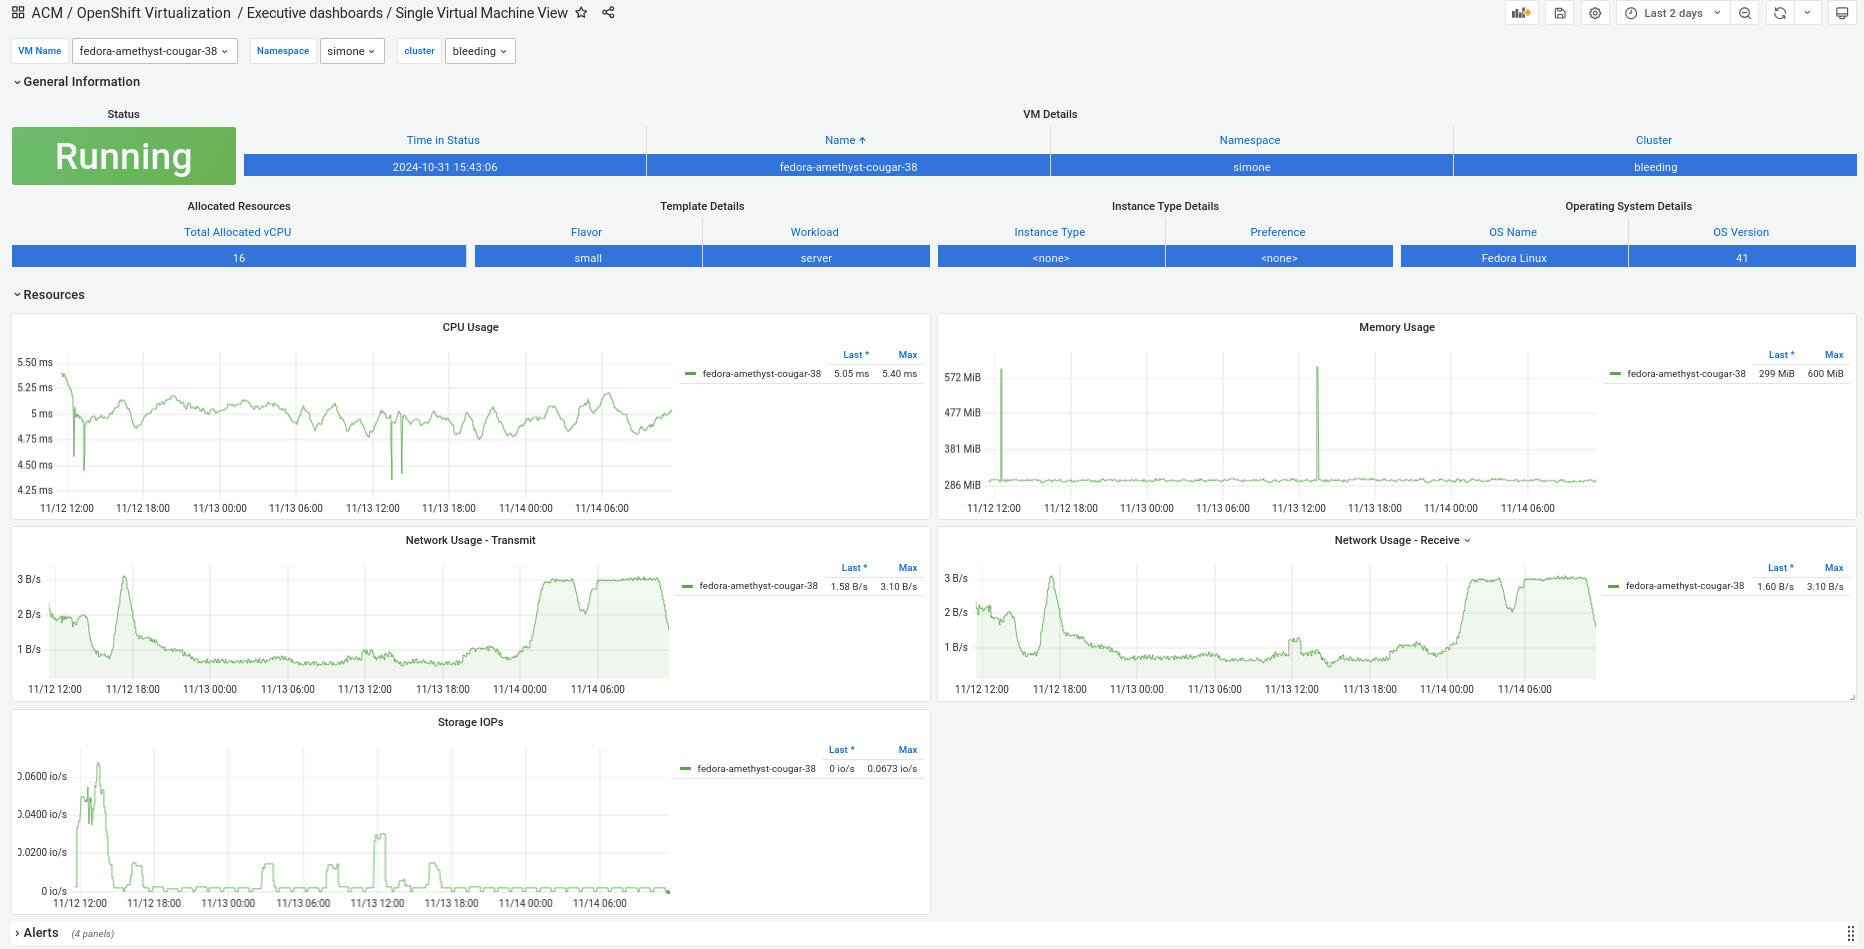
The Single Virtual Machine View dashboard (Figure 1) provides a detailed snapshot of a specific VM, including its configuration, resource usage, and any active alerts. This dashboard allows system administrators to easily track and manage individual VMs.
Use case
Suppose you’re managing multiple clusters, and a specific VM is causing performance issues. The Single Virtual Machine View dashboard lets you quickly view the VM’s resource consumption and configuration, making it easier to troubleshoot or optimize its setup.
When should I use it?
Use the Single Virtual Machine View dashboard in these instances:
- Focused troubleshooting: When a VM experiences performance issues or misbehavior, you can use this dashboard to dive into its specifics and quickly assess its health and configuration.
- Track VMs across clusters: If you’re managing VMs across multiple clusters, this dashboard helps locate and monitor the performance of individual VMs.
Actionable insights
Using this dashboard, you can:
- Adjust the VM’s CPU or memory allocation if you notice resource imbalances.
- Utilize active alerts help identify potential problems, like network bottlenecks or storage issues, so you can fix them before they escalate.
How can I use the Virtual Machines Inventory dashboard, and what makes it different?
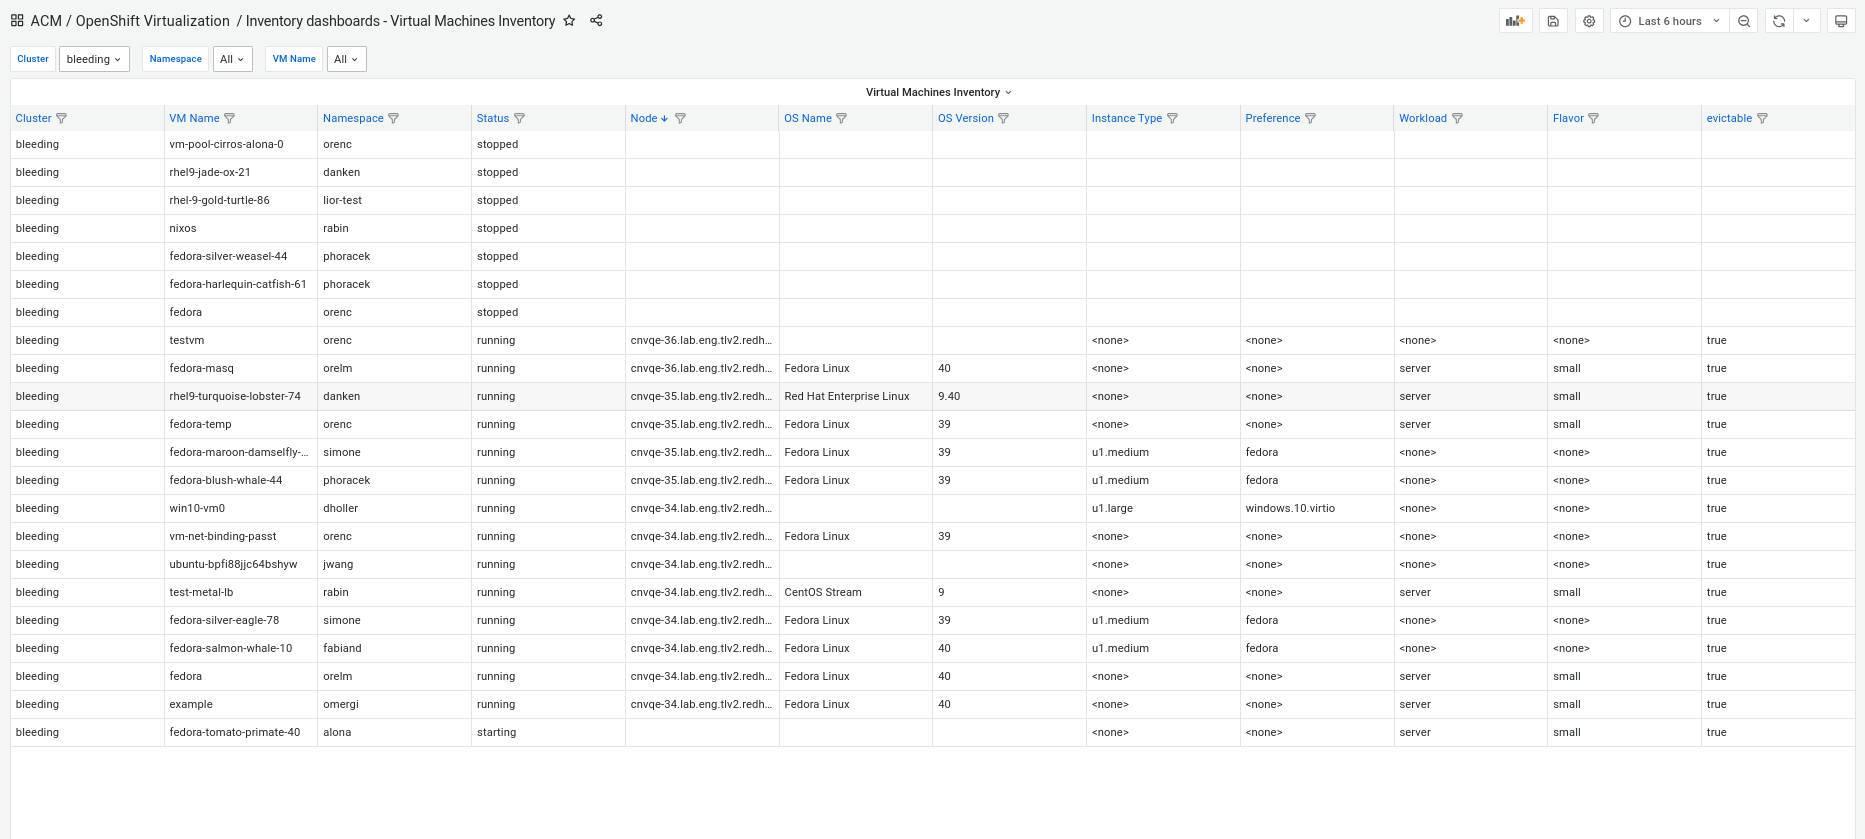
The Virtual Machines Inventory dashboard allows you to search for VMs based on multiple criteria, such as cluster, namespace, status, node, OS name and version, whether the VM is evictable, whether the guest agent is reporting, and etc. This makes it easy for system administrators to identify specific VMs and use the list as a reference for performing various operations. See Figure 2.
Use case
Imagine you need to locate all VMs running a particular OS version or find VMs in a specific namespace. This dashboard enables efficient filtering based on your criteria. Once you have the list, it serves as a starting point for performing actions like powering off VMs, deleting them, cloning, or initiating migrations.
When should I use it?
Utilize the Virtual Machines Inventory dashboard for these scenarios:
- Advanced VM filtering: When you need to identify VMs based on specific criteria, such as their location on a node or their current status, this dashboard gives you the flexibility to search and focus on the VMs you need to manage.
- To perform VM operations: After identifying the VMs, you can use the list as the basis for making decisions on how to handle those VMs—whether it’s powering them off, deleting, or other tasks like cloning or migrating.
Actionable insights
With this dashboard, you can:
- Use the search results to prioritize which VMs need attention, such as stopping underutilized VMs, migrating workloads, or preparing VMs for maintenance.
- Take advantage of the ability to filter VMs by criteria like namespace or OS version, which helps you focus on specific subsets of VMs, making it easier to plan and execute operations on those VMs individually.
What’s the purpose of the Virtual Machines by Time in Status dashboard?
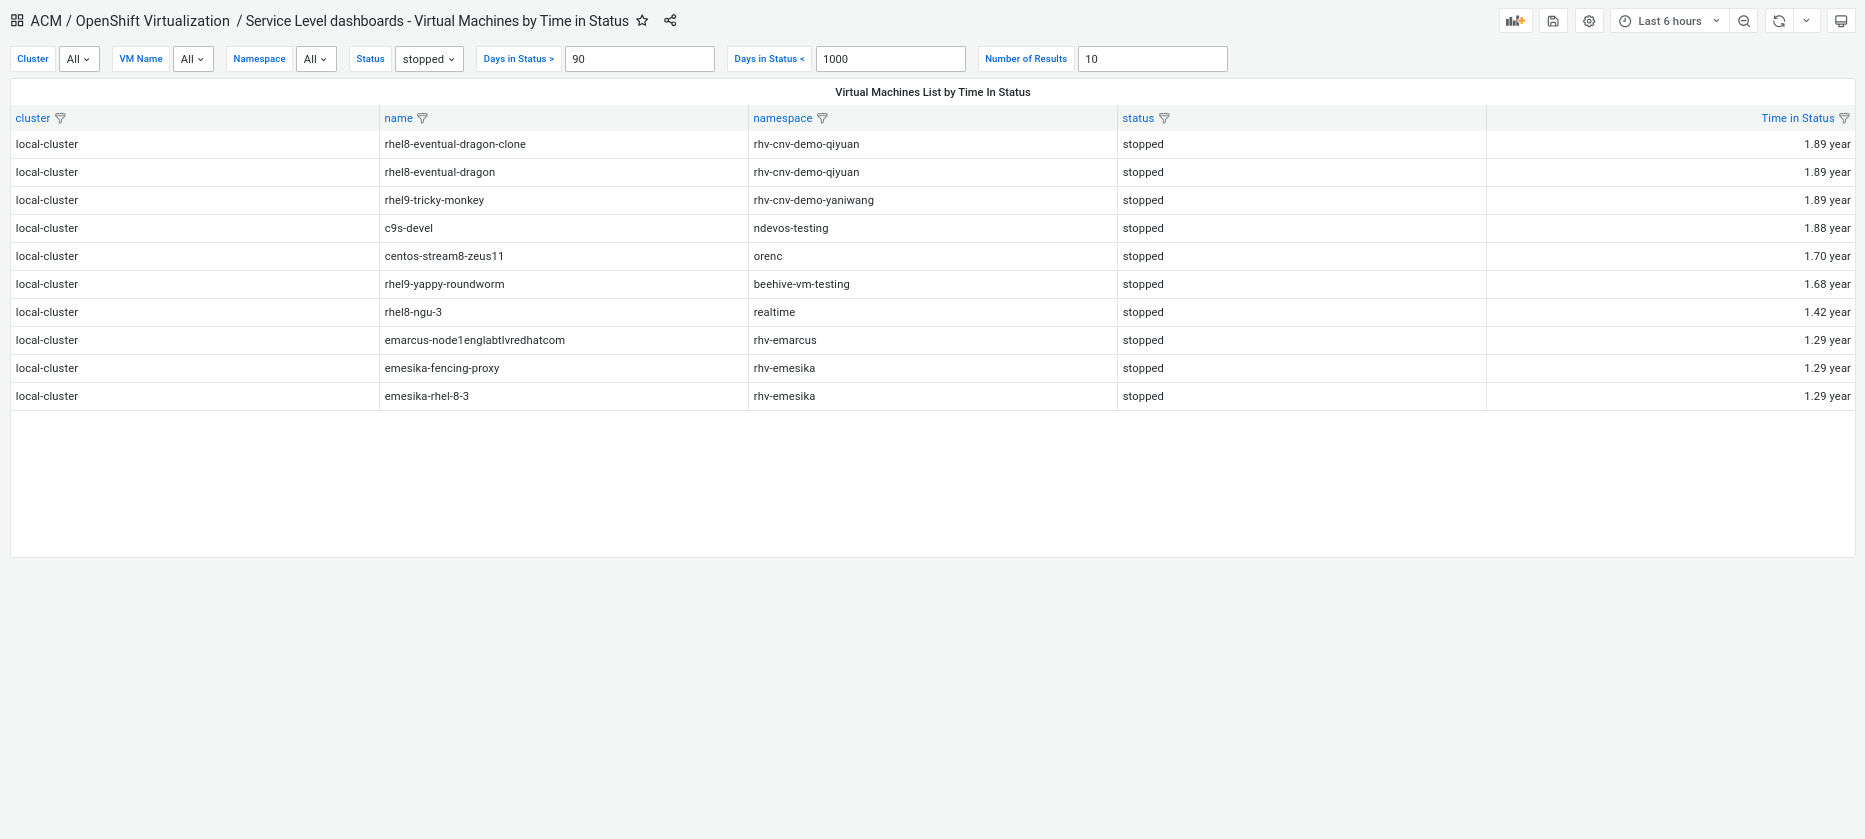
The Virtual Machines by Time in Status dashboard helps administrators track how long VMs have been in their current state—whether stopped, starting, migrating, or in error. This dashboard, shown in Figure 3, is ideal for identifying VMs that have been in an unhealthy state for too long, as well as for addressing issues more proactively.
Use case
If you manage a large fleet of VMs, some might be stuck in states like "error" or "migrating" for an extended period. The Virtual Machines by Time in Status dashboard helps you filter VMs based on how long they’ve been in these states and take the necessary actions to resolve issues.
When should I use it?
Use the Virtual Machines by Time in Status dashboard in these scenarios:
- Status monitoring and SLA management: This dashboard is critical for ensuring uptime and reliability. If you have SLAs to maintain, it lets you identify VMs that have been in an undesirable state for too long and act to resolve the issue.
- Identify VMs for cleanup or further investigation: By filtering based on how long a VM has been in a specific status (e.g., stopped or in error), you can identify VMs that might no longer be needed or that require troubleshooting.
Actionable insights
Using this dashboard, you can:
- Filter VMs using “greater than” or “less than” time-based filters to see those that have been in a certain state for a long time. This allows for quick decision-making regarding VM cleanup or resource reallocation.
- Proactively address VMs in error states to prevent them from affecting your infrastructure’s overall performance and stability.
How do these dashboards complement the Clusters Overview and Single Cluster Overview dashboards?
All five dashboards—Clusters Overview, Single Cluster Overview, Single Virtual Machine View, Virtual Machines Inventory, and Virtual Machines by Time in Status—are designed to work together to give you full visibility into your virtualized infrastructure.
- Clusters Overview provides a top-level view of all clusters, allowing you to monitor their health and resource consumption.
- Single Cluster Overview focuses on specific clusters, helping you track their performance and health in more detail.
- Single Virtual Machine View, Virtual Machines Inventory, and Virtual Machines by Time in Status provide granular insights into VMs, making it easy to perform targeted troubleshooting and operational tasks.
Together, these dashboards provide a holistic view of your virtual infrastructure, enabling you to manage OpenShift Virtualization at scale with ease and precision.
Why should system admins use these dashboards in RHACM?
Managing virtual machines at scale requires clear visibility into your environment, especially when dealing with multi-cluster environments. These five dashboards—available in RHACM 2.12—give system administrators the tools they need to ensure smooth operations, meet SLAs, and optimize resource utilization.
By using these dashboards, system admins can:
- Reduce downtime: Quickly identify and fix VMs that are stuck in unhealthy states or are underperforming.
- Optimize resource usage: Filter and search for VMs based on various criteria, allowing you to plan the operations you need to perform and improve overall efficiency.
- Simplify multi-cluster management: Get a high-level view of your clusters while still being able to dive deep into individual VMs when needed.
What’s next?
Red Hat Advanced Cluster Management 2.12 introduces these five dashboards to streamline the management of VMs in OpenShift Virtualization. Whether you're overseeing a few clusters or hundreds, these dashboards will give you the insights and tools you need to ensure your environment is running efficiently and reliably.
Be sure to upgrade to RHACM 2.12 and take full advantage of these new capabilities to simplify your virtual machine management and improve your overall operations.
Additional dashboards will be added in the future releases of RHACM, like VMs RightSizing recommendations.
Last updated: July 22, 2026