As the volume of observability signals increases, there is an urgent need to reduce the noise out of the data and help Red Hat OpenShift users deal with such complexity. Identifying the information that matters can suddenly become costly and time-consuming. Motivated by the goal of offering an effective solution to the problem, the Red Hat observability group has been launching and investing on its own troubleshooting journey initiative.
The observability troubleshooting journey wants to provide a systematic approach to OpenShift users for identifying and resolving cluster issues in a simplified way, reducing the number of manual steps and cognitive load usually required to fulfill these tasks. In short, the observability troubleshooting journey initiative is composed of a series of analytical tools that aim at reducing the overall mean time to detection (MTTD) and mean time to resolution (MTTR).
Currently, two troubleshooting features have been released as part of this journey, both of them as developer preview for our OpenShift users: incident detection, which we describe in this article, and observability signal correlation for Red Hat OpenShift (note that an enhanced developer preview has been released with the 0.3.0 release of the cluster observability operator.)
Incident detection
From day one, OpenShift 4 has been built with observability in mind. In the distributed world of the Kubernetes ecosystem, this has huge benefits when it comes to troubleshooting and understanding the behavior of the system. Not only do the components provide enough raw observability data, they also define alerts and other indicators of its health.
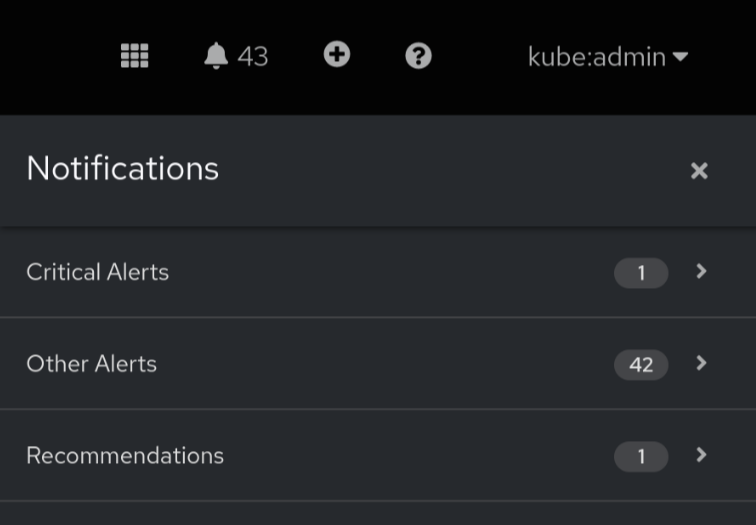
However, the distributed nature brings some challenges as well. Especially when some initial issue affects the health of multiple components, one can get overwhelmed with the amount of alerts popping up. Figure 1 shows 43 alerts, but there are not really 43 individual issues. There are instead just a few issues that eventually lead to this alert burst.
As Red Hat has seen several of these situations, we started looking into ways to help you to get on top of the alerts and guide your attention to the right place. That’s where the idea of incident detection came from.
The main idea behind incident detection is the observation that if multiple alerts start popping up around the same time, it’s very likely they are somehow connected. Of course in the real world, while it works most of the time, in specific cases it can still be just a coincidence and we try to take this into account as well. What we do is observe the alerts as they arrive and though various heuristics assign the alerts into groups that we call incidents.
This grouping data is available as Prometheus metrics. As part of the developer preview, we provide a prototype UI to better visualize the concepts (more about installation later). Eventually, instead of 43 individual alerts, you get a timeline of 4 incidents that the cluster has been affected with. See Figure 2.
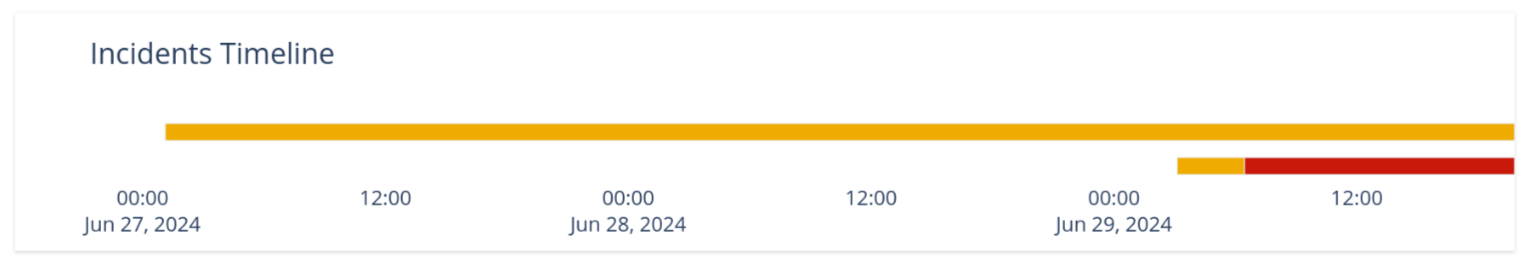
The color coding of the lines in the graph corresponds to the severity: in this case, you see the top incident starting as a warning, while it evolved into critical state over time.
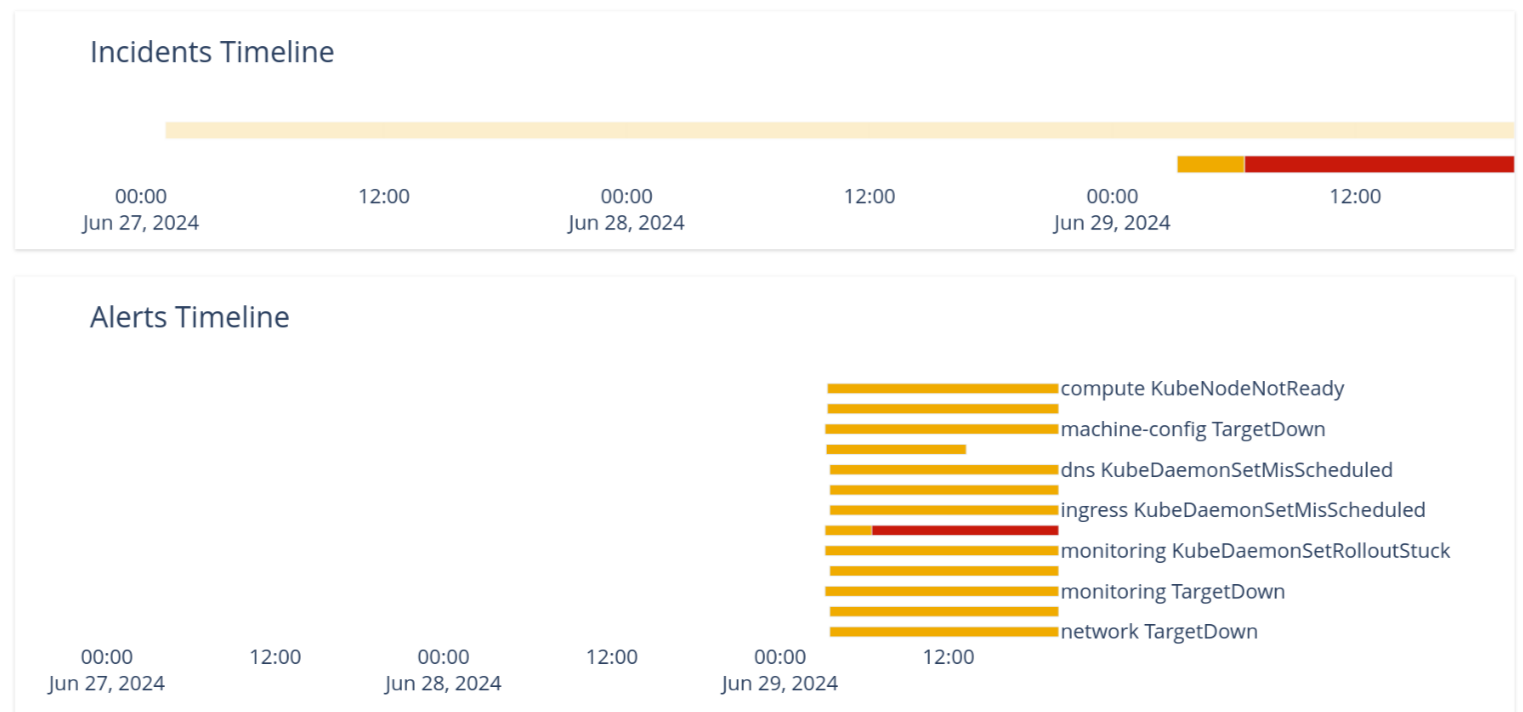
By clicking the incident line, you can see the timeline of individual alerts that are part of the incident (Figure 3).
The functionality doesn’t stop there. We had numerous discussions to better understand the troubleshooting process, including subject matter experts in Red Hat (including the SRE team responsible for Red Hat managed OpenShift offerings) as well as among our customers. One of the things the discussions revealed was the crucial role of knowing what components got affected during the incident. Not all components are born equal. For example, affected etcd can have a big impact on many other parts of the system, and therefore it makes sense to focus on it before any other issues being reported. Therefore, we’ve included a mechanism to assign individual alerts to corresponding components, as well as ranking of those components.
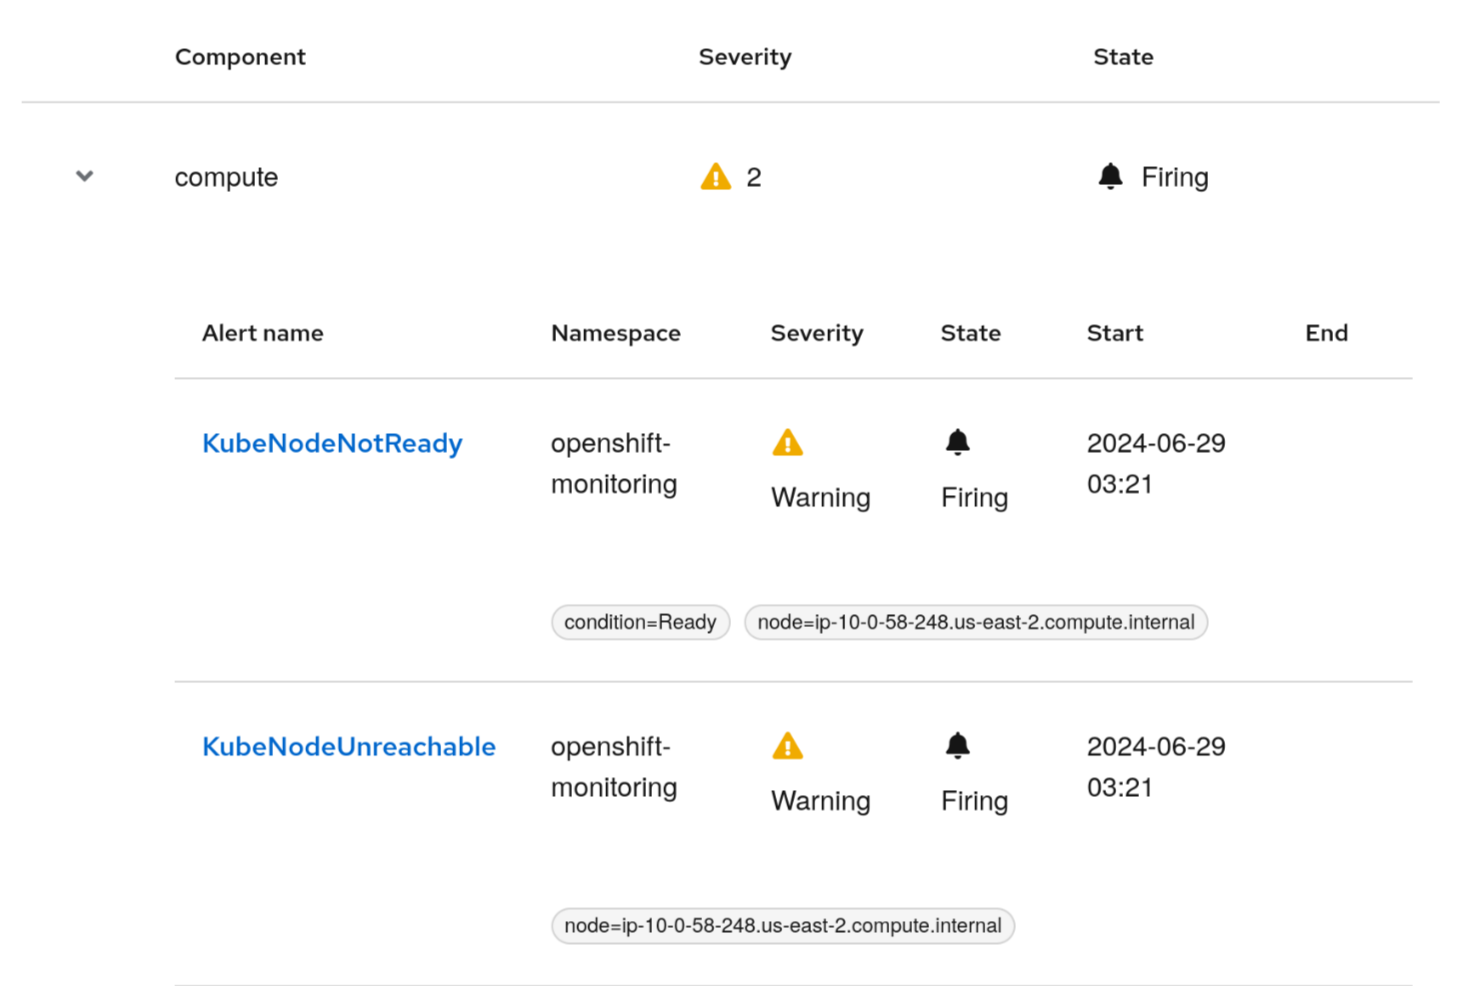
As a result, you get a list of alerts belonging to the incident categorized by the components, with the most important component at the top. See Figure 4.
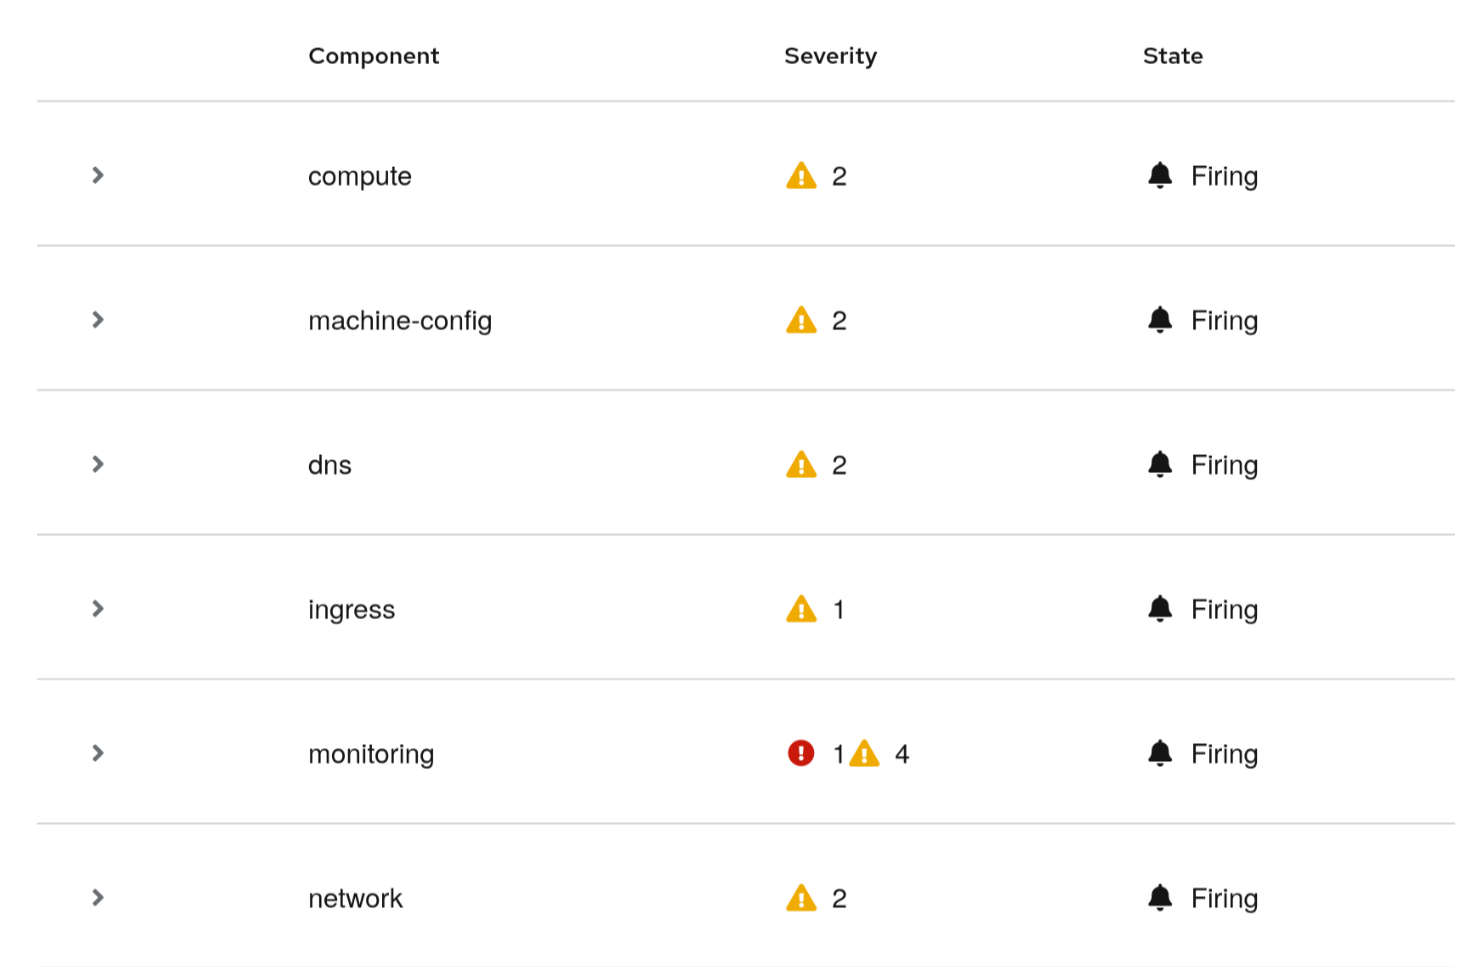
We see that, although there is a critical alert in the monitoring component, there is some issue at the top in the compute layer, and it’s suggested to check it before the rest. Expanding the compute component reveals information about the alerts related to the underlying nodes infrastructure, which is the root cause for the rest of the alerts in the incident. You can then just follow the link to the alert details to continue troubleshooting the issue, as shown in Figure 5.
Installation
Disclaimer
The feature is developer preview only. Consult the developer preview support statement to learn more.
Currently, the incident detection functionality is available as a developer preview. We provide the source code, as well as pre-built container images, with deployment manifests to get everything up and running in your environment.
Clone the Git repository with the back-end code that also includes the deployment manifests:
git clone https://github.com/openshift/cluster-health-analyzer.git -b dev-preview
        cd cluster-health-analyzer
Apply the manifests against your cluster:
oc apply -f manifests/backend -f manifests/frontend- Once the deployment is complete, the incidents UI prototype should be available here (update according to your domain). Alternatively, you can go to the
cluster-health-analyzerproject in the OpenShift console, find the corresponding Route, and click the link in the Location row to open up the UI.
The incident data should start getting populated after the installation. It’s advised to keep it running for a few hours so that there is enough data to explore.
The deployment scripts will:
- Deploy both the backend that’s responsible for incident detection itself as well as the components mapping.
- Configure monitoring stack to scrape the data from the backend to make it available via Prometheus.
- Not that as of the current version, this requires user-workload monitoring to be enabled and it’s done as part of the provided manifests. In future versions, it would rely solely on the in-cluster platform monitoring stack.
- Deploy the frontend UI prototype and make it available (behind authentication screen).
- The user needs to have access to in cluster monitoring (e.g., via binding to
cluster-monitoring-view) - In the future, the experience is expected to be provided directly in the OpenShift web console. For now, we’re providing the functionality as a standalone web application.
- The user needs to have access to in cluster monitoring (e.g., via binding to
What’s next?
The main purpose of releasing a developer preview of incident detection is for you to get an early access of the functionality and ability to gather more feedback to incorporate in further development.
As of the functionality itself, besides working on the productization efforts, we would like to look into making available a similar functionality in the multi-cluster scenario with Red Hat Advanced Cluster Management for Kubernetes, integrating it more with the rest of the ecosystem and provide more troubleshooting capabilities for the incidents leveraging the underlying observability stack.
Do you want to engage with us and provide feedback? Do so in our feedback form.
