Incident detection is now part of the Red Hat OpenShift web console monitoring UI plug-in, included with the latest release of the cluster observability operator (COO) version 1.1.0. This technology preview release follows last October’s developer preview and integrates the incidents UI into the OpenShift web console under the Observe section. This article presents a step-by-step guide to incident detection for OpenShift and describes how this new feature improves observability and incident analysis.
Why you need incident detection
When an issue occurs in a cluster, you rarely receive just one alert. Instead, you get a cascade of related alerts as the error propagates. This phenomenon, known as an alert storm, is a common challenge in distributed systems.
Incident detection groups related alerts into incidents, helping you identify root causes instead of getting overwhelmed by individual alerts. Currently, the alert grouping is based primarily on the temporal correlation between events. Over time, the algorithm will likely evolve to include other factors.
The incidents UI provides a color-coded incident timeline by severity, allowing you to drill down into specific alerts. Alerts are also categorized by affected OpenShift components and severity, helping you prioritize critical issues first.
Installing the cluster observability operator
The Operator Lifecycle Manager (OLM) standardizes and handles the installation process. Follow these steps to install the cluster observability operator 1.1.0:
- Install the operator from OperatorHub by using the Red Hat OpenShift Container Platform web console.
- Add the monitoring UI plug-in and enable the incidents feature as follows:
oc apply -f - <<EOF
apiVersion: observability.openshift.io/v1alpha1
kind: UIPlugin
metadata:
  name: monitoring
spec:
  type: Monitoring
  monitoring:
    incidents:
      enabled: true
EOF
Note:
You can also add the monitoring plug-in from the OpenShift web console. See the monitoring UI plug-in installation guide for more details.
- Wait for the "Web console update is available" pop-up message, indicating the installation is finished (Figure 1).
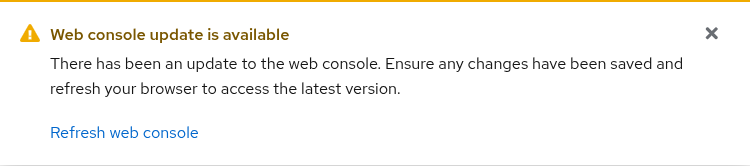
- Click Refresh web console.
- Incident detection is now available under Observe → Incidents.
Incident analysis
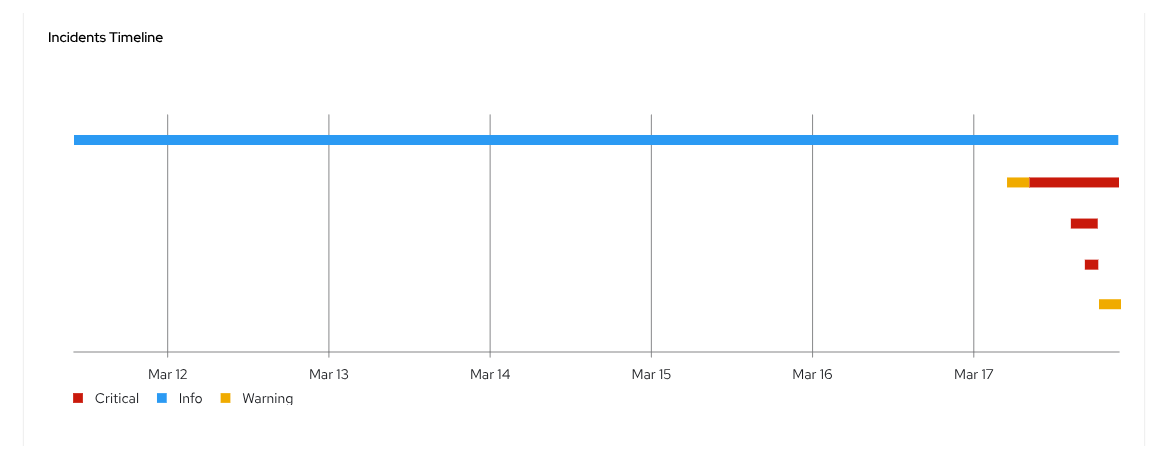
The incidents UI groups alerts into incidents with color-coded lines indicating severity. The severity of an incident is the maximum severity among the alerts in the group. If at a given time all the alerts are warnings except one that is critical, the incident is considered critical. The severity of the incident can vary over time, so this tracks the evolution of alerts over time.
By default, the UI displays a seven-day timeline, as shown in Figure 2.
Note:
After enabling incident detection, correlations take at least 10 minutes to process before appearing in the timeline. The analysis and grouping into incidents is performed only for alerts that are firing after you have enabled the feature. Alerts that have been resolved before feature enablement are not included.
Use filters and the drop-down menu to focus on your interests:
- Severity (critical, warning, info): By default, you will see all incidents, but you may want to highlight only critical incidents.
- State (firing, resolved): You are usually interested in firing incidents, but you can also view past and resolved incidents for additional context. A past incident, even if resolved, may be relevant to understanding a current incident.
- Time window (15 days, 7 days, 3 days, 1 day): Zoom out to get the past context and identify the long-term incidents (usually not real problems), and zoom in to focus on the last 24 hours of issues.
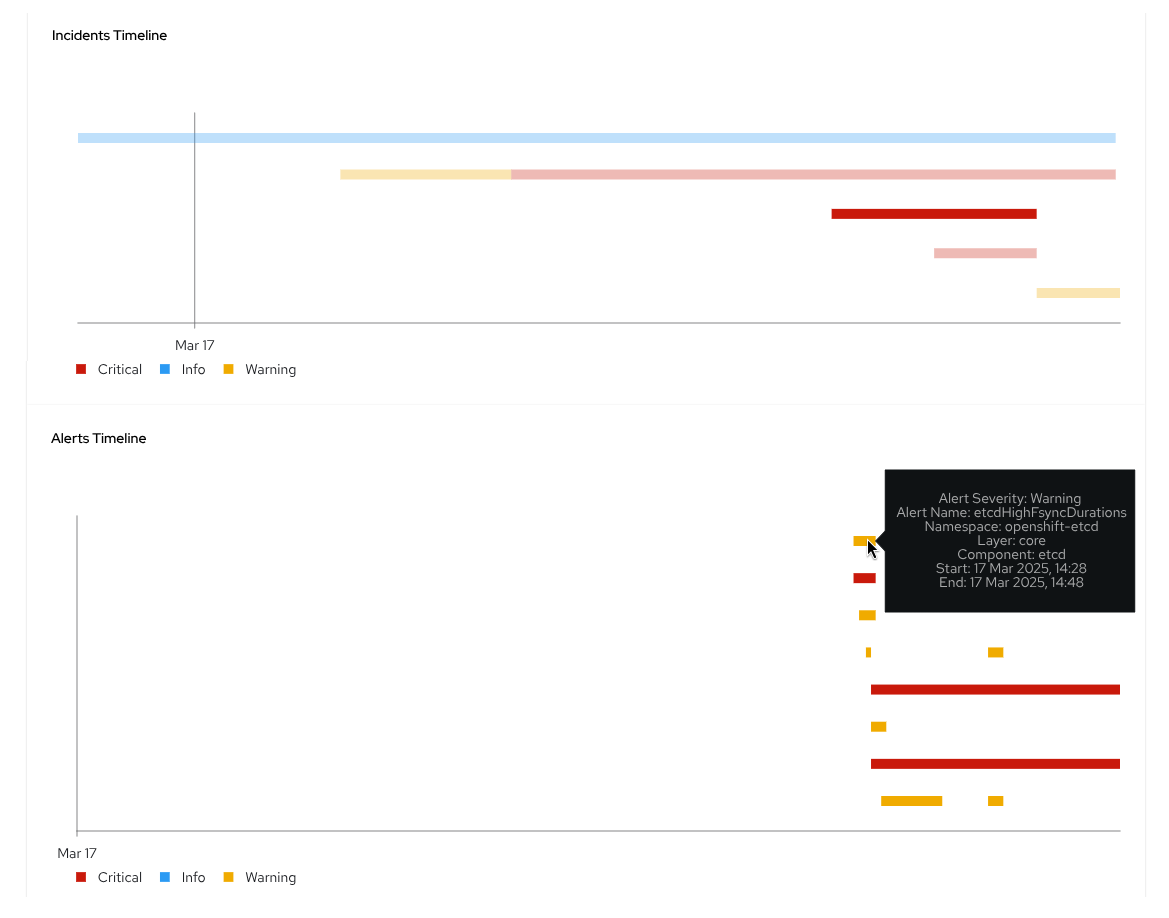
Click an incident to show the alerts in a timeline view, as depicted in Figure 3.
Click an incident to show the alerts in a component-based view, as depicted in Figure 4.
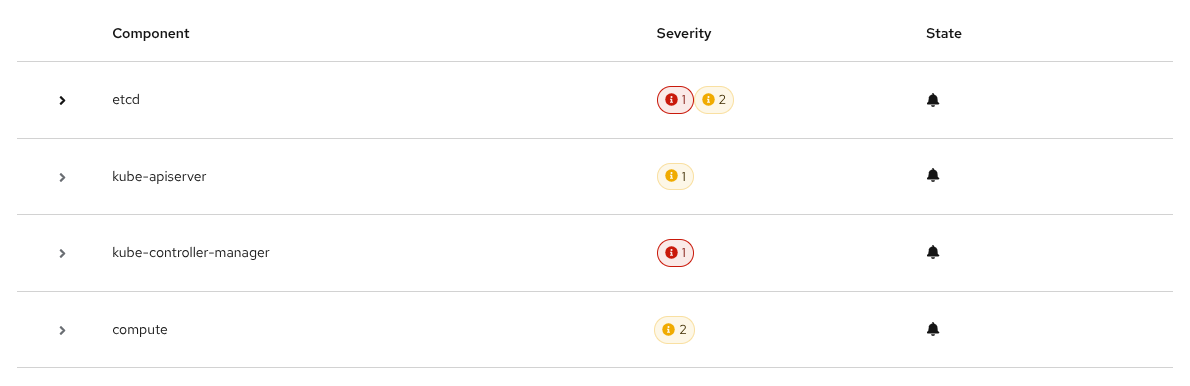
Click a component to show all related alerts and details (Figure 5).
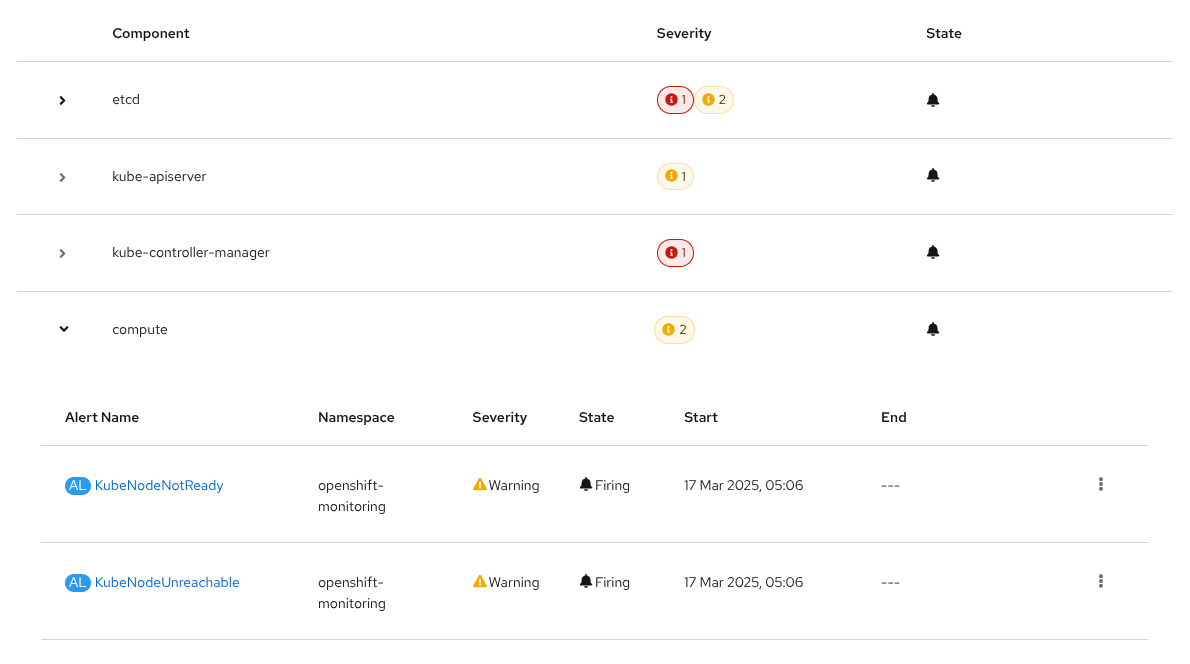
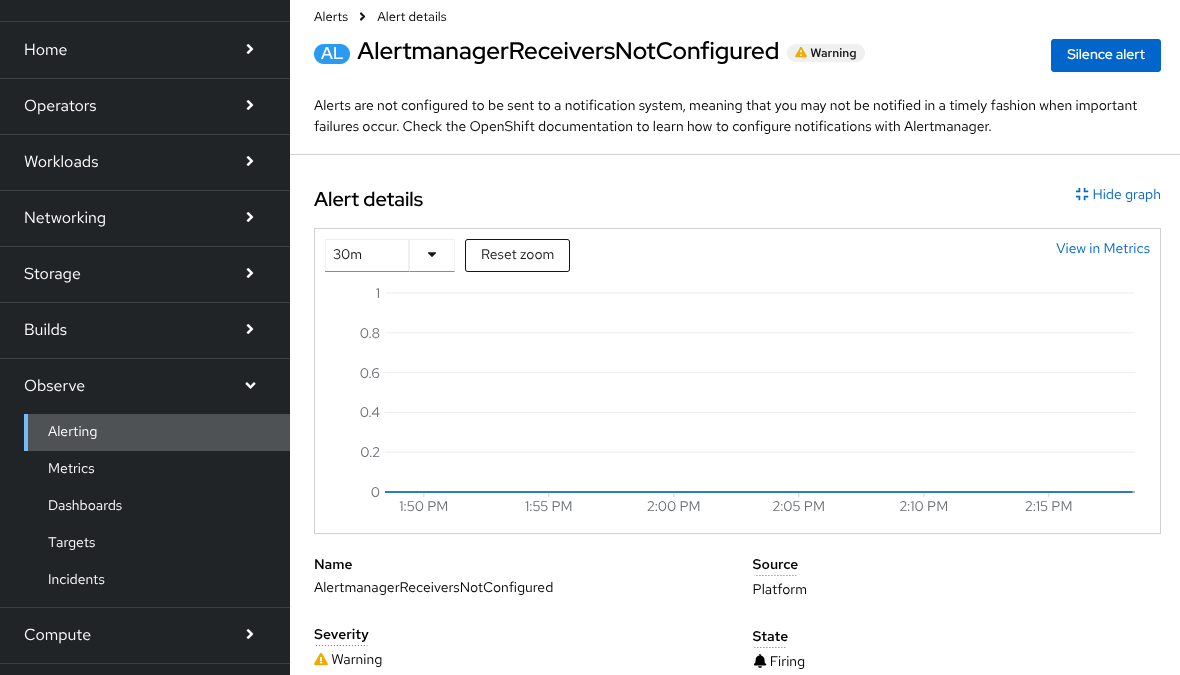
If an alert is firing, you can click its name to access the standard Alerting → Alert Details page, as shown in Figure 6.
There’s no single way to use the incidents UI. Depending on the question, you can use the timeline and component views interchangeably. These views help administrators better understand and respond to issues.
Limitations and issues
While in its current technology preview state, the incidents UI comes with the following limitations:
- Depending on the order of the timeline bars, the tooltip might overlap and hide the underlying bar. You can still click the bar and select the incident or alert.
- The severity filter is applied to alerts, not incidents. The behavior might be counterintuitive if you only filter by warning or info. For example, a warning incident might still appear when filtering by severity=info if it contains one or more info alerts.
- Silenced alerts are always visible in the timelines.
- The silence alert button in the component section does not pre-populate the fields and is not usable. As a workaround, you can use the same menu and the silence alert button in the alerting section instead.
What’s next?
Incident detection with observability signal correlation is part of the observability troubleshooting journey initiative, which is a structured approach designed to improve the efficiency and effectiveness of identifying and resolving issues within your cluster(s).
The incidents UI is like the pivot table in a spreadsheet, allowing you to view and analyze the data (in our case, alerts) from different perspectives to stimulate and speed up interpretation. Thanks to this technology preview release, you can familiarize yourself with the tool and use it right away as part of your cluster management.
Eventually, we plan to make the incident detection feature generally available to OpenShift users, while in the meantime improving usability with advanced filtering. We look forward to receiving your input and ideas. Feel free to share your questions and recommendations with us using the Red Hat OpenShift feedback form.