Redhat Developers  Logo
  • Products

    Featured

    • Red Hat Enterprise Linux
      Red Hat Enterprise Linux Icon
    • Red Hat OpenShift AI
      Red Hat OpenShift AI
    • Red Hat Enterprise Linux AI
      Linux icon inside of a brain
    • Image mode for Red Hat Enterprise Linux
      RHEL image mode
    • Red Hat OpenShift
      Openshift icon
    • Red Hat Ansible Automation Platform
      Ansible icon
    • Red Hat Developer Hub
      Developer Hub
    • View All Red Hat Products
    • Linux

      • Red Hat Enterprise Linux
      • Image mode for Red Hat Enterprise Linux
      • Red Hat Universal Base Images (UBI)
    • Java runtimes & frameworks

      • JBoss Enterprise Application Platform
      • Red Hat build of OpenJDK
    • Kubernetes

      • Red Hat OpenShift
      • Microsoft Azure Red Hat OpenShift
      • Red Hat OpenShift Virtualization
      • Red Hat OpenShift Lightspeed
    • Integration & App Connectivity

      • Red Hat Build of Apache Camel
      • Red Hat Service Interconnect
      • Red Hat Connectivity Link
    • AI/ML

      • Red Hat OpenShift AI
      • Red Hat Enterprise Linux AI
    • Automation

      • Red Hat Ansible Automation Platform
      • Red Hat Ansible Lightspeed
    • Developer tools

      • Red Hat Trusted Software Supply Chain
      • Podman Desktop
      • Red Hat OpenShift Dev Spaces
    • Developer Sandbox

      Developer Sandbox
      Try Red Hat products and technologies without setup or configuration fees for 30 days with this shared Openshift and Kubernetes cluster.
    • Try at no cost
  • Technologies

    Featured

    • AI/ML
      AI/ML Icon
    • Linux
      Linux Icon
    • Kubernetes
      Cloud icon
    • Automation
      Automation Icon showing arrows moving in a circle around a gear
    • View All Technologies
    • Programming Languages & Frameworks

      • Java
      • Python
      • JavaScript
    • System Design & Architecture

      • Red Hat architecture and design patterns
      • Microservices
      • Event-Driven Architecture
      • Databases
    • Developer Productivity

      • Developer productivity
      • Developer Tools
      • GitOps
    • Secure Development & Architectures

      • Security
      • Secure coding
    • Platform Engineering

      • DevOps
      • DevSecOps
      • Ansible automation for applications and services
    • Automated Data Processing

      • AI/ML
      • Data Science
      • Apache Kafka on Kubernetes
      • View All Technologies
    • Start exploring in the Developer Sandbox for free

      sandbox graphic
      Try Red Hat's products and technologies without setup or configuration.
    • Try at no cost
  • Learn

    Featured

    • Kubernetes & Cloud Native
      Openshift icon
    • Linux
      Rhel icon
    • Automation
      Ansible cloud icon
    • Java
      Java icon
    • AI/ML
      AI/ML Icon
    • View All Learning Resources

    E-Books

    • GitOps Cookbook
    • Podman in Action
    • Kubernetes Operators
    • The Path to GitOps
    • View All E-books

    Cheat Sheets

    • Linux Commands
    • Bash Commands
    • Git
    • systemd Commands
    • View All Cheat Sheets

    Documentation

    • API Catalog
    • Product Documentation
    • Legacy Documentation
    • Red Hat Learning

      Learning image
      Boost your technical skills to expert-level with the help of interactive lessons offered by various Red Hat Learning programs.
    • Explore Red Hat Learning
  • Developer Sandbox

    Developer Sandbox

    • Access Red Hat’s products and technologies without setup or configuration, and start developing quicker than ever before with our new, no-cost sandbox environments.
    • Explore Developer Sandbox

    Featured Developer Sandbox activities

    • Get started with your Developer Sandbox
    • OpenShift virtualization and application modernization using the Developer Sandbox
    • Explore all Developer Sandbox activities

    Ready to start developing apps?

    • Try at no cost
  • Blog
  • Events
  • Videos

How to monitor OpenShift using the Datadog Operator

April 16, 2024
Leonardo Araujo Luiz Bernardo Levenhagen Jade Lassery, Datadog Sales Engineer
Related topics:
KubernetesOperators
Related products:
Red Hat OpenShift

Share:

    This article is aimed at users who would like to integrate or monitor their Red Hat OpenShift cluster using the Datadog monitoring solution. We will use the Datadog Operator to instantiate our agent and collect all metrics, cluster and container/pod logs, network, CPU, and memory consumption.

    Prerequisites

    • User with the cluster-admin cluster role
    • OpenShift 4.12 or above
    • Datadog account

    Procedure

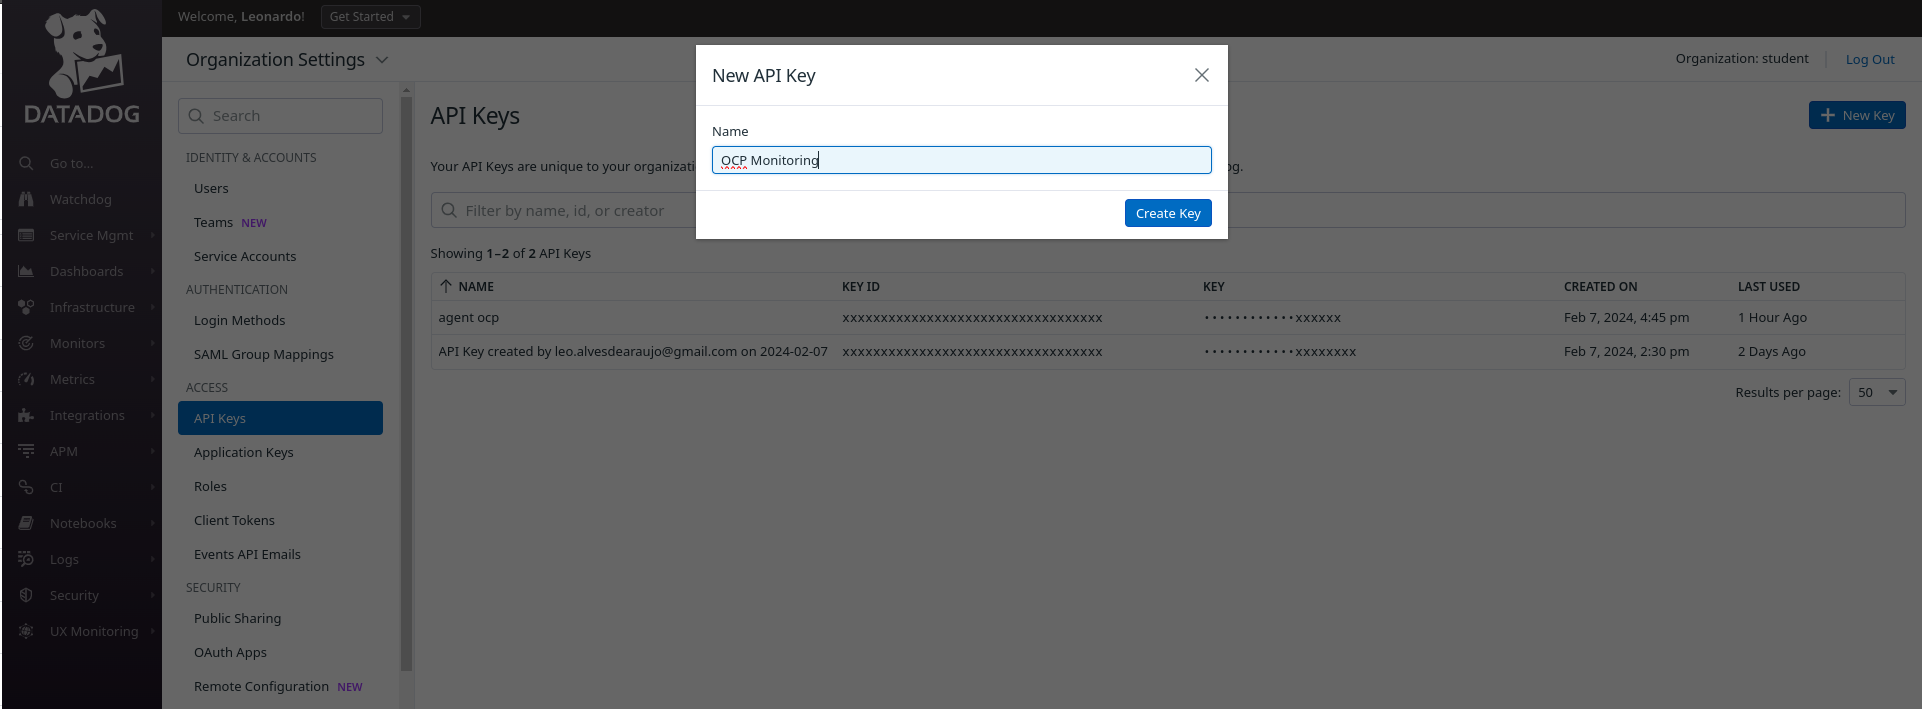
    1. Create the Datadog API key:

    • To add a new Datadog API key, navigate to Organization Settings > API Keys.
    • If you have the permission to create API keys, click New Key in the top right corner.
    • Define the desired name, as shown in Figure 1.
    • Once created, copy the key so you can use it later.
    Organization Settings' Menu in the Datadog platform for adding a new API Key
    Figure 1:
    Figure 1: Create a new Datadog API key.

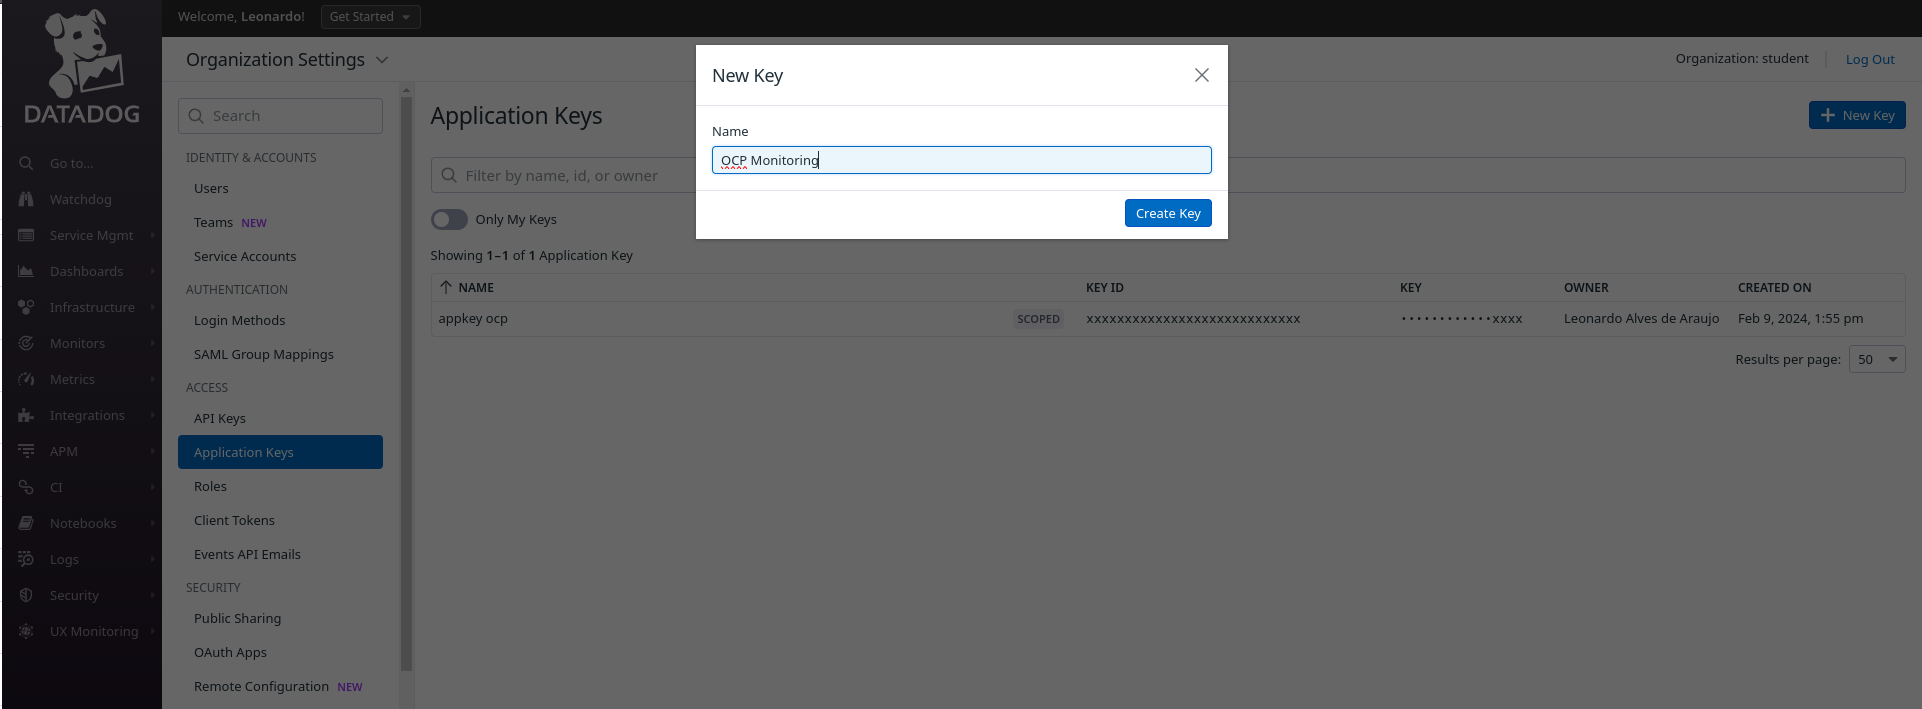
    Create a new Datadog application key:

    • Navigate to Organization Settings > Application Keys.
    • If you have the permission to create API keys, click New Key in the top right corner.
    • Define the desired name (Figure 2).
    • Once created, copy the key so we can use it later.
    Organization Settings' Menu in the Datadog platform for adding a new API Key
    Figure 2:
    Figure 2: Create a new application key in Datadog.

    Install the Datadog Operator: In the OpenShift console, in the left side menu, click Operator > OperatorHub and in the search field, type datadog (Figure 3).

    Operators Menu in the Openshift console to find the Datadog Operator
    Figure 3:
    Figure 3: Search for the Datadog Operator in OperatorHub.

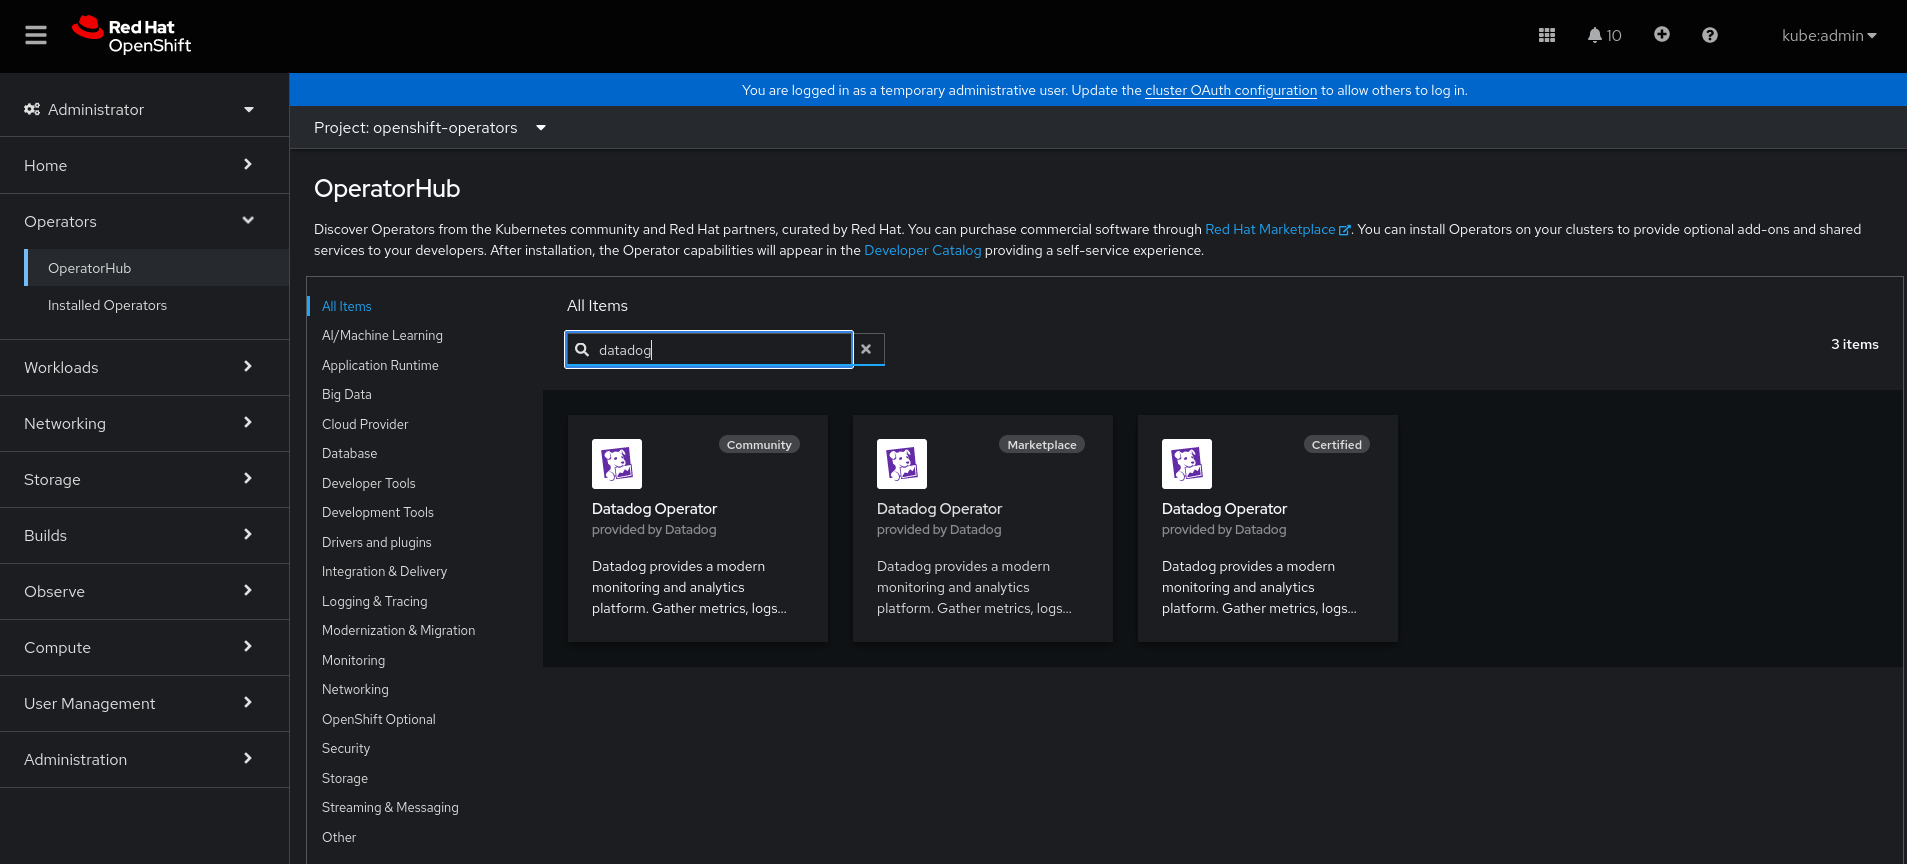
    Whenever available, use a certified option. As shown in Figure 3, we are using version 1.3.0. 

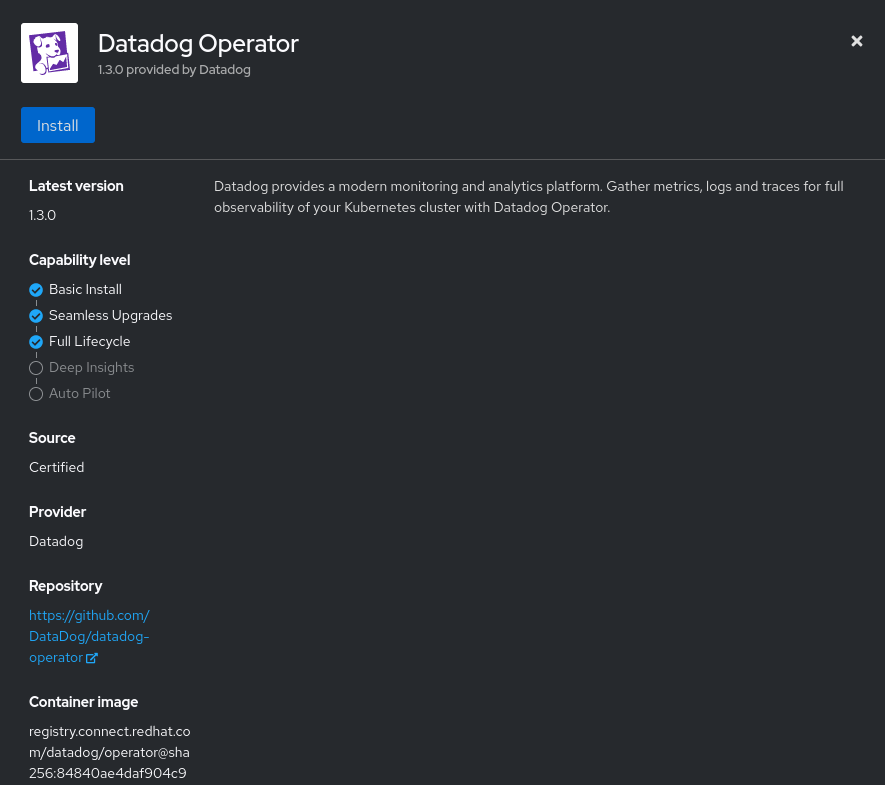
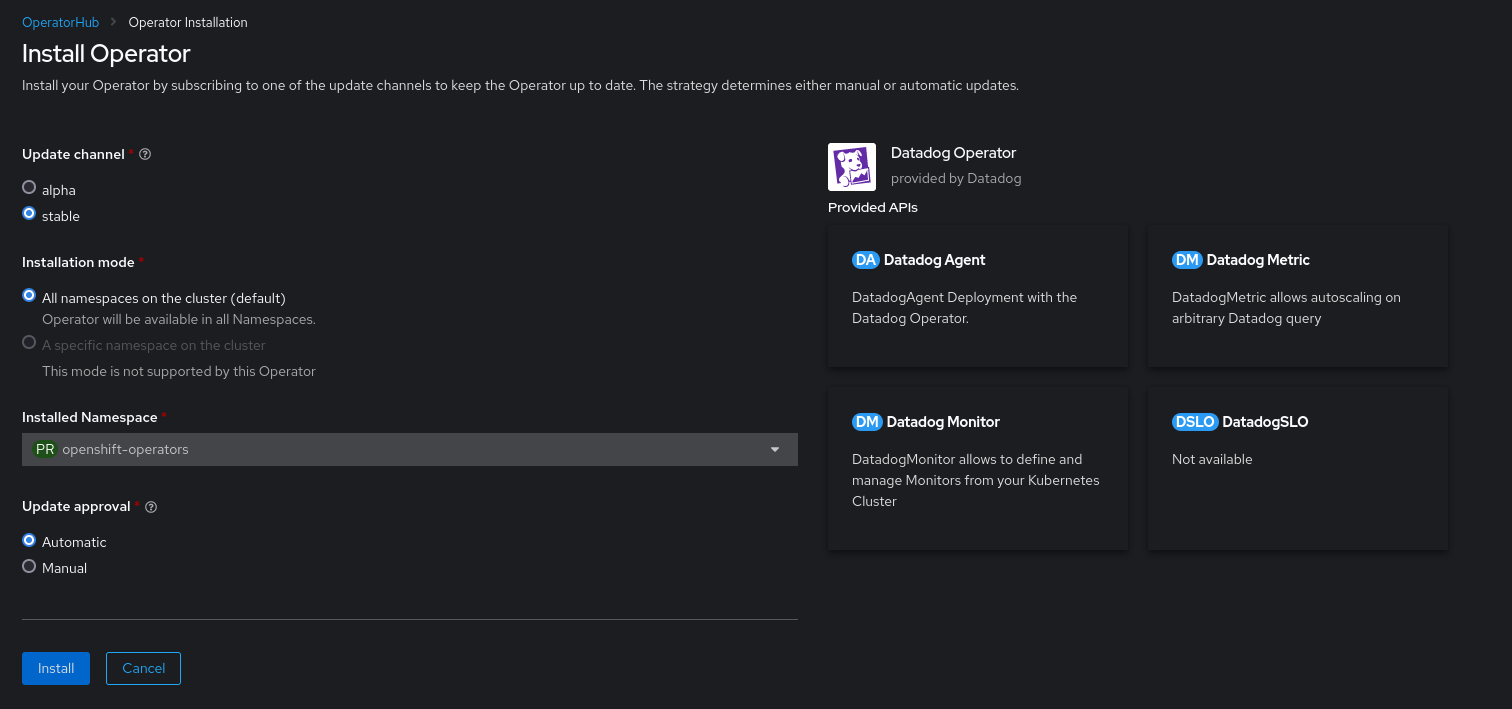
    Click Install (Figure 4).

    Datadog operator overview panel, showing some details about the operator itself
    Figure 4:
    Figure 4: Installing the Datadog Operator.

    On this screen, we will keep all the default options:

    • Update channel: stable
    • Installation mode: All namespaces on the cluster (default)
    • Installed Namespace: openshift-operators
    • Update approval: Automatic
      • If you prefer, you can use the Manual option.

    Click Install (Figure 5).

    Installation page for the Datadog Operator, showing some configurations chosen by the users, as well as the resources installed by the Operator.
    Figure 5:
    Figure 5: Settings for the Datadog Operator installation.

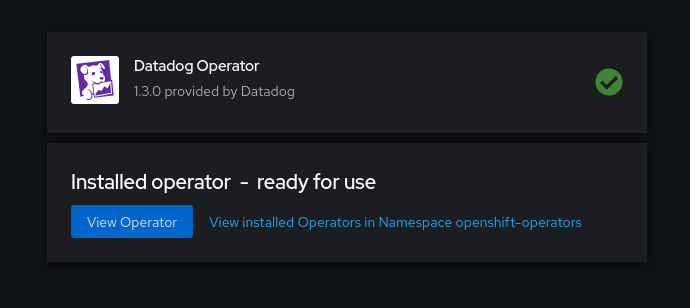
    Wait for the installation to complete (Figure 6).

    Output showing that he Datadog Operator installation has been completed
    Figure 6:
    Figure 6: The installed Datadog Operator.

    Create a secret with Datadog keys: In the terminal, access the openshift-operators namespace context.

    $ oc project openshift-operators

    Now let's create a secret to store in this API key and application key. Replace the values below with the keys we generated previously in the Datadog console:

    $ oc create secret generic datadog-secret \
    --from-literal api-key=`REPLACE_ME` \
    --from-literal app-key=`REPLACE_ME`

    Let's now instantiate our Datadog agent using the YAML below:

    $ cat <<EOF > datadog_agent.yaml
    apiVersion: datadoghq.com/v2alpha1
    kind: DatadogAgent
    metadata:
      name: datadog
      namespace: openshift-operators
    spec:
      features:
        apm:
          enabled: true
          unixDomainSocketConfig:
            enabled: true
        clusterChecks:
          enabled: true
          useClusterChecksRunners: true
        dogstatsd:
          originDetectionEnabled: true
          unixDomainSocketConfig:
            enabled: true
        eventCollection:
          collectKubernetesEvents: true
        liveContainerCollection:
          enabled: true
        liveProcessCollection:
          enabled: true
        logCollection:
          containerCollectAll: true
          enabled: true
        npm:
          collectDNSStats: true
          enableConntrack: true
          enabled: true
      global:
        clusterName: DemoLab
        credentials:
          apiSecret:
            keyName: api-key
            secretName: datadog-secret
          appSecret:
            keyName: app-key
            secretName: datadog-secret
        criSocketPath: /var/run/crio/crio.sock
        kubelet:
          tlsVerify: false
        site: datadoghq.eu
      override:
        clusterAgent:
          containers:
            cluster-agent:
              securityContext:
                readOnlyRootFilesystem: false
          replicas: 2
          serviceAccountName: datadog-agent-scc
        nodeAgent:
          hostNetwork: true
          securityContext:
            runAsUser: 0
            seLinuxOptions:
              level: s0
              role: system_r
              type: spc_t
              user: system_u
          serviceAccountName: datadog-agent-scc
          tolerations:
          - operator: Exists
          - effect: NoSchedule
            key: node-role.kubernetes.io/master
    EOF 

    Some explanations about what we are enabling in this agent are provided below.

    Enabling the Application Performance Monitoring (APM) feature:

    apm:
      enabled: true
      unixDomainSocketConfig:
        enabled: true

    clusterCheck extends the autodiscover function to non-containerized resources and checks if there is some integration/technology to monitor:

    clusterChecks:
      enabled: true
      useClusterChecksRunners: true

    dogstatsd is responsible for collecting custom metrics and events and sending them from time to time to a metrics aggregation service on the Datadog server.

    dogstatsd:
      originDetectionEnabled: true
      unixDomainSocketConfig:
        enabled: true

    Here we are enabling the collection of all logs (including container logs) and events generated in our cluster and sending them to Datadog.

    eventCollection:
      collectKubernetesEvents: true
    liveContainerCollection:
      enabled: true
    liveProcessCollection:
      enabled: true
    logCollection:
      containerCollectAll: true
      enabled: true

    With network performance monitoring (NPM), we can have visibility of all traffic in our cluster, nodes, containers, availability zones, and etc.

    npm:
      collectDNSStats: true
      enableConntrack: true
      enabled: true

    In the credentials block in Global, we have the definition of the secret previously created with the API and APP key.

    credentials:
      apiSecret:
        keyName: api-key
        secretName: datadog-secret
      appSecret:
        keyName: app-key
        secretName: datadog-secret

    In this block, we define the path to the CRI-O service socket, we define the non-checking of TLS for communication with the kubelet and in website, we define which Datadog server will receive the data sent.

    criSocketPath: /var/run/crio/crio.sock
    kubelet:
      tlsVerify: false
    site: datadoghq.eu

    In the clusterAgent block in override, we add securityContext (scc) settings and which serviceaccount should be used in the datadog-cluster-agent pods.

    clusterAgent:
      containers:
        cluster-agent:
          securityContext:
            readOnlyRootFilesystem: false
      replicas: 2
      serviceAccountName: datadog-agent-scc
     

    Note

    The datadog-agent-scc serviceaccount is created automatically by the operator and already has all the necessary permissions for the agent to run correctly.

    In the nodeAgent block in override, we define securityContext settings for the datadog-agent pods. We will use the same datadog-agent-scc service account and also define the tolerations for the nodes that have taints created, in our case, for the primary nodes.

    nodeAgent:
      hostNetwork: true
      securityContext:
        runAsUser: 0
        seLinuxOptions:
          level: s0
          role: system_r
          type: spc_t
          user: system_u
      serviceAccountName: datadog-agent-scc
      tolerations:
      - operator: Exists
      - effect: NoSchedule
        key: node-role.kubernetes.io/master

    Now let's deploy our Datadog agent. Execute this command to create the object:

    $ oc -n openshift-operators create -f datadog_agent.yaml

    Once created, we will validate that our agent was created correctly (see Figure 7):

    $ oc -n openshift-operators get datadogagent
    $ oc -n openshift-operators get pods

    Here we should have a datadog-agent running on each available OpenShift node.
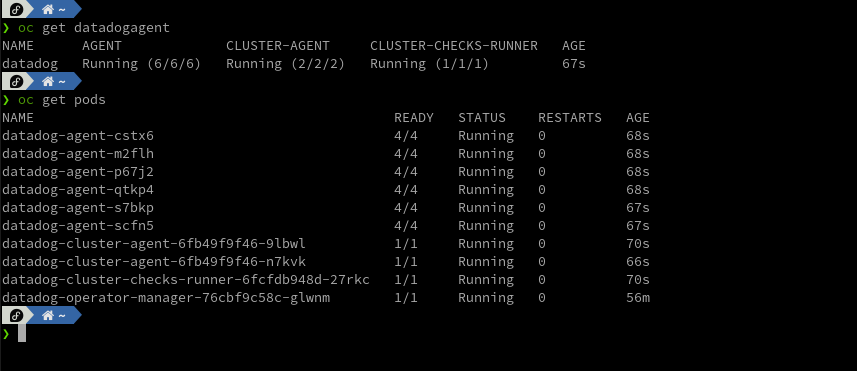
    Output showing all Datadog pods created by the operator
    Figure 7:
    Figure 7: Check for the running Datadog agent.

    Note:

    • datadog-agent-xxxxx pods are responsible for collecting all metrics, events, traces and logs from each node in the cluster.
    • datadog-cluster-agent-xxxxx pods will act as a proxy between the API server and node-based agents, Cluster Agent helps to ease the server load.

    Now let's validate the logs of the datadog-agent-xxxxx pods to identify if there is any communication error (Figure 8):

    $ oc logs -f -l app.kubernetes.io/managed-by=datadog-operator --max-log-requests 10
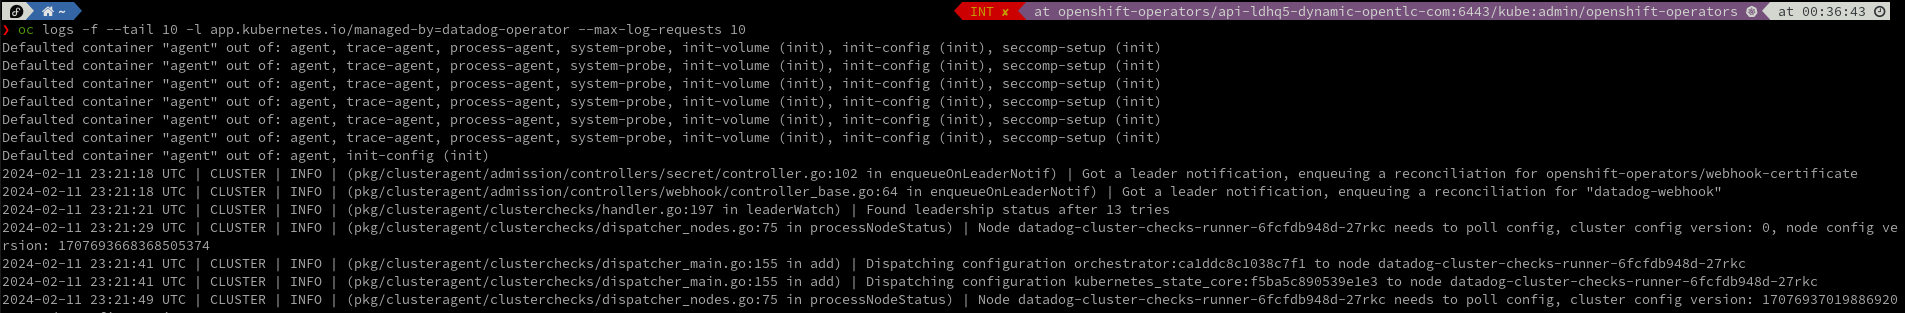
    Output showing the logs of all of pods
    Figure 8:
    Figure 8: Validating the datadog-agent-xxxxx pod logs.

    Now on the Datadog platform, in the left side menu, click Infrastructure > Infrastructure List.
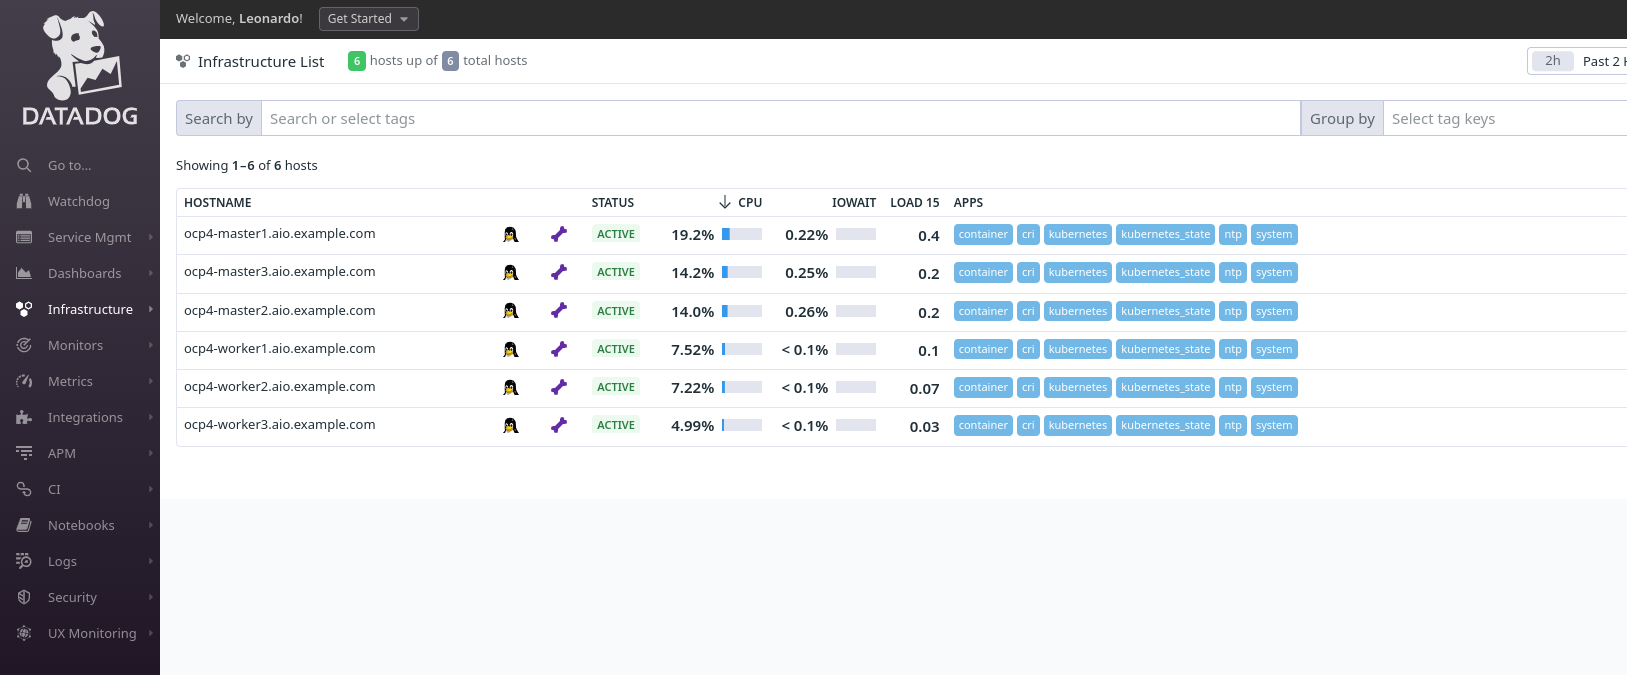
    Visualisation in the Datadog platform focused on the Infrastructure list, which shows the hosts being monitored by Datadog
    Figure 9:
    Figure 9: Nodes shown in the Infrastructure list.
     

    Info alert: Note

    Server data, such as status, CPU information, memory and other details, might take a few minutes to display.

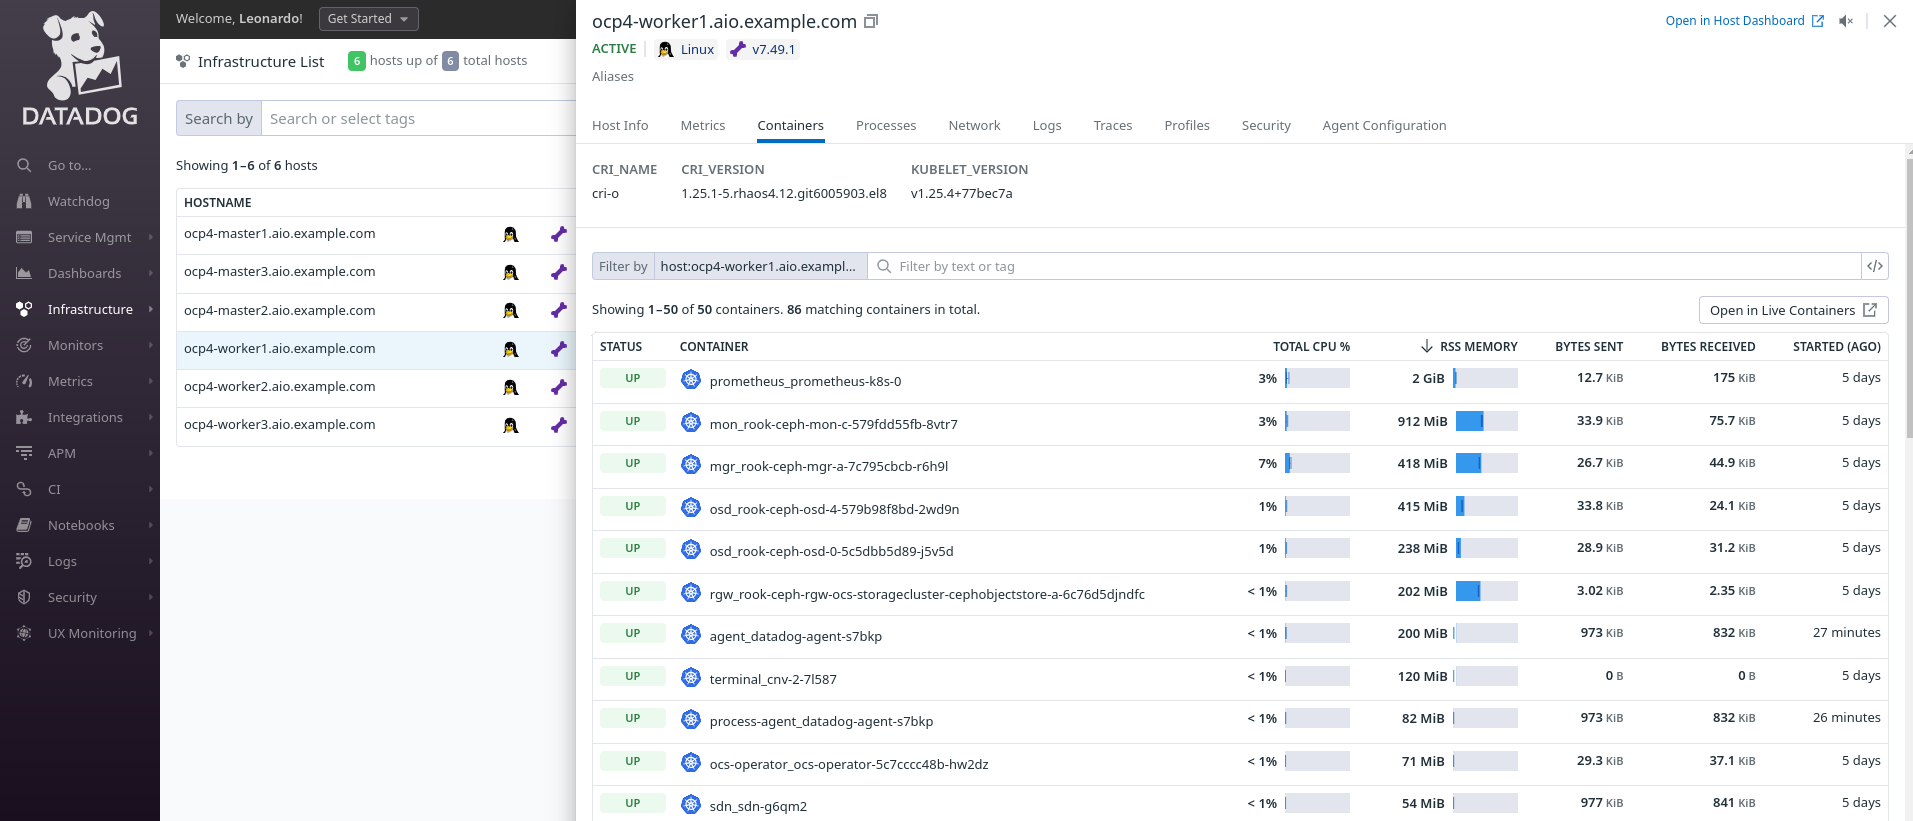
    To view more details about a specific node, click on the node name and navigate through the available tabs (Figure 10). It’s just the simple way to check your nodes/hosts.

    Host's side panel showing detailed information about the specific host, we can see all the containers running inside it
    Figure 10:
    Figure 10: Viewing node details.

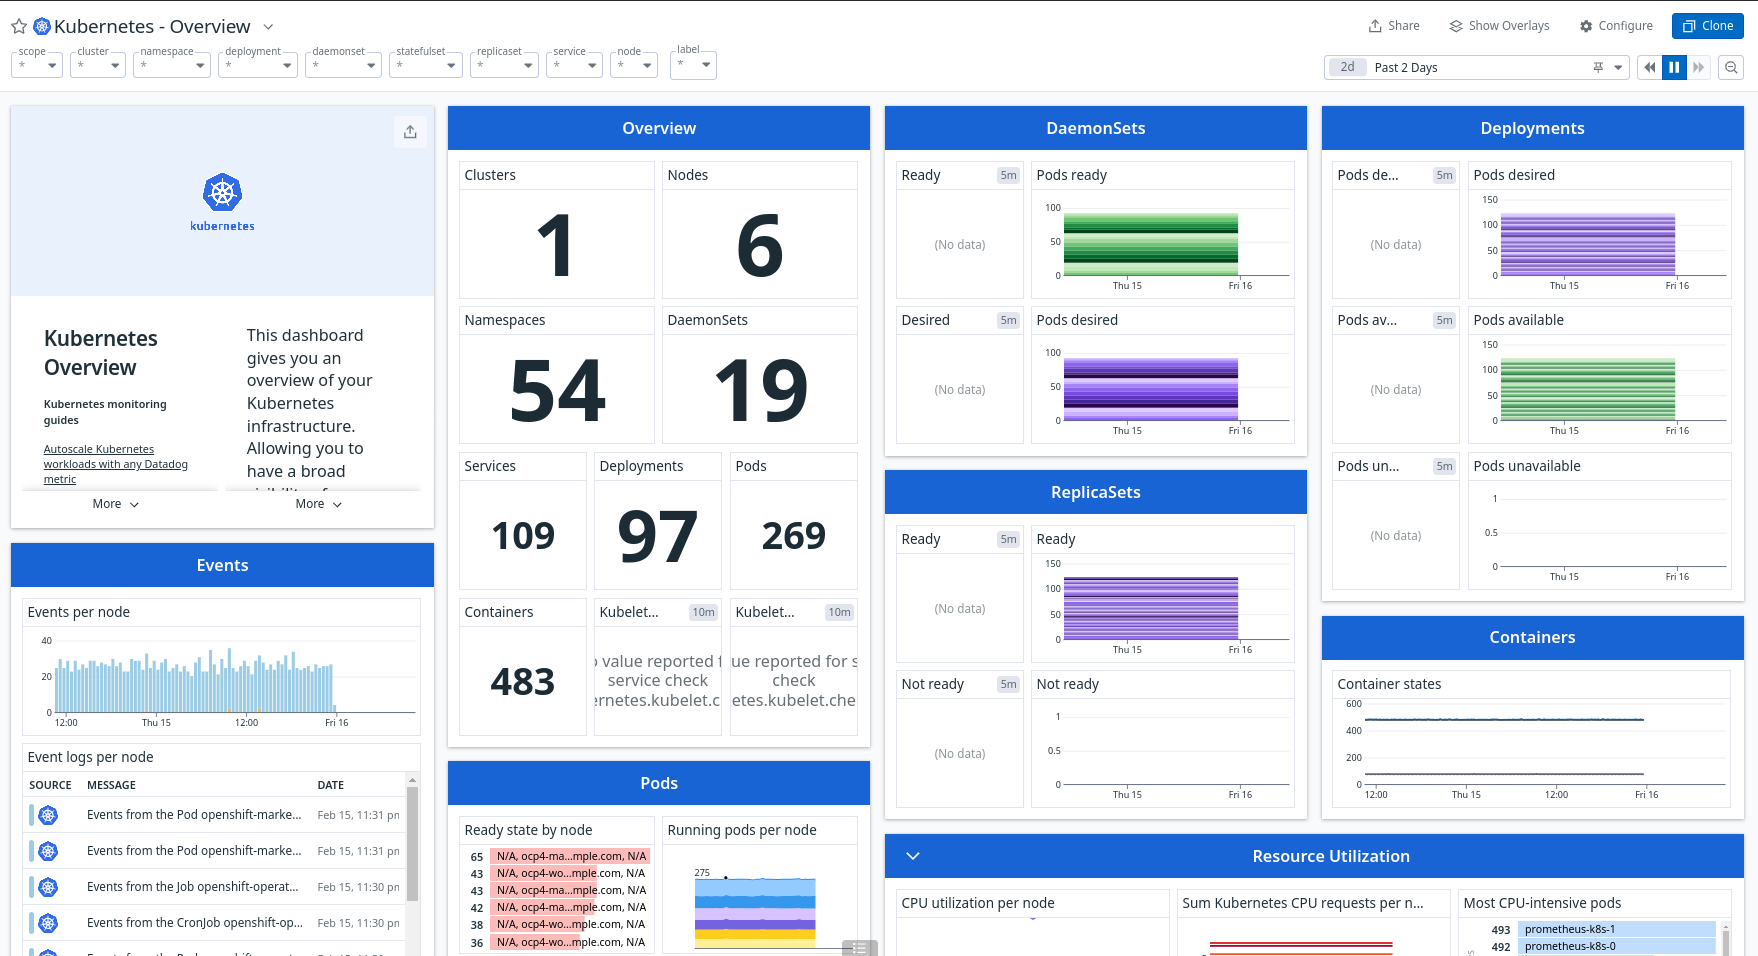
    Under the Infrastructure menu, Datadog also gives you an exclusive Kubernetes menu that provides the full picture about your cluster. You can check the state of all of your Kubernetes resources, troubleshoot patterns, access out-of-the-box Dashboards and enable some recommended Alerts to monitor your environment. 

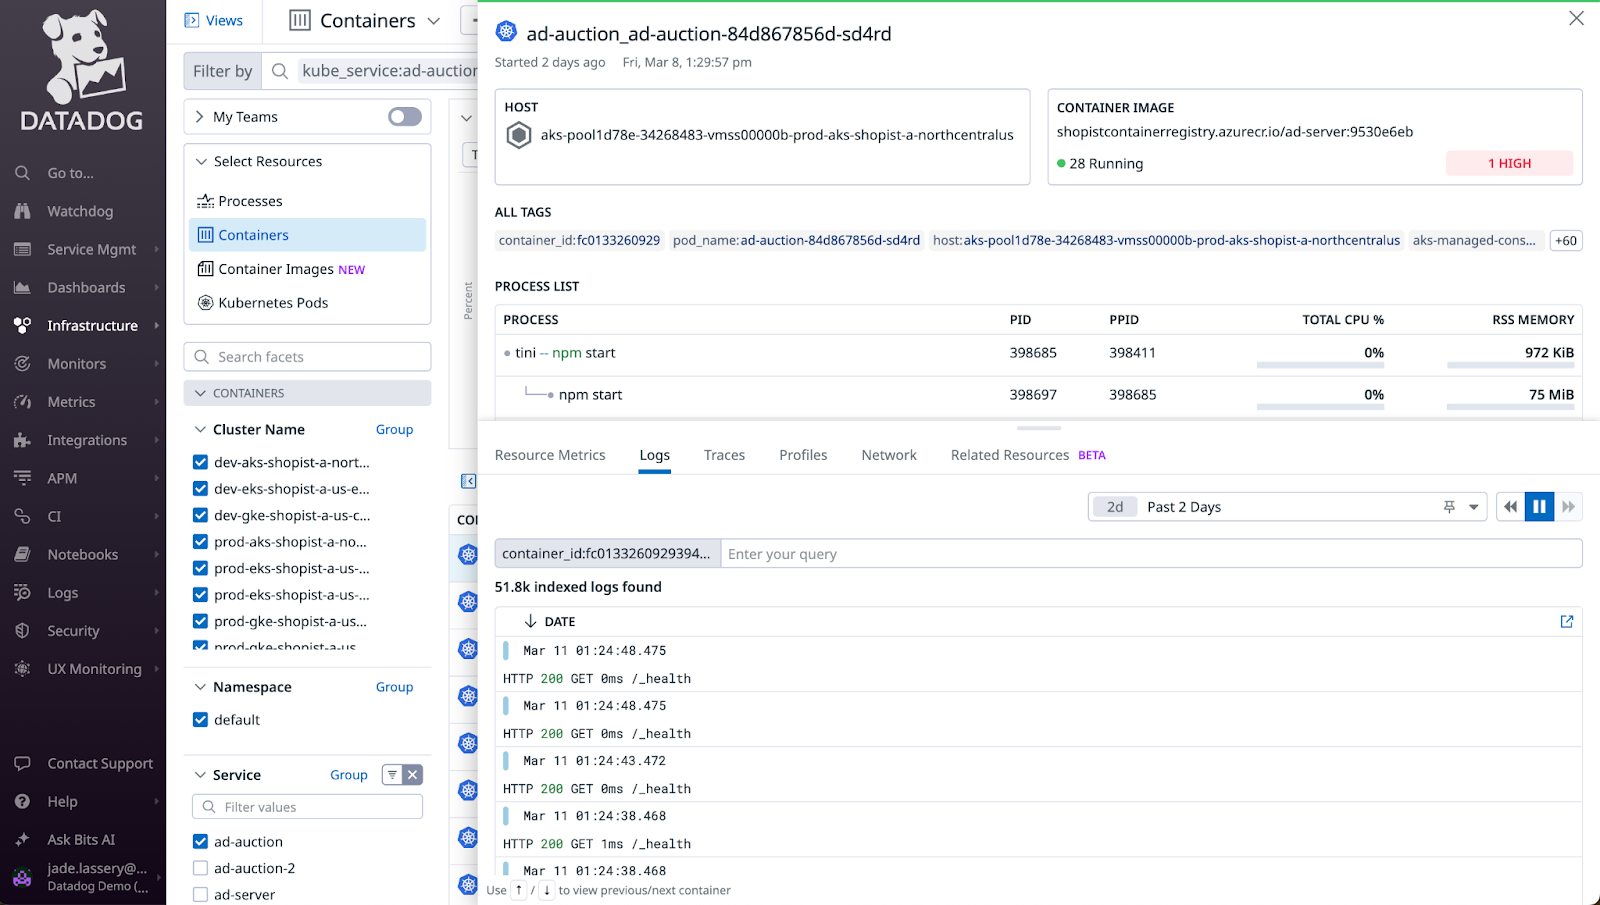
    You can also explore deeper the containers running in your OpenShift environment by going to Infrastructure > Containers. Here you get a chance to analyze things like logs from containers, traces, networking layer, processes running inside the container, and so on. See Figure 11.

    Container's side panel showing detailed information about a specific container, we can see the containers data, system's processes running inside and all logs associated with that container
    Figure 12:
    Figure 12: Get information about the running containers in your OpenShift environment.

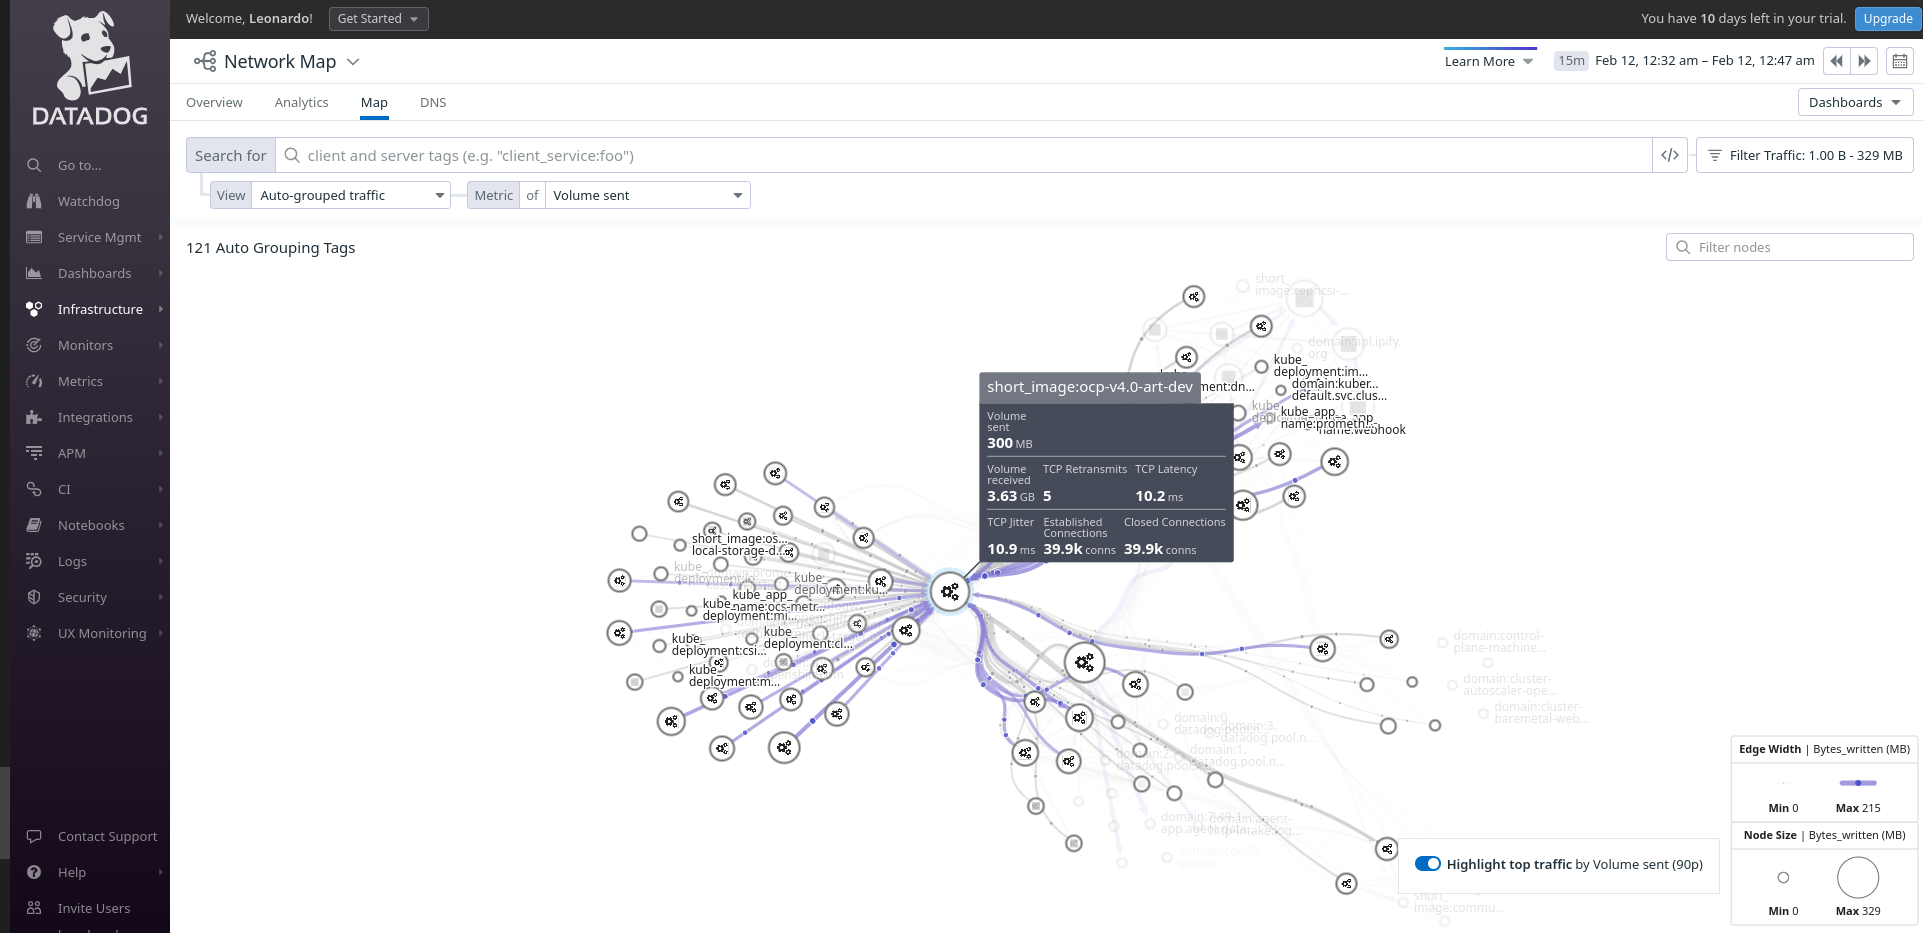
    To view more details about network traffic, in the left side menu, go to Infrastructure > Network Map (Figure 13).

    Infrastructure Monitoring, in that case the Network mapping is on evidence.
    Figure 13:
    Figure 13: Get details about network traffic in Datadog.

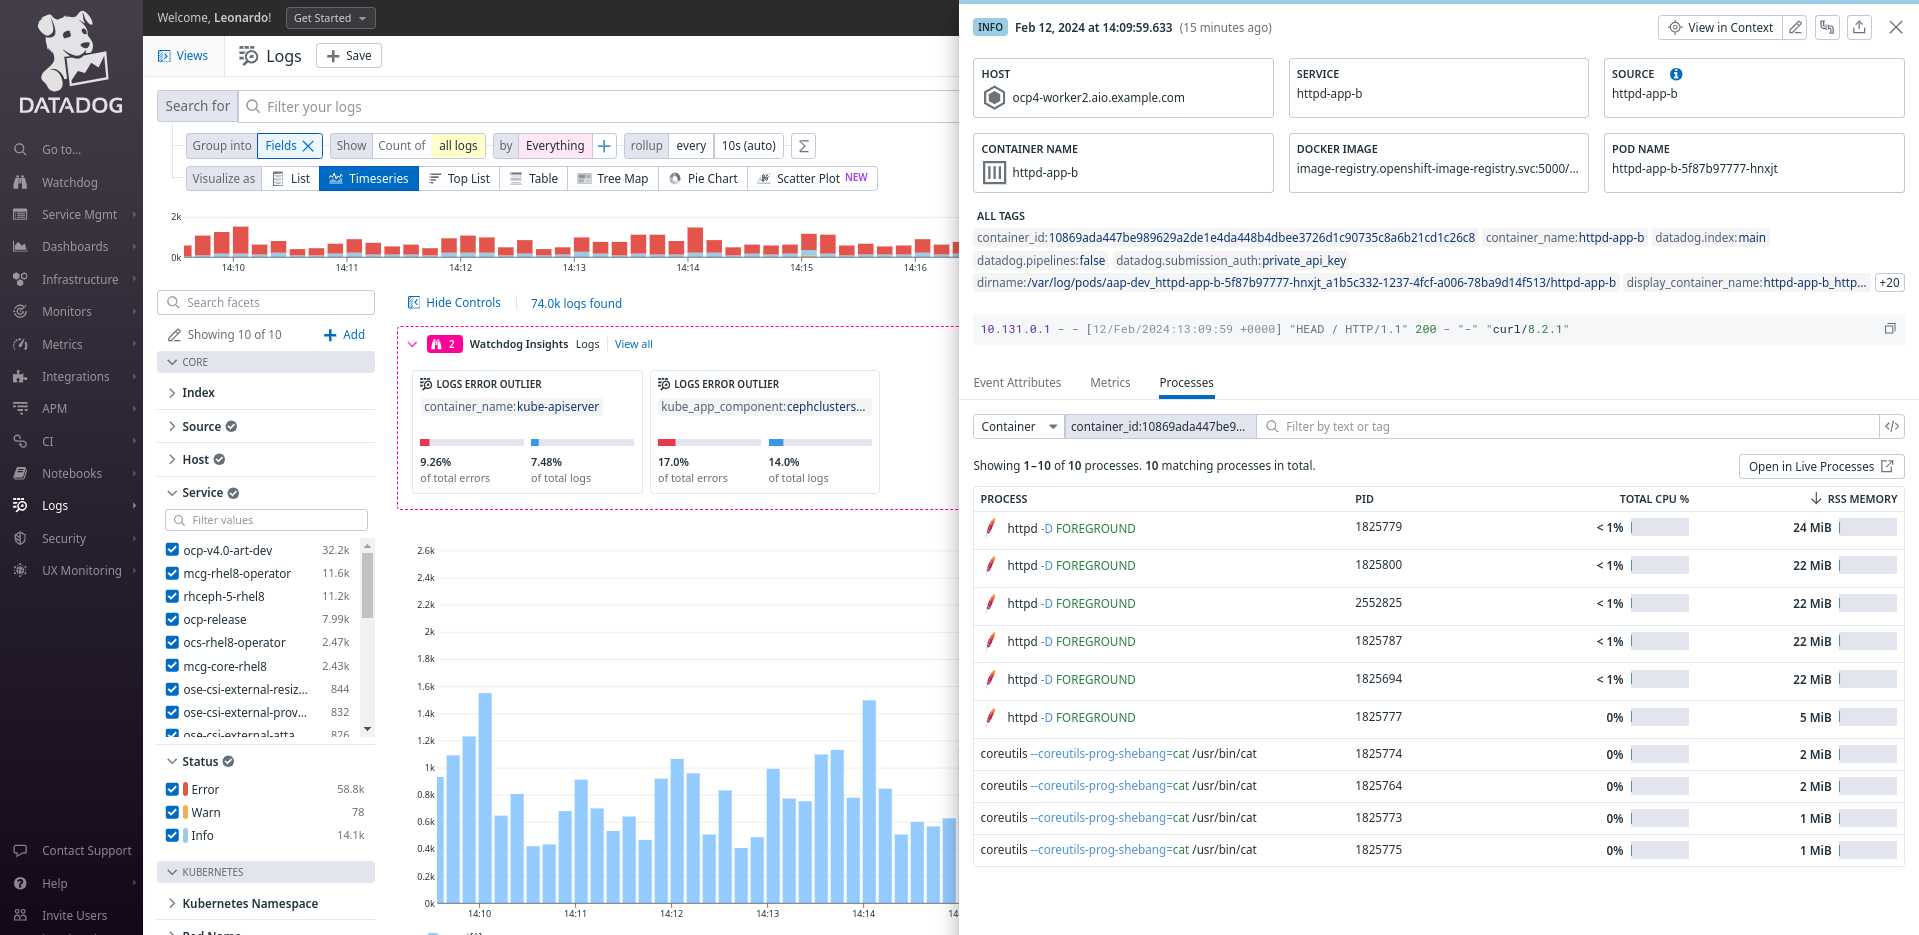
    To view the logs received from the cluster or from any application or technology running in your Kubernetes environment, in the left side menu, go to Logs > Analytics. On this screen, we can view all the details, filter application logs, and even view the processes.

    Datadog Logs Explorer, with a specific log's side panel opened showing many advanced details about that log, highlighting the system's processes associated with that log
    Figure 14:
    Figure 14: Viewing application logs in Datadog.

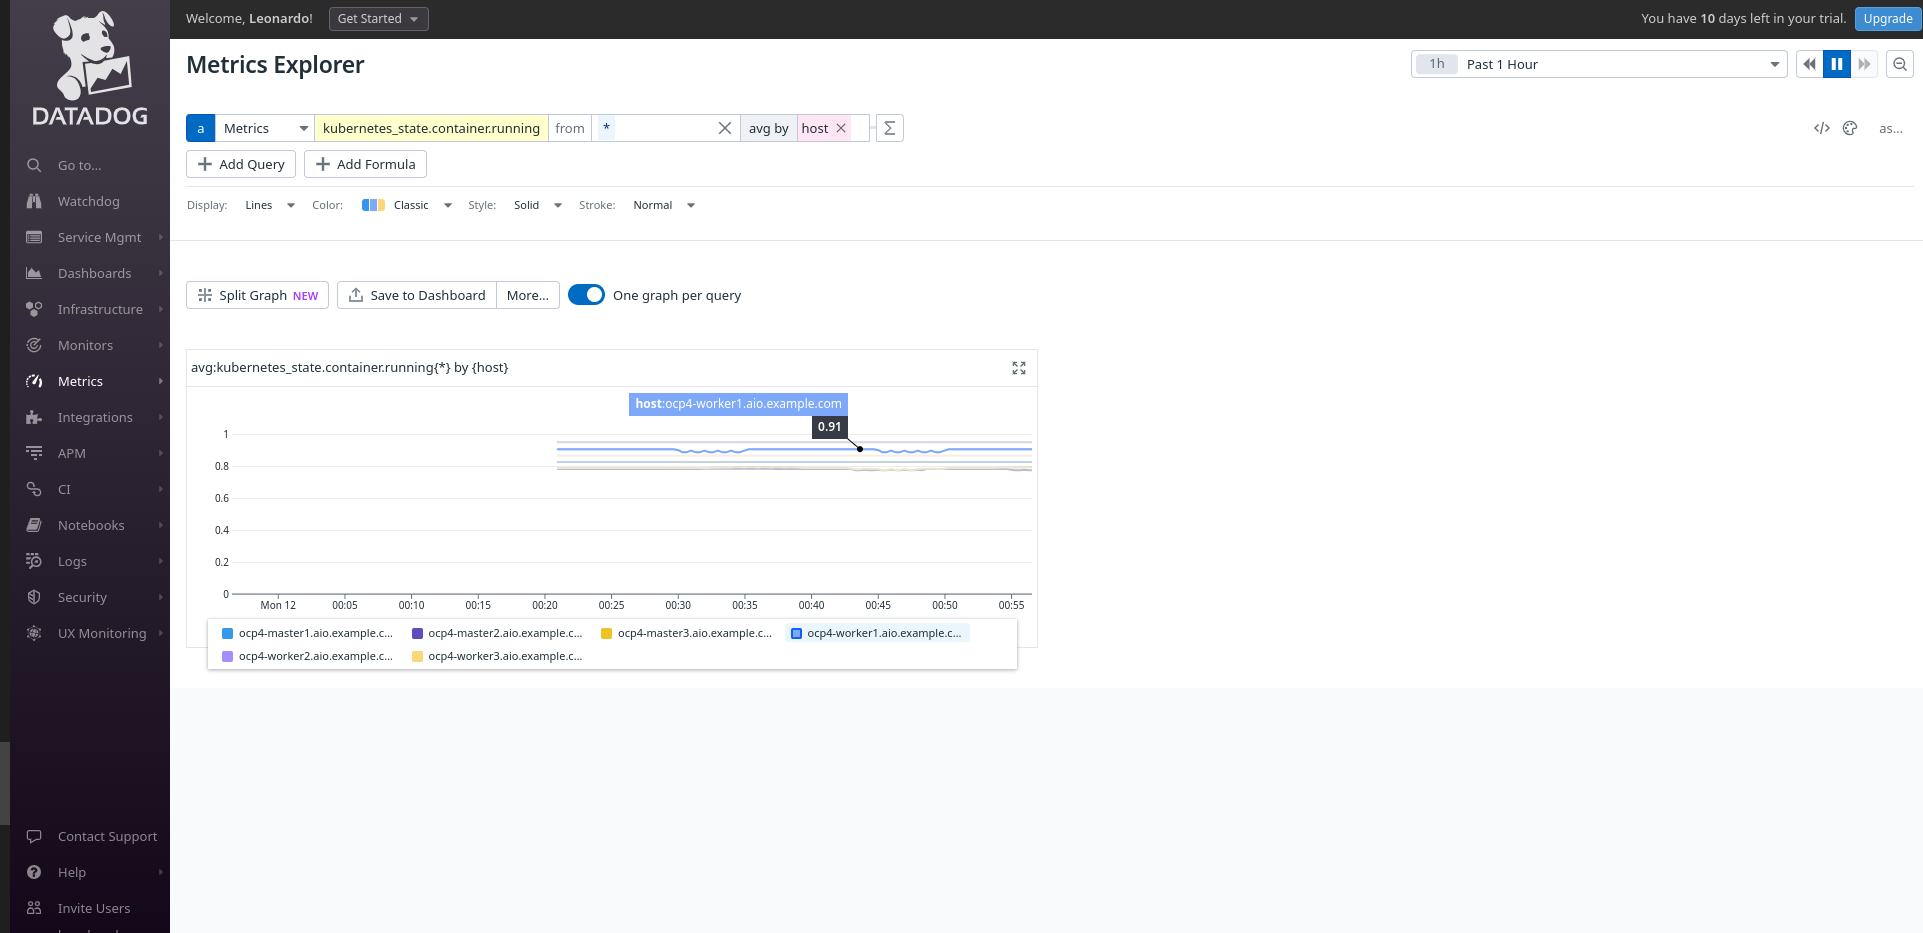
    To view all collected metrics, in the left side menu, go to Metrics > Explorer. Here we can view all metrics, run and save queries or create dashboards based on queries.

    Metrics explorer menu showing the historical data for an specific metrics chosen
    Figure 15:
    Figure 15: The Datadog Metrics Explorer.

    Datadog provides out-of-the-box Dashboards that can be used and customized. To use one available, go to Dashboards > Dashboard List in the left-side menu, choose the dashboard, and click on the name.

    Kubernetes Overview Dashboard showing many different data from the Kubernetes environment
    Figure 16:
    Figure 16: Viewing the Datadog dashboard list.
     

    Info alert: Note

    To customize a dashboard provided by Datadog, use the Clone feature to make the desired changes and save.

    Conclusion

    Using the Datadog Operator solution, we can have a complete monitoring solution for our OpenShift cluster with main features such as APM, network analysis, logs, events, and metrics.

    • Request an OpenShift trial and learn more about our solution.
    • Request a Datadog trial to replicate this knowledge.
     

    Info alert: Note

    Red Hat does not support the Datadog Operator or its configuration. For any questions related to the use of the platform or the operator, contact Datadog.

    References

    For more details and other configurations, start with these reference documents:

    • Red Hat Catalog - Datadog Operator
    • Datadog Documentation - OpenShift
    • Datadog Documentation - Advanced setup for Datadog Operator
    • Custom Datadog SCC for all features

    Related Posts

    • How can I run OpenShift on my own computer for development?

    • What is the difference between OpenShift and Kubernetes?

    • How to manage a fleet of heterogeneous OpenShift clusters

    • Monitor Node.js applications on Red Hat OpenShift with Prometheus

    • Network observability using TCP handshake round-trip time

    • Network observability with eBPF on single node OpenShift

    Recent Posts

    • Create and enrich ServiceNow ITSM tickets with Ansible Automation Platform

    • Expand Model-as-a-Service for secure enterprise AI

    • OpenShift LACP bonding performance expectations

    • Build container images in CI/CD with Tekton and Buildpacks

    • How to deploy OpenShift AI & Service Mesh 3 on one cluster

    What’s up next?

    Get a hands-on introduction to daily life as a developer crafting code on OpenShift, the open source application development platform from Red Hat, with OpenShift for Developers.

    Dive deeper into OpenShift
    Red Hat Developers logo LinkedIn YouTube Twitter Facebook

    Products

    • Red Hat Enterprise Linux
    • Red Hat OpenShift
    • Red Hat Ansible Automation Platform

    Build

    • Developer Sandbox
    • Developer Tools
    • Interactive Tutorials
    • API Catalog

    Quicklinks

    • Learning Resources
    • E-books
    • Cheat Sheets
    • Blog
    • Events
    • Newsletter

    Communicate

    • About us
    • Contact sales
    • Find a partner
    • Report a website issue
    • Site Status Dashboard
    • Report a security problem

    RED HAT DEVELOPER

    Build here. Go anywhere.

    We serve the builders. The problem solvers who create careers with code.

    Join us if you’re a developer, software engineer, web designer, front-end designer, UX designer, computer scientist, architect, tester, product manager, project manager or team lead.

    Sign me up

    Red Hat legal and privacy links

    • About Red Hat
    • Jobs
    • Events
    • Locations
    • Contact Red Hat
    • Red Hat Blog
    • Inclusion at Red Hat
    • Cool Stuff Store
    • Red Hat Summit
    © 2025 Red Hat

    Red Hat legal and privacy links

    • Privacy statement
    • Terms of use
    • All policies and guidelines
    • Digital accessibility

    Report a website issue