Red Hat Quay (also offered as a service via Quay.io) is a cloud-based container registry service that allows users to store, manage, and distribute container images. It provides a platform for hosting, sharing, and securing container images across multiple environments, including on-premise data centers, public cloud platforms, and hybrid cloud deployments.
As a complementary subproduct, Clair is an application specifically designed for parsing image contents and delivering reports on vulnerabilities that may impact these contents. Noteworthy is that this analysis is conducted through static analysis rather than at runtime. Clair excels in supporting the extraction of contents and the identification of vulnerabilities, enhancing the overall security and reliability of containerized applications.
As organizations increasingly rely on robust containerization solutions, the demand for scalable and efficient platforms for sharing and distributing container images becomes paramount. The performance and scale of our solutions are of the utmost importance here at Red Hat, and we continually formulate test plans, design tools, and execute extensive testing to be sure that our products and services meet the scalability rigors that our customers expect. As a part of that journey, we will delve into the details of how the performance and scale team approached specific research questions from the development teams with the intent of improving the scalability and cost effectiveness of the solution.
Research question 1
The Quay team noticed more database activity, and a spike in average database connections hinting at potential issues or unnecessary costs. To address this, we created a robust load testing solution. It helps us understand and improve how the system handles loads, providing efficiency and cost-effectiveness in the current database setup.
In their own words: "We're exploring load testing options for Quay and reassessing our database costs looking for optimization opportunities."
Backstory
The observed increase in average database connections had prompted the Quay team to seek a solution that not only addresses the immediate load testing requirements but also provides optimal resource utilization and cost-effectiveness.
Research question 2
The Clair team, a vital subteam of Quay, had identified a specific performance bottleneck within their system. They expressed interest in obtaining low-level profiling data for both the application and their database. The motivation behind this request was the high latency experienced in the Clair Index Report API.
In their own words: "We are interested in low-level profiling data for both application and their DB to identify the areas that need improvements."
Backstory
The Clair team's focus on obtaining low-level profiling data was driven by the imperative need to identify and address performance bottlenecks, particularly the observed high latency in the Clair Index Report API. This responsive approach aims to enhance the overall efficiency of the Clair project.
Proposed solutions
In the subsequent sections of this article, we will explore potential solutions to address the load testing needs of the Quay team and provide insights into low-level profiling for the Clair team. By doing so, we aim to provide a behind-the-scenes look into how we optimize Red Hat solutions, and to be sure they not only meet but exceed performance expectations set by the Quay quality engineering team while maintaining stability and cost-effectiveness. Stay tuned as we delve into strategies and best practices to tackle these challenges head-on.
Product overview
Quay
Quay, as a robust container registry solution, offers two distinct deployment methods tailored to meet varying needs:
-
Quay.io deployment
-
Quay product (self-managed Quay)
- This option allows organizations to deploy their own version of Quay as a self-managed private registry using the quay-operator on their own OpenShift cluster.
- Refer to the official documentation here.
- Important note: Before deploying the Quay registry on your cluster, it is essential to execute specified hack scripts once the OpenShift ODF (Object Data Framework) operator is deployed. These scripts, outlined here, play a pivotal role in setting up local storage using the operator as a gateway. It's worth noting that this step is not explicitly mentioned in the operator documentation.
Clair (subsystem of Quay)
Clair is an application for parsing image contents and reporting vulnerabilities affecting the contents. This is done via static analysis and not at runtime. Clair supports the extraction of contents and assignment of vulnerabilities from the following official base containers:
- Ubuntu
- Debian
- Red Hat Enterprise Linux (RHEL)
- Suse
- Oracle
- Alpine
- AWS Linux
- VMWare Photon
- Python
The above list defines Clair's current support matrix. More details on architecture: https://quay.github.io/clair/whatis.html#architecture
While the Quay/Clair architecture provides valuable application-level metrics extracted from the platform’s Prometheus for post-production monitoring, a notable challenge still persists. These metrics primarily address issues after deployment, offering reactive solutions rather than proactive insights. This gap underscores the need for tools and strategies that enable organizations to foresee challenges before the production release.
Gearing up to test
As we started testing in the Quay/Clair ecosystem, we took a thoughtful approach to create a strong foundation for thorough assessments. To make testing simpler, we decided to make our tools specifically for the quay-operator i.e., on-premise settings. We chose on-premise because it's versatile, letting us easily use the same tools for Quay.io since they have similar endpoints. Below are the types of tools and some key performance indicators that we used for initial testing.
Load testing tools
Quay performance scripts: https://github.com/quay/quay-performance-scripts
Clair load tests: https://github.com/quay/clair-load-test
Both of these tools employ vegeta as an HTTP benchmarking tool in the background. It makes requests to the specific endpoints of the application, simulating end-to-end tests of functionality. The results are then presented in the form of key performance indicators, including latencies, throughput, and HTTP status codes. More in depth instructions to play around with those tools can be found in their corresponding README.mds.
In-cluster monitoring tool: https://github.com/cloud-bulldozer/performance-dashboards/tree/master/dittybopper
Initial test results and observations
After performing an initial round of testing on Quay using the load testing setup, we noticed a few things:
- 502 errors due to CPU throttling in the Quay App (Figure 1).
nginx stdout | 2023/05/03 16:30:18 [error] 104#0: *7208 connect() to unix:/tmp/gunicorn_web.sock failed (11: Resource temporarily unavailable) while connecting to upstream, client: 10.131.0.7, server: , request: "PUT /api/v1/repository/test/9d19_repo_60/permissions/user/9d19_user_68 HTTP/1.1", upstream: "http://unix:/tmp/gunicorn_web.sock:/quay-registry/static/502.html", host: "example-registry-quay-quay-enterprise.apps.vchalla-quay-test-3.perfscale.devcluster.openshift.com"
- We also checked the in-cluster metrics for these tests and made note of a few observations.
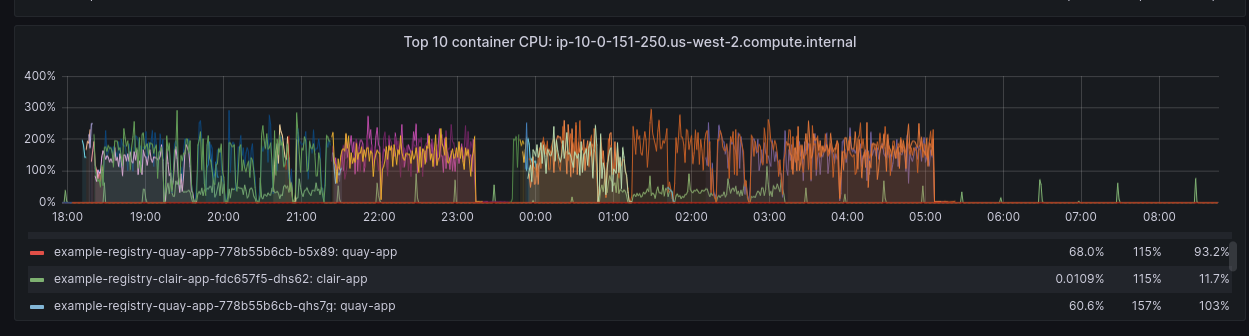
The above two observations are related to each other. Because of a 2-core CPU hard limit on quay app pods, we were seeing those HTTP 502 errors indicating application unavailability. As you can see above, Quay app pods were chewing up all the allocated CPU, leaving no room for additional incoming requests.
In addition to the previously mentioned issues, we also observed two more metrics exhibiting similarly anomalous behavior. These are shown in Figures 2 and 3.
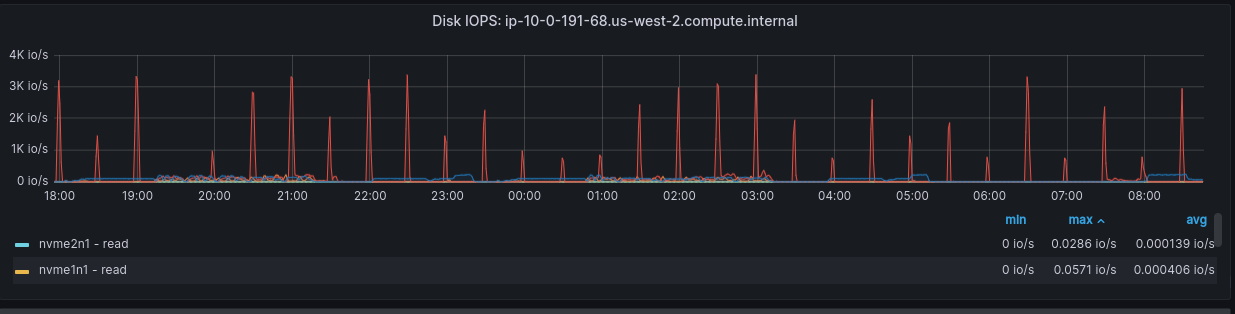
The metric above reveals spikes in Disk IOPS, nearly reaching the maximum limit of the mounted volume at 3K. This suggests periodic intensive activity within the Clair database, warranting further investigation.
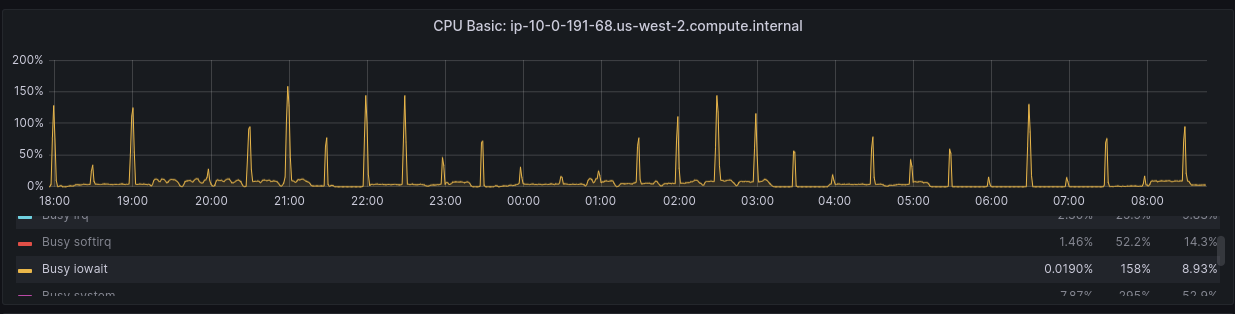
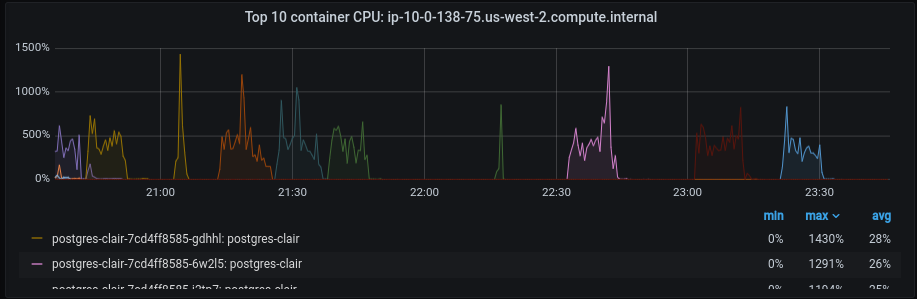
The CPU usage trend of the Clair app as observed in its iowait time aligns with the recurring spikes observed in the Clair database, signaling a consistent pattern. This strongly suggests that the intensive activity within the Clair database is directly impacting the performance of the Clair app.
Action items based on initial observations
Upon analyzing the initial test results, it became apparent that both the Quay application pods and Clair DB Disk IOPS faced restrictions. To identify the root cause, we took the following actions:
- Increased Clair Disk IOPS to 6000 from 3000: The intention was to double the Disk IOPS i.e one of the aws gp3 volume settings to assess if it would improve performance. Unfortunately, despite the increase, the periodic spikes persisted in the database, and other metrics remained unchanged.
- Increased Quay app pods CPU limit to 6 cores from 2 cores: This adjustment aimed to accommodate more incoming requests and showed some improvement in performance. However, considering the potential increase in resource costs, we have decided to explore alternative options.
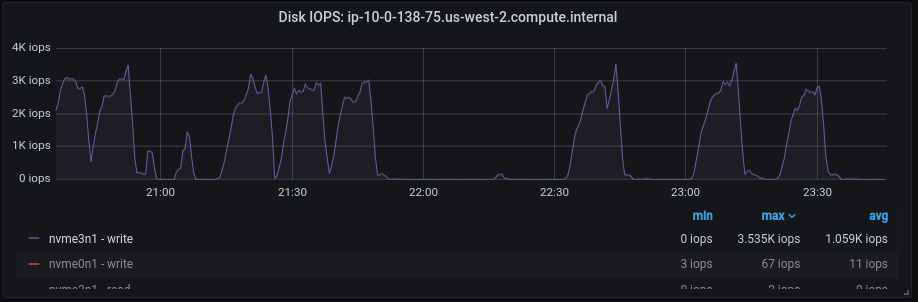
Throughout these experiments, one metric remained constant–Clair DB Disk IOPS, impacting the performance of the Clair app. Figures 4 and 5 depict this.
To delve deeper, we decided to conduct database profiling. Stay tuned for the continuation in the second part of this article, where we will explore the results of our database profiling efforts and discuss strategies for optimizing the overall application’s performance.
Last updated: March 21, 2024