Welcome to the second part of our exploration. In this continuation from our previous article, we will delve deeper into the results of our database profiling efforts and discuss strategies for further optimizing overall application performance.
Profiling results before optimization for Clair database
To gain insights into the inner workings of the Clair database, we conducted profiling using the pgBadger tool, specifically designed for PostgreSQL. This tool extracts information from the database logs and generates a comprehensive HTML report for result analysis. Through profiling, we identified that the recurrent spikes are attributed to bulk updates executed on the database, specifically around 10,000 updates by the updater, a sub-component of Clair that is responsible for maintaining an updated view containing the latest list of vulnerabilities. These vulnerabilities are sourced from trusted remote entities referred to as matchers. Here are a few key observations from the profiling process:
- Examining the Entity-Relationship model of the database, we observed that the tables listed below have the highest number of rows and undergo intensive operations during the occurrences of those updates on the database.
table_name                | total_size      |  row_count
--------------------------|-----------------|-----------------
enrichment                | 89145344        |   131558
uo_enrich                 | 26337280        |   263187
uo_vuln                   | 1271250944      |   9.402272e+06
vuln                      | 9406947328      |   6.381969e+06
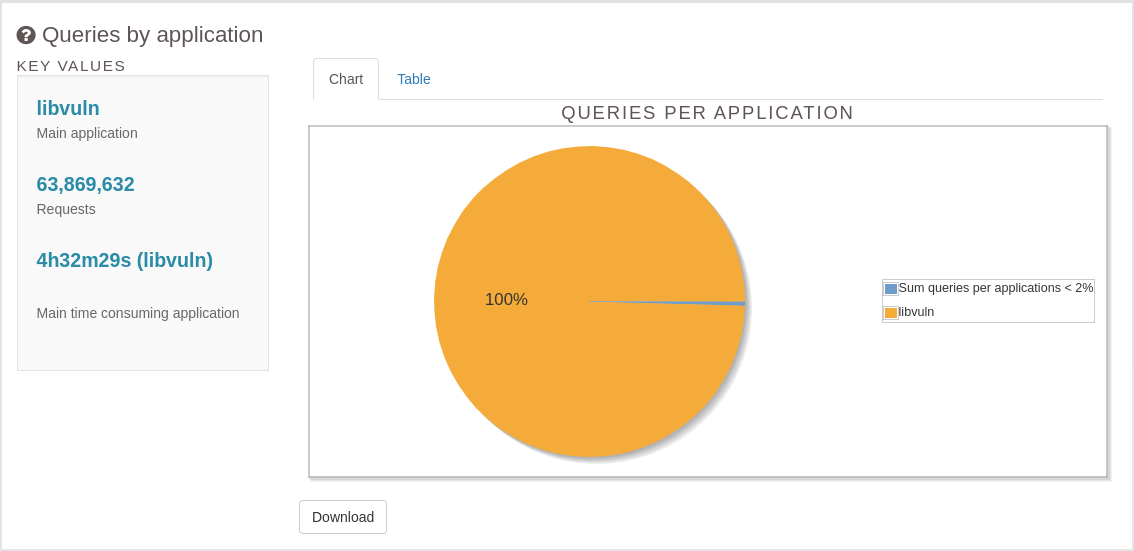
- Furthermore, during instances of a spike in the database activity, our observation revealed that 99% of the queries were initiated by libvuln, the application name of updater. See Figure 1.
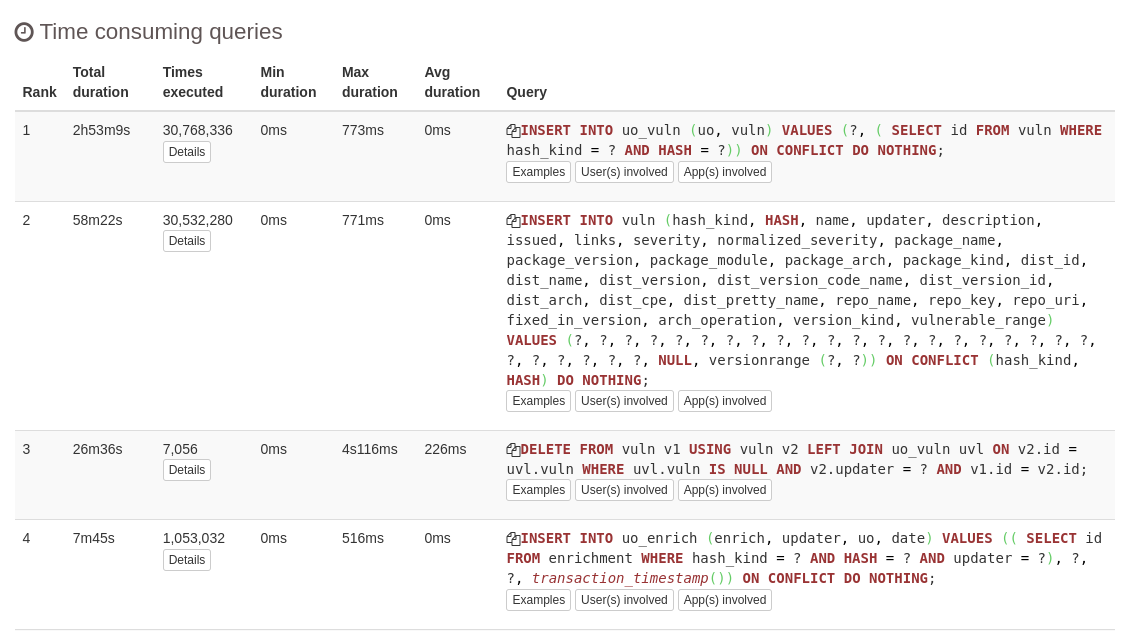
For a more in-depth investigation, we examined the most time-consuming query templates, and the following (Figure 2) are the top four along with their corresponding statistics.
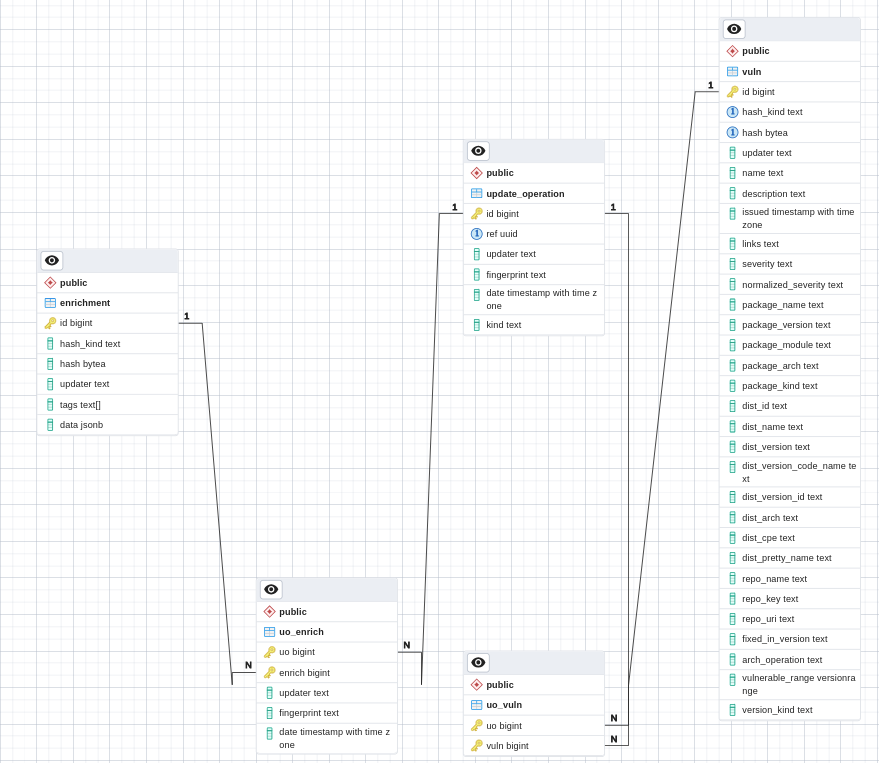
Another noteworthy observation is that the aforementioned time-consuming queries are executed on tables housing the highest number of rows in the attached Entity-Relationship model. These tables are entirely isolated from the rest in the Entity-Relationship diagram. This is shown in Figure 3 below.
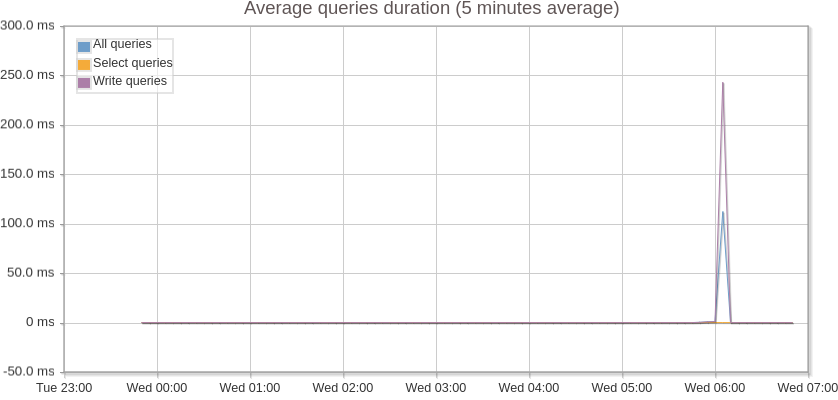
And finally below (Figure 4 and 5) are a few performance metrics of the database due to these periodic spikes.
Approach 1
Considering all the observations mentioned earlier, our initial approach was to consider potentially migrating the sizable tables, which are segregated in the Entity-Relationship model and execute resource-intensive queries, to a column-store database. In traditional relational databases, queries scan row by row, making the process time-consuming and resource-intensive, especially when dealing with billions of rows. In contrast, a column-store database allows the implementation of partitioning, indexing, and sharding, supporting parallel queries and accelerating results in a distributed setting. Additionally, since these intensive queries run periodically (every 6 hours), it aligns well with the Online Analytical Processing (OLAP) use case, for which column-store databases are particularly suitable.
However, maintaining an additional database poses operational challenges. Alternatively, flattening all the data introduces trade-offs, including data duplication and increased maintenance. Consequently, we opted to explore improvement opportunities within our existing database, the settings for which are described below in the subsequent section.
Approach 2
While investigating other improvement opportunities, we noticed that Clair executed a lot of individual INSERT/UPDATE/DELETE queries on top of their database using the github.com/jackc/pgx/v4 GO library. It's commonly assumed that sending multiple queries as a batch would result in automatic optimized execution by the library. To verify if this was correct, we have transformed one of most time consuming query templates into a single bulk query string and fed it as an input to the library to see if there are any performance improvements. Following are the POCs on this idea.
- GitHub issue: https://github.com/quay/claircore/issues/995
- GitHub PR: https://github.com/quay/claircore/pull/996
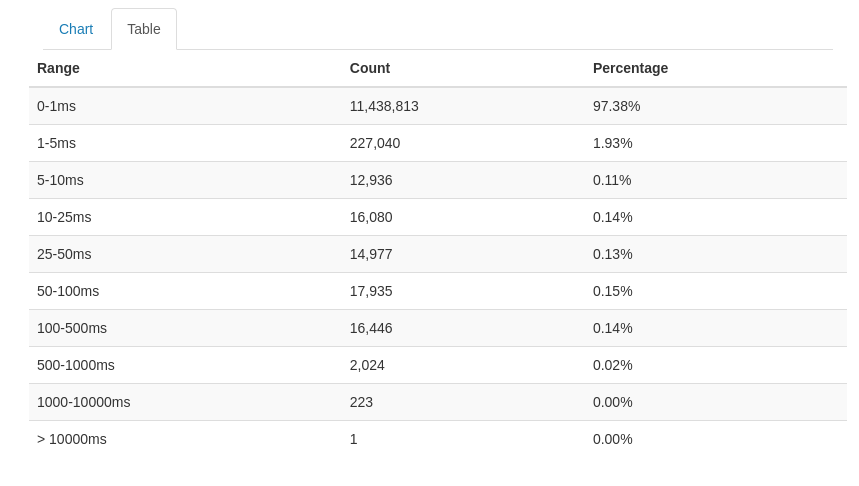
Profiling results after optimization for Clair database
After applying these changes, we noticed a significant performance improvement in the application. Below are the screenshots for those metrics (Figure 6 and Figure 7).
Average query execution time got reduced from 250 ms to 2.5 ms which is a 100 fold difference.
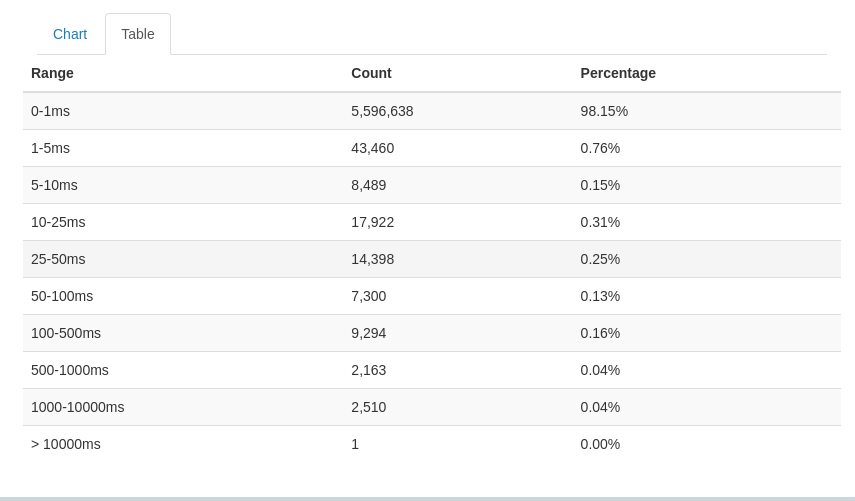
The amount of queries got reduced by half which saves a lot of resources spent on opening and closing database connections.
Also, here are some of the performance metrics of Clair app and database (Figures 8-10).
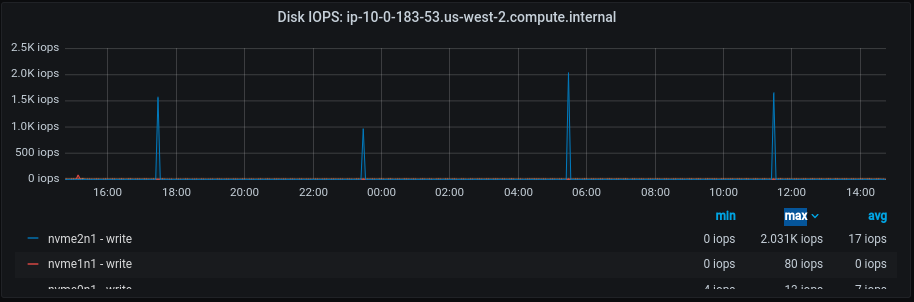
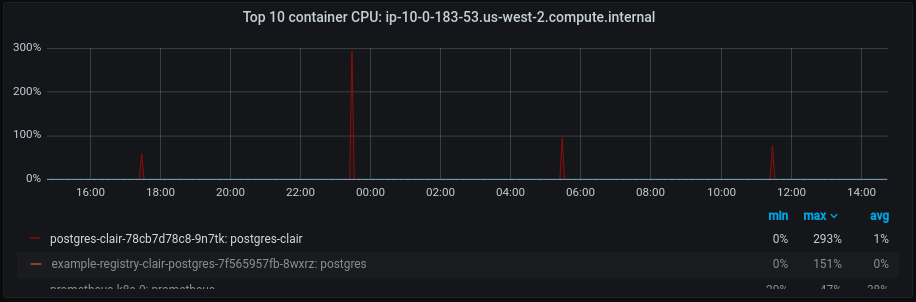
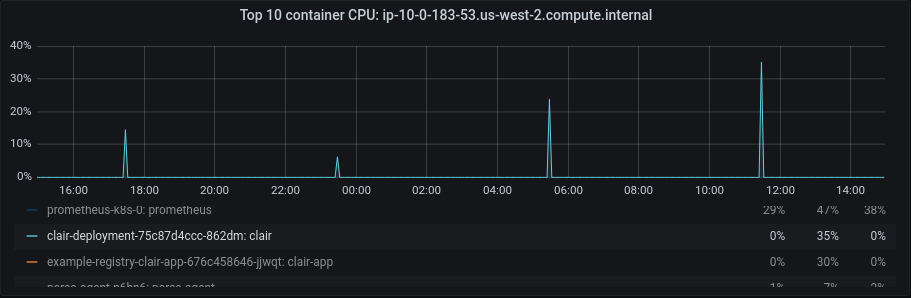
After this optimization, we can see a significant improvement in the database’s disk IOPS and CPU activity which also got reflected at the application CPU level, leaving more room for the incoming requests. This indicates that by implementing all the suggested optimizations, we can efficiently handle and fulfill additional requests using the same existing resources, resulting in cost savings. Feel free to take a look at the POC links referenced above to learn more about the code changes.
Further digging into Clair application profiling
For a deeper dive into application-level details, we conducted application-level profiling for Clair utilizing a tool called pyroscope. The following flame graphs (Figure 11 and Figure 12) depict the performance of the Clair application.
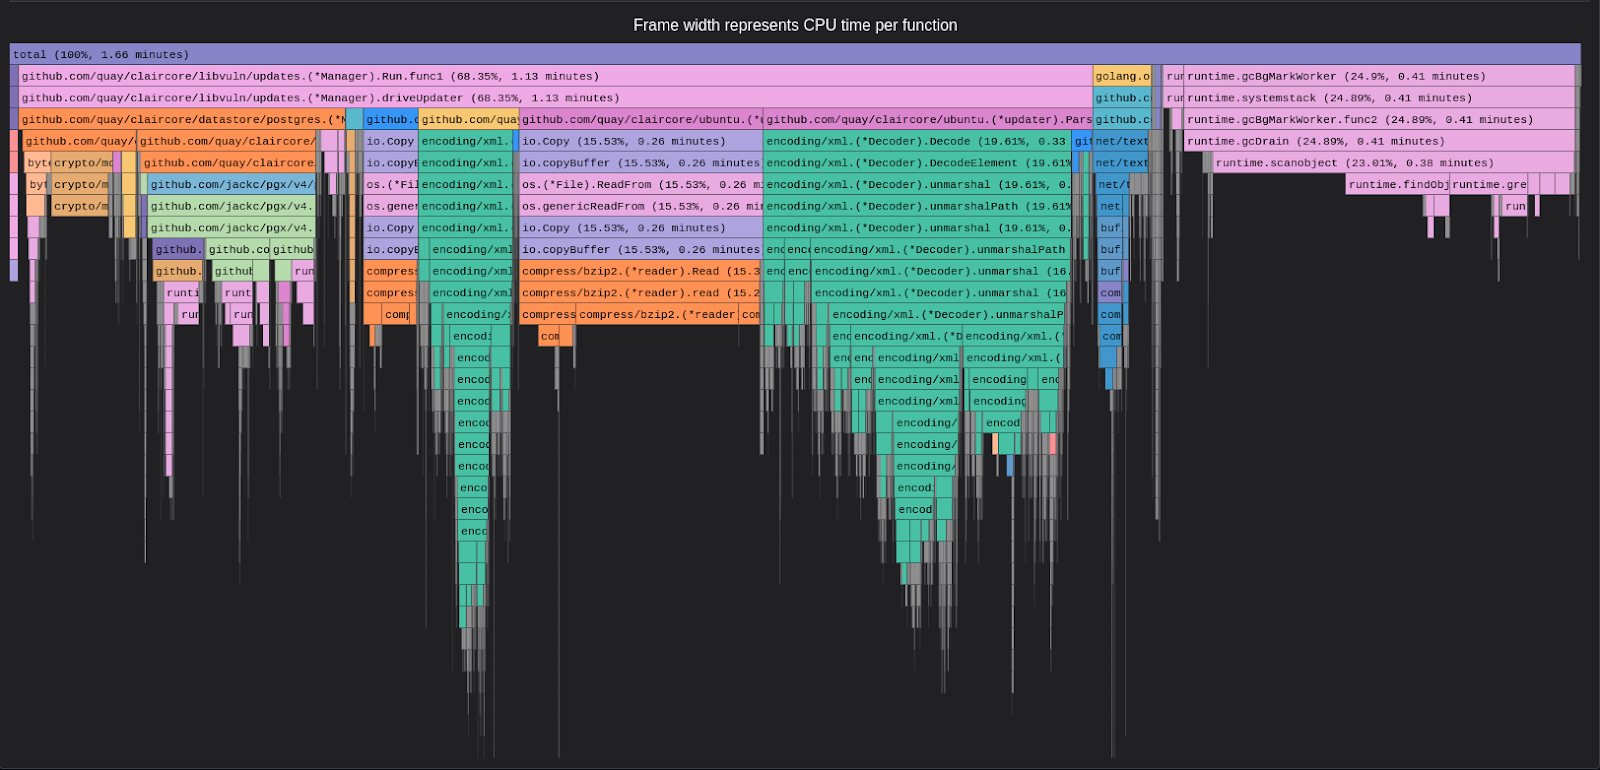
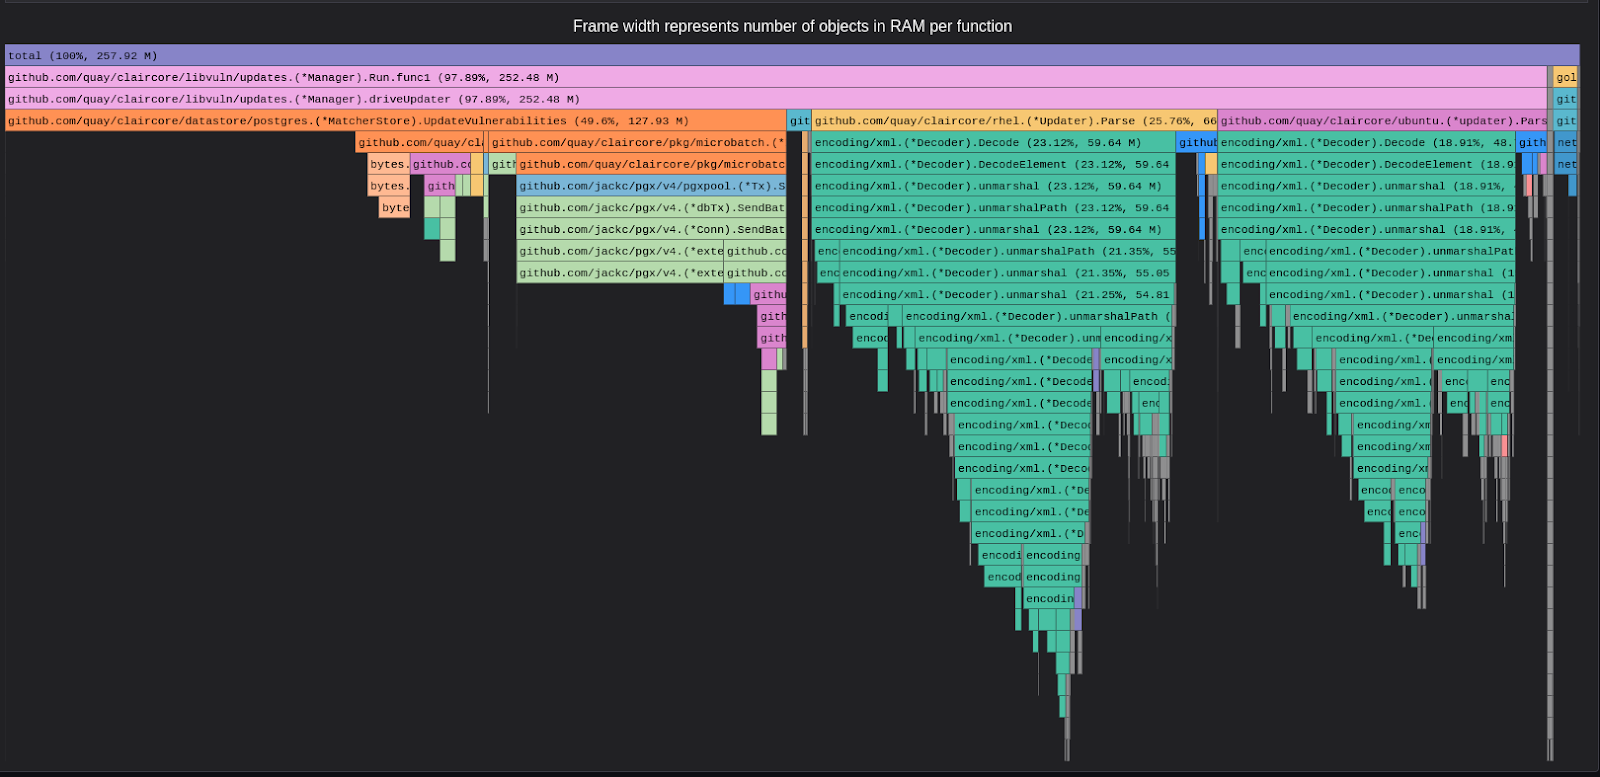
This strongly confirms that updater functions involving database interactions are the most time-consuming, emphasizing the need for optimizations in this specific area.
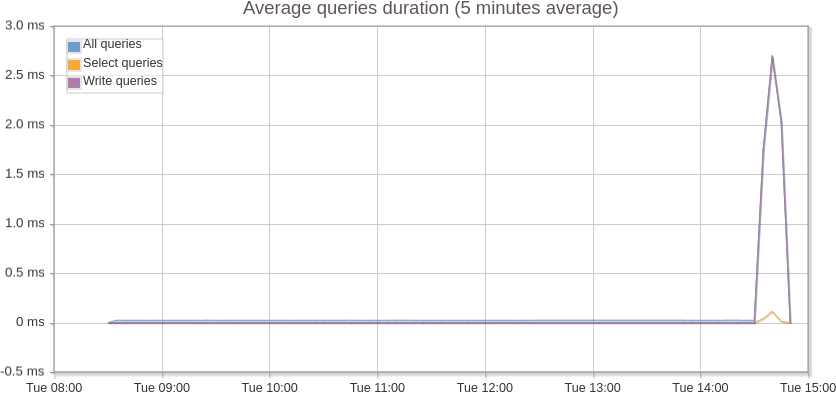
Profiling Quay
Database profiling
We also performed database profiling for Quay to assess the database performance, both in standalone conditions and under load. The average query time remains below 2 milliseconds in both the conditions, indicating that the database activity is entirely driven by incoming requests to the application. From the database standpoint, there is nothing unusual or anomalous .
Application profiling
Currently, Quay lacks an integrated application profiling tool. Integrating a continuous profiling tool, such as pyroscope, would introduce a 2-5% overhead, representing a trade-off. To enhance the overall application, Quay recently underwent a database migration from MySQL to Aurora Postgres. Additional details on this migration can be found in the blog How We Moved Quay.io's Database From MySQL to Postgres And Lived To Tell About I.
Learnings throughout the process
From the above attached screenshots showcasing the outcome after query optimization, here are a few points relevant to the Clair database.
Reasons why bulk queries are better on databases
- Reduced overhead: Reduces the overhead of opening/closing transactions for individual queries, as a single SQL statement acts on multiple rows. The significant reduction in the number of queries, halved after the optimization in Clair, provides clear evidence of this improvement.
- Minimized disk I/O: Bulk operations allow DB to act in sequential manner, resulting in minimized disk I/O operations. Sequential operations are much faster than random ones, as the disk arm movement is minimized. Reduction in the number of Clair Disk IOPS after the optimization proves this statement.
- Few index updates: Bulk operations temporarily disable/defer index updates, which saves time and resources that would have been spent updating the indexes for each individual row, and the indexes are rebuilt once bulk operations are completed. The average query execution time which got drastically reduced after the POC pull request in Clair supports this statement.
- Reduced locking overhead: Few locks are acquired since all the operations are done in a single transaction, reducing resource contention with better concurrency and performance which is again visible in the attached screenshots above.
- Improved WAL utilization: Write-Ahead logging (WAL) is a mechanism used by databases to provide data consistency and durability. Bulk operations have better WAL utilization as data is written in larger blocks, reducing its overhead. For more details please take a look at the “temporary files” section in the below attached results.
For more information on the above reasons, feel free to look at the below hosted web pages:
Disregarding the outliers in the results attached above, when considering the overall average outcomes, all the factors should align with the numerical data.
Never trust an inbuilt library blindly
For executing queries on the Clair database, we utilize the github.com/jackc/pgx/v4 GO library. It's commonly assumed that sending multiple queries as a batch would result in automatic and optimized execution by the library. However, our analysis above revealed this assumption to be incorrect. Therefore, it's advisable to craft optimized queries directly within the query string and provide them as input to the language library responsible for database communication.
What’s next?
We're currently working on making it easy for the Quay/Clair dev teams to run regular performance tests with the new tooling and providing a simple way for them to check and understand the results. See Figures 13 and 14 below for examples of this.
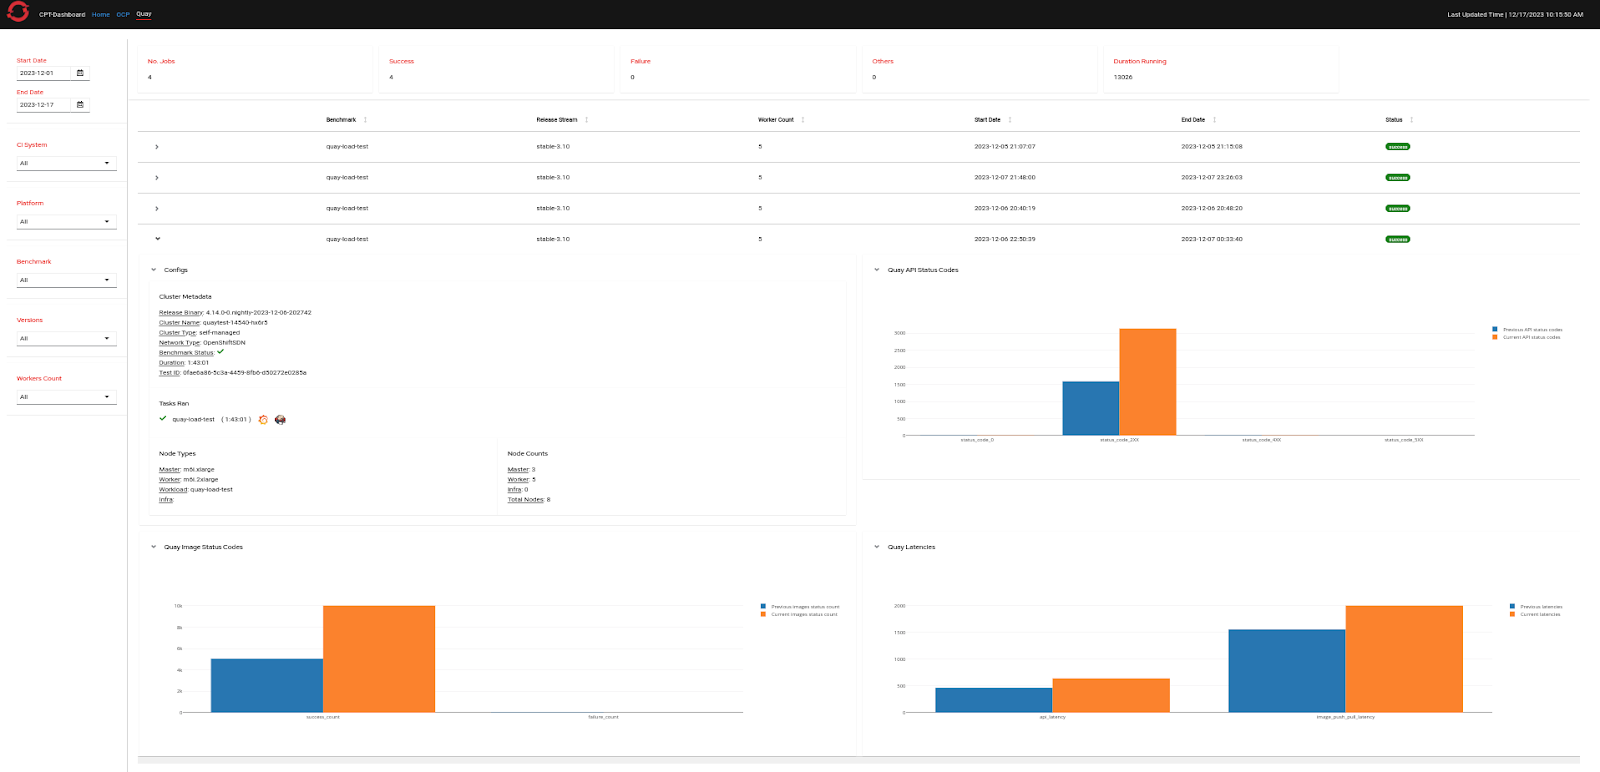
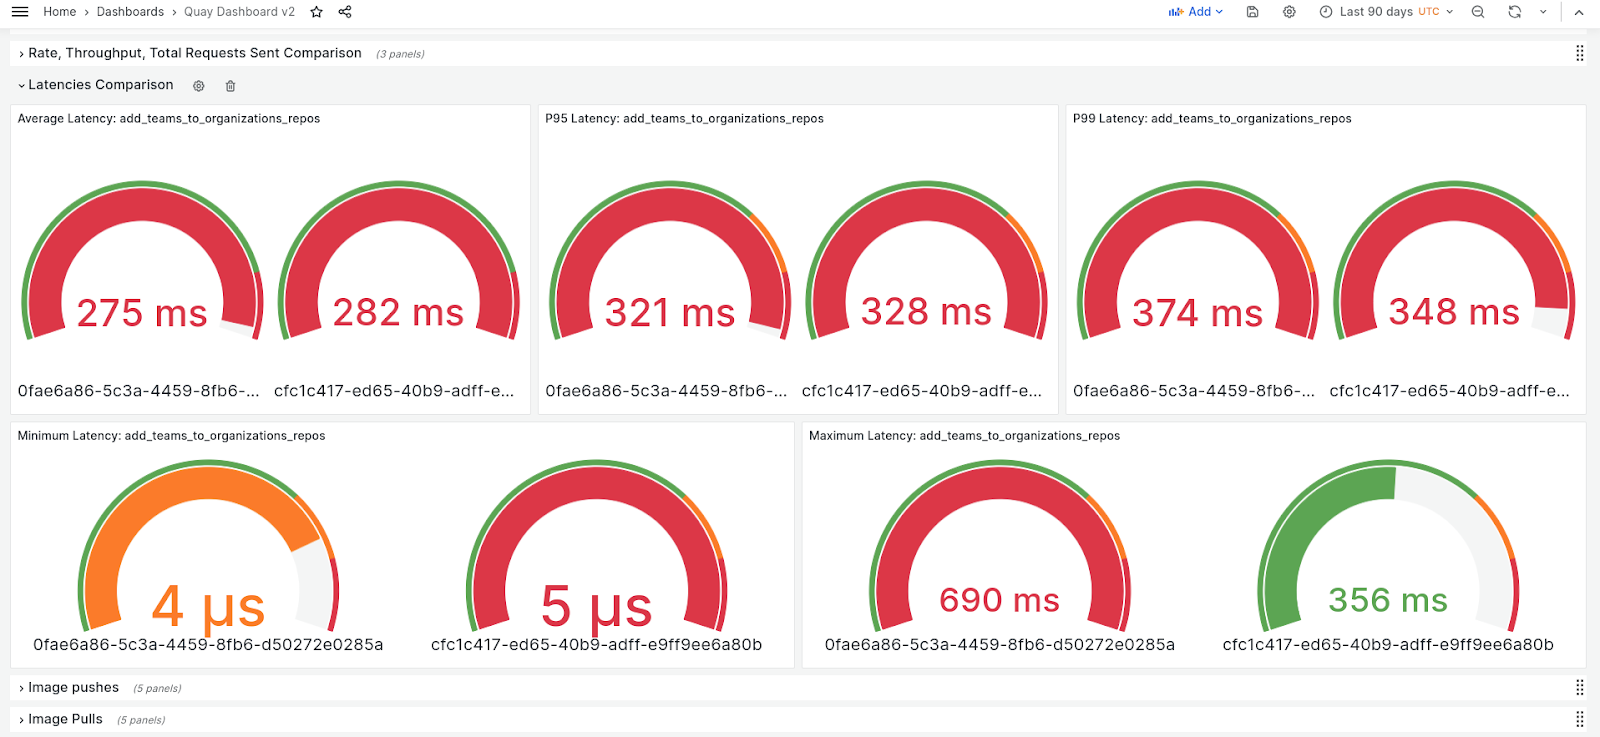
Our goal is to provide the Quay development and QE teams with an easy way to review results, and we will continue to make improvements in the future. Currently, we use measures like throughput, latencies, and HTTP status codes to compare performance between two runs with the same setup. This makes it easier for the Quay quality engineering (QE) team to test before each release. We're looking to expand this approach by including more scenarios to help the Quay development and QE teams get ready for pre-production or pre-release situations.
In conclusion
This write-up was an effort at providing insights into our investments in performance and scale testing of Quay/Clair. The performance and scale team is dedicated to ongoing learning and facilitating improvements to Quay/Clair to enhance stability and scalability to the fullest extent, in collaboration with development and quality engineering teams.
We will continue to invest on adding more load testing scenarios to further improvise on the test setup we have as of today. This includes adding more endpoints and metrics to analyze their performance results. When it comes to result analysis, currently the Quay QE team plots all the graphs in an Excel sheet, which is a very tedious task. Continuous Performance Testing (CPT) Dashboard is our ongoing effort to move away from excel sheets and have all the key visualizations at one place along with Grafana dashboard links which will provide a developer or QE with more zoom-in view at the results.
Last updated: March 21, 2024