Red Hat OpenShift Service Mesh brings tracing and monitoring to your system with little effort. However, the information is basic. In this article, we will create three applications in the Quarkus, Node.Js, and Java languages to collect more detailed statistics with Jaeger, collect custom application specific metrics with Prometheus, and create new dashboards with Grafana.
Jaeger
Jaeger, installed by default in OpenShift Service Mesh, allows developers to configure their services to gather runtime statistics about their performance.
It is important to understand the following terms:
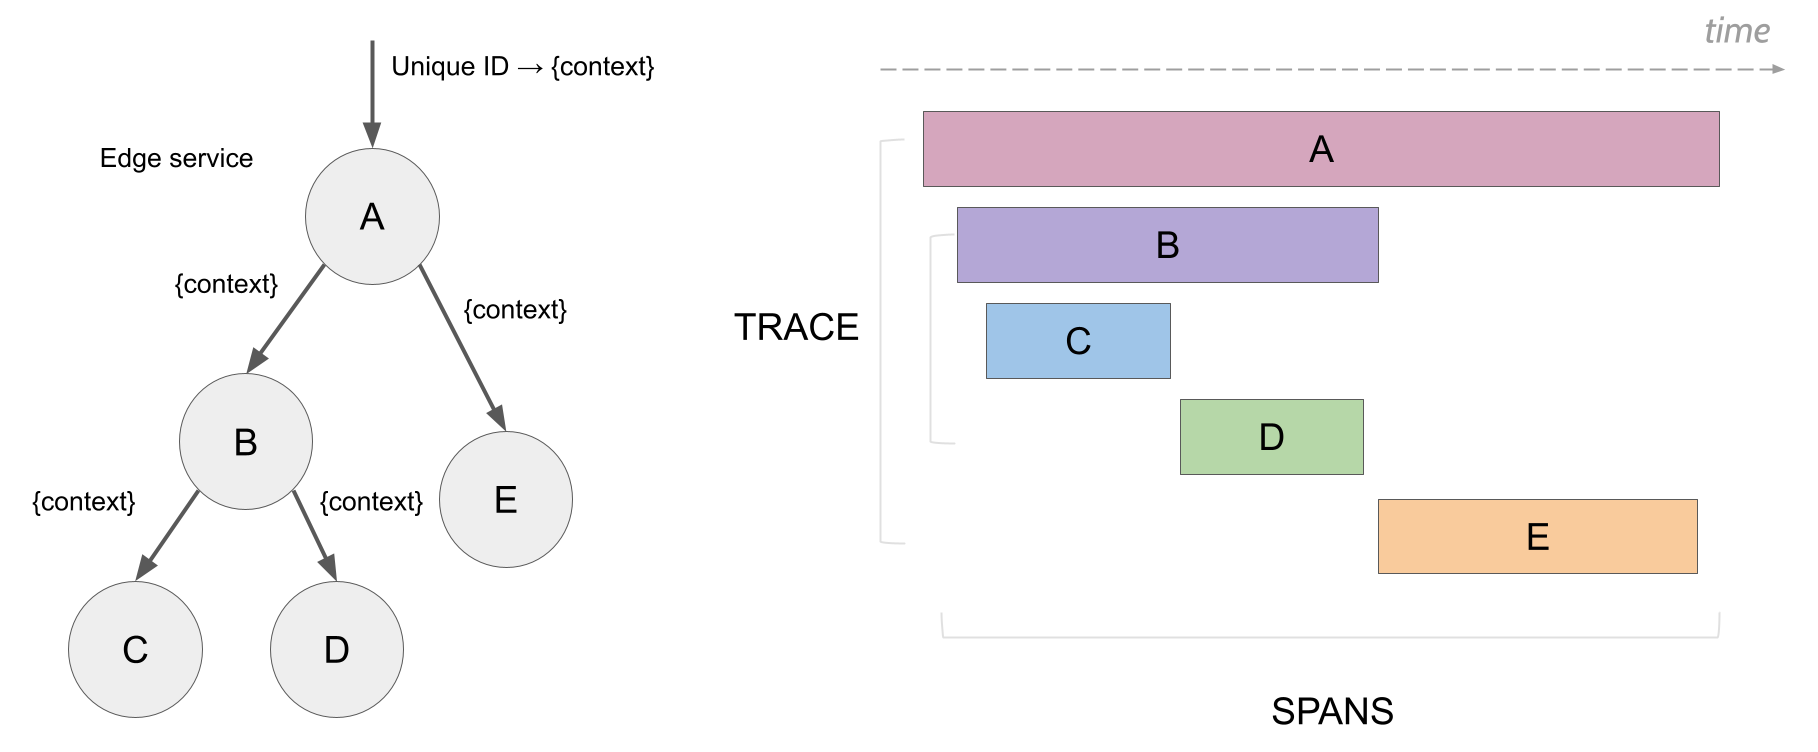
- Span: Represents a logical unit of work, which has a unique name, a start time, and the duration of execution.
- Trace: This is an execution path of services in OpenShift Service Mesh. In other words, a trace is comprised of one or more spans (Figure 1).
Enabling tracing in Quarkus applications
To enable custom metrics for a Quarkus application, add the quarkus-smallrye-opentracing extension in the pom.xml file.
<dependency>
  <groupId>io.quarkus</groupId>
  <artifactId>quarkus-smallrye-opentracing</artifactId>
</dependency>
To enable custom metrics for a Quarkus application, add the related properties in the application.properties file.
opentracing.jaeger.service-name=app_name
opentracing.jaeger.const-sampler.decision=true
opentracing.jaeger.sampler.param=1
opentracing.jaeger.log-spans=false
opentracing.jaeger.http-sender.url=http://jaeger-collector.<namespace>.svc.cluster.local:14268/api/traces
opentracing.jaeger.enable-b3-propagation=true
Enabling tracing in Node.js applications
To enable custom metrics for a Node.js application, add the jaeger-client and opentracing package.
npm install --save jaeger-client opentracing
This package has all the standard Jaeger metric types that you can use to instrument your custom tracing.
const Jaeger = require("jaeger-client");
const Opentracing = require("opentracing");
const logger = Pino();
module.exports = { create };
Configure and initialize the Jaeger tracer.
function create() {
  const config = {
    serviceName: "app_name",
    sampler: { type: "const", param: 1 },
    reporter: { logSpans: true, collectorEndpoint: "http://jaeger-collector.<namespace>.svc.cluster.local:14268/api/traces",
    }
  };
  const options = { logger };
  const tracer = Jaeger.initTracer(config, options);
  const codec = new Jaeger.ZipkinB3TextMapCodec({ urlEncoding: true });
  tracer.registerInjector(Opentracing.FORMAT_HTTP_HEADERS, codec);
  tracer.registerExtractor(Opentracing.FORMAT_HTTP_HEADERS, codec);
  return tracer;
}
This package has all the standard Jaeger metric types that you can use to instrument your custom tracing.
const Fastify = require("fastify");
const Opentracing = require("opentracing");
const logger = Pino();
module.exports = { create };
Start a new span.
function create(tracer) {
  const server = Fastify({ logger });
  server.addHook("onRequest", traceRequest);
  server.addHook("onResponse", traceResponse);
  return server;


  async function traceRequest(request) {
    const { method, originalUrl } = request.raw;
    const name = method + ":app_name";
    const span = tracer.startSpan(name);
    span.setTag(Opentracing.Tags.HTTP_URL, originalUrl);
    span.setTag(Opentracing.Tags.HTTP_METHOD, method);
    request.rootSpan = span;
  }
  async function traceResponse(request, reply) {
    request.rootSpan.setTag(
      Opentracing.Tags.HTTP_STATUS_CODE,
      reply.res.statusCode
    );
    request.rootSpan.finish();
  }
}
Enabling tracing in Java applications
To enable custom metrics for a Java application, add the opentracing-spring-jaeger-cloud-starter extension in the pom.xml file.
<dependency>
  <groupId>io.opentracing.contrib</groupId>
  <artifactId>opentracing-spring-jaeger-cloud-starter</artifactId>
</dependency>
To enable custom metrics for a Java application, add the related properties in the application.properties file.
opentracing.jaeger.service-name=app_name
opentracing.jaeger.const-sampler.decision=true
opentracing.jaeger.sampler.param=1.0
opentracing.jaeger.log-spans=false
opentracing.jaeger.http-sender.url=http://jaeger-collector.<namespace>.svc.cluster.local:14268/api/traces
opentracing.jaeger.enable-b3-propagation=true
Visualizing traces and spans using the Jaeger web console
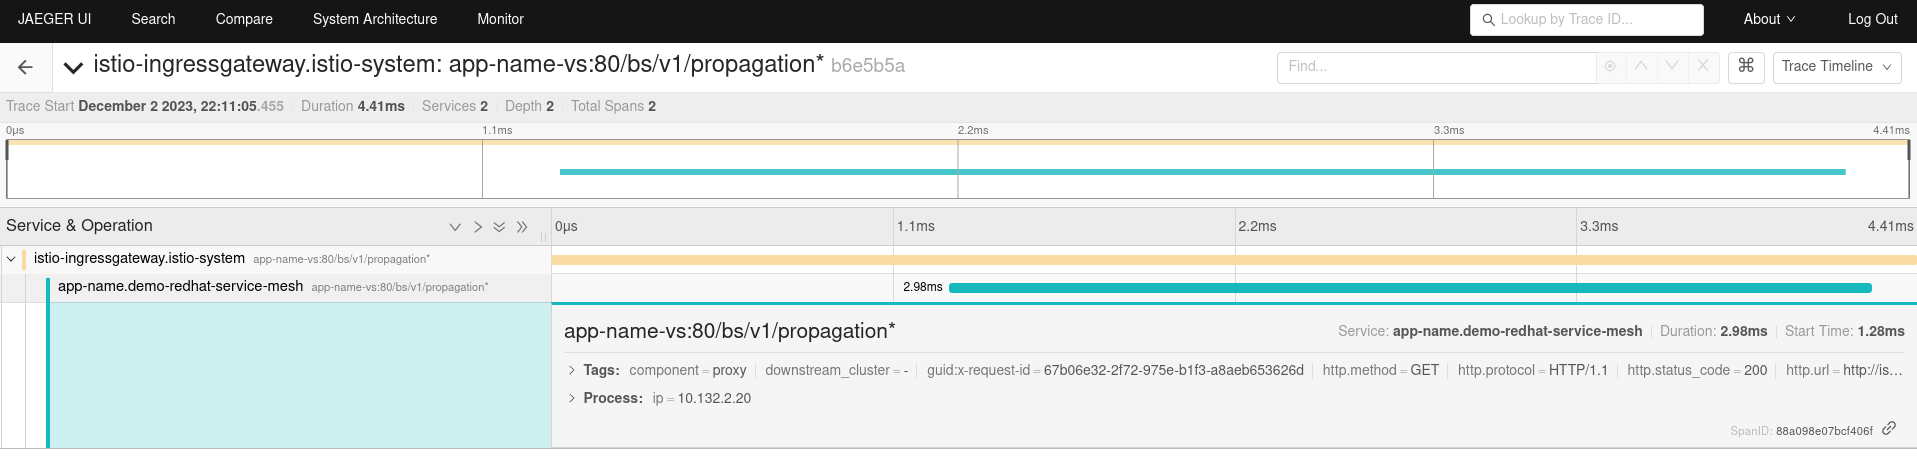
In the first console, you can see only the service and the route that was consumed, as shown in Figure 2.
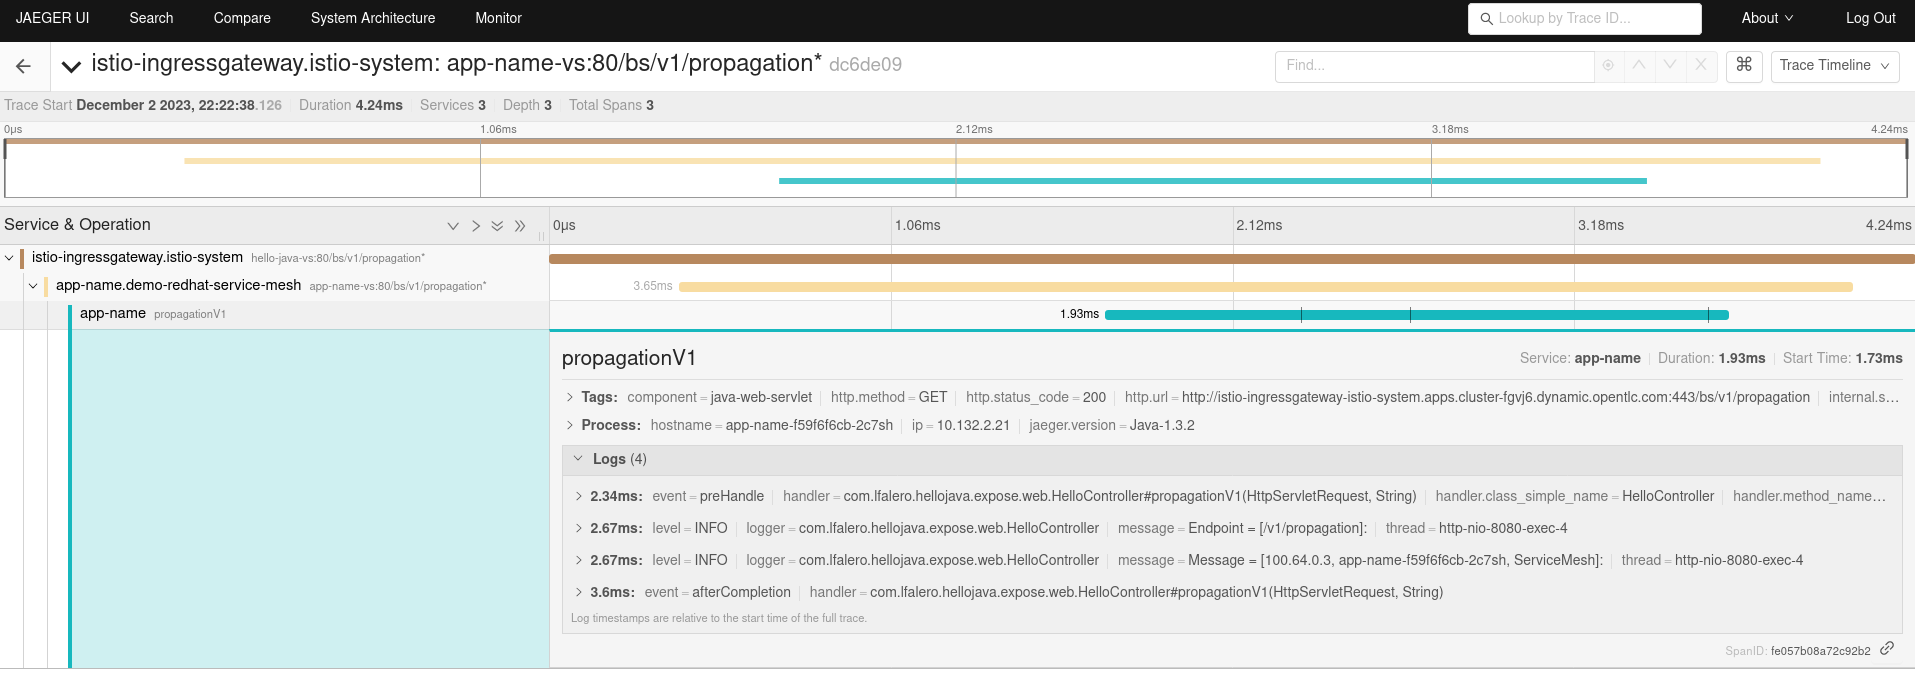
In the last console, the method that was consumed and the logs are shown in Figure 3.
Prometheus and Grafana
Prometheus is an open source systems monitoring and alerting toolkit which includes a time series database for storing metrics. OpenShift Service Mesh provides a default Prometheus instance which gathers metrics data from the Envoy proxies, the services in the service mesh, and the components in the control plane.
Grafana is an open source graphical visualization tool used for creating operational dashboards. OpenShift Service Mesh provides a default Grafana instance with ready made dashboards for viewing data from the Envoy proxies, the services in the service mesh, and the components in the control plane.
Collecting custom application metrics
OpenShift Service Mesh collects several useful metrics high level understanding at the performance of the service mesh and the applications deployed on it. However, sometimes you might need to gather custom application specific metrics and display them in a Grafana dashboard. You must include the Prometheus client libraries in your application, and then create these custom metrics.
Prometheus supports four types of metrics:
- Counter: A cumulative metric whose value can only increase or reset to zero on restart. For example, you can use a counter to represent the number of requests served, errors, and tasks completed.
- Gauge: A metric that can be incremented or decremented. For example, you can use a gauge to represent the number of processes or the number of concurrent users.
- Histogram: Track the number and the sum of the values, allowing you to calculate the average of the values.
- Summary: Similar to a histogram, but a summary also calculates configurable values over a sliding time window.
Creating custom metrics for Quarkus applications
To enable custom metrics for a Quarkus application, add the quarkus-smallrye-metrics extension in the pom.xml file.
<dependency>
  <groupId>io.quarkus</groupId>
   <artifactId>quarkus-smallrye-metrics</artifactId>
</dependency>
Import the required metrics classes in your application from the org.eclipse.microprofile.metrics.* package.
This package has all the standard Prometheus metric types that you can use to instrument your custom metrics.
import org.eclipse.microprofile.metrics.MetricUnits;
import org.eclipse.microprofile.metrics.annotation.Counted;
import org.eclipse.microprofile.metrics.annotation.Gauge;
import org.eclipse.microprofile.metrics.annotation.SimplyTimed;
import org.eclipse.microprofile.metrics.annotation.Metered;
Timed can be created by adding the @SimplyTimed annotation to methods:
@SimplyTimed(
  name = "app_name:request_process_time",
  description = "A measure of how long it takes to process a request",
  unit = MetricUnits.MILLISECONDS
)
Counter can be created by adding the @Counted annotation to methods:
@Counted(
  name = "app_name:request_placed",
  description = "Count of request placed"
)
Metered can be created by adding the @Metered annotation to methods:
@Metered(
  name = "app_name:request_processed_rate",
  description = "Rate at which requests are placed",
  unit = MetricUnits.MINUTES,
  absolute = true
)
Gauge can be created by adding the @Gauge annotation to methods:
@Gauge(
  name = "app_name:order_process_rating",
  description = "Overall customer rating for the order process",
  unit = MetricUnits.NONE
)
Creating custom metrics for Node.js applications
To enable custom metrics for a Node.js application, add the prom-client package.
npm install --save prom-client
Import the prometheus-client package and initialize it. Then add a unique prefix to identify the standard metrics.
const express = require('express');
var prometheus = require('prom-client');
const prefix = 'app_name_';
prometheus.collectDefaultMetrics({ prefix });
Counter can be created by adding the new prometheus.Counter annotation to methods:
const requestPlaced = new prometheus.Counter({
  name: app_name:request_placed,
  help: 'Count of request placed'
});
Gauge can be created by adding the new prometheus.Gauge annotation to methods:
const processRating = new prometheus.Gauge({
  name: app_name:order_process_rating,
  help: 'Overall customer rating for the order process'
});
Update the method to add the new constant variables.
app.get('/method-name, async function (req, res) {
  processRating.inc(); //You can then increment the counter
  requestPlaced.setToCurrentTime();   //You can know the overall rating
  const end = requestPlaced.startTimer();
  end();
  res.send('OK');
});
Add code to create a new HTTP GET endpoint called /metrics which will be used by Prometheus to collect metrics for this microservice.
app.get('/metrics', function (req, res) {
  res.set('Content-Type', prometheus.register.contentType);
  res.send(prometheus.register.metrics());
});
Creating custom metrics for Java applications
To enable custom metrics for a Java application, add the micrometer-registry-prometheus extension in the pom.xml file.
<dependency>
  <groupId>org.springframework.boot</groupId>
  <artifactId>spring-boot-starter-actuator</artifactId>
  <scope>compile</scope>
</dependency>
<dependency>
  <groupId>io.micrometer</groupId>
  <artifactId>micrometer-registry-prometheus</artifactId>
  <scope>runtime</scope>
</dependency>
To enable custom metrics for a Java application, add the related properties in the application.properties file.
management.endpoints.enabled-by-default=true
management.endpoints.web.exposure.include=*
management.endpoint.health.show-details: always
Import the required metrics classes in your application from the io.micrometer.core.* package.
This package has all the standard Prometheus metric types that you can use to instrument your custom metrics.
import io.micrometer.core.instrument.MeterRegistry;
import io.micrometer.core.instrument.Gauge;
import io.micrometer.core.annotation.Timed;
Gauge can be created by adding the Gauge.builder method to constructor:
public class OrderController {
  private List<Order> orderList;
  public Supplier<Number> orderCount() { return ()->orderList.size(); }
  public OrderController(MeterRegistry registry) {
    Gauge.builder("app_name:order_process_rating", orderCount()).
      description("Overall customer rating for the order process").
      register(registry);
  }
}
Timed can be created by adding the @Timed annotation to methods:
@Timed(
  value = "app_name:request_process_time",
  description = "A measure of how long it takes to process a request",
  percentiles = {0.5,0.9}
)
Enabling Prometheus metrics
OpenShift Service Mesh does not collect metrics from applications by default. To enable Prometheus to collect metrics from your application, add the following annotations:
spec:
 template:
   metadata:
     annotations:
       sidecar.istio.io/inject: "true"
       prometheus.io/scrape: "true"
       prometheus.io/port: "8080"
       prometheus.io/scheme: "http"
Querying OpenShift Service Mesh metrics using Prometheus
Figure 4 illustrates the newly created metric app_name:request_placed in Prometheus.
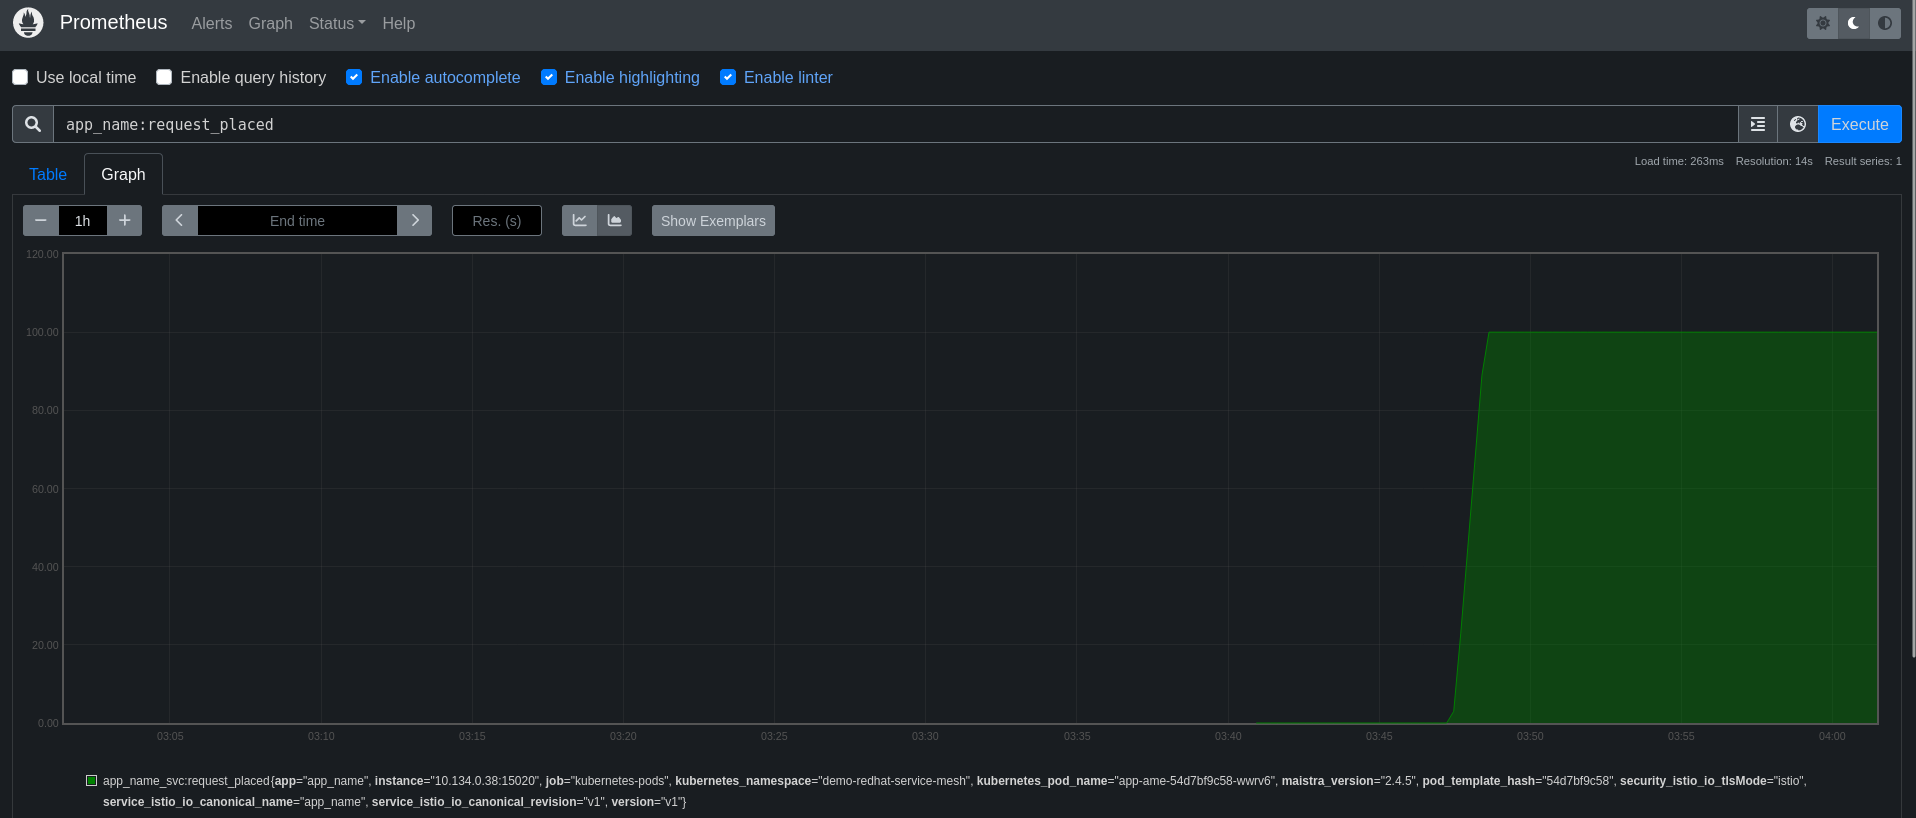
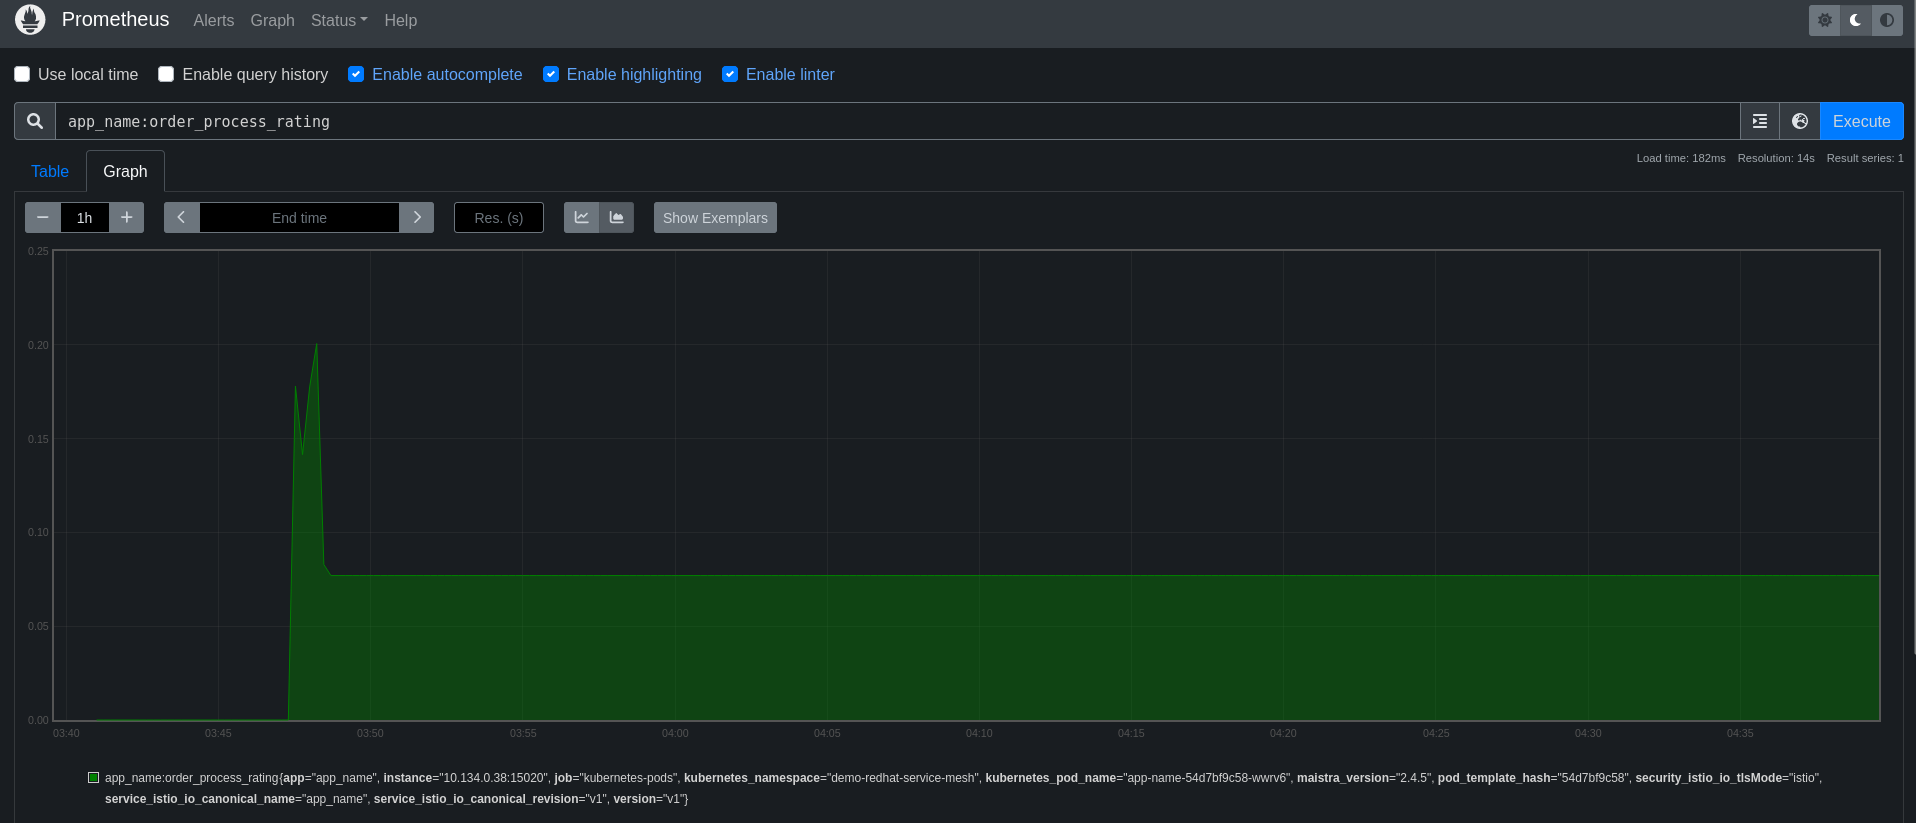
Figure 5 shows the newly created metric app_name:order_process_rating in Prometheus.
Visualizing OpenShift Service Mesh metrics using Grafana
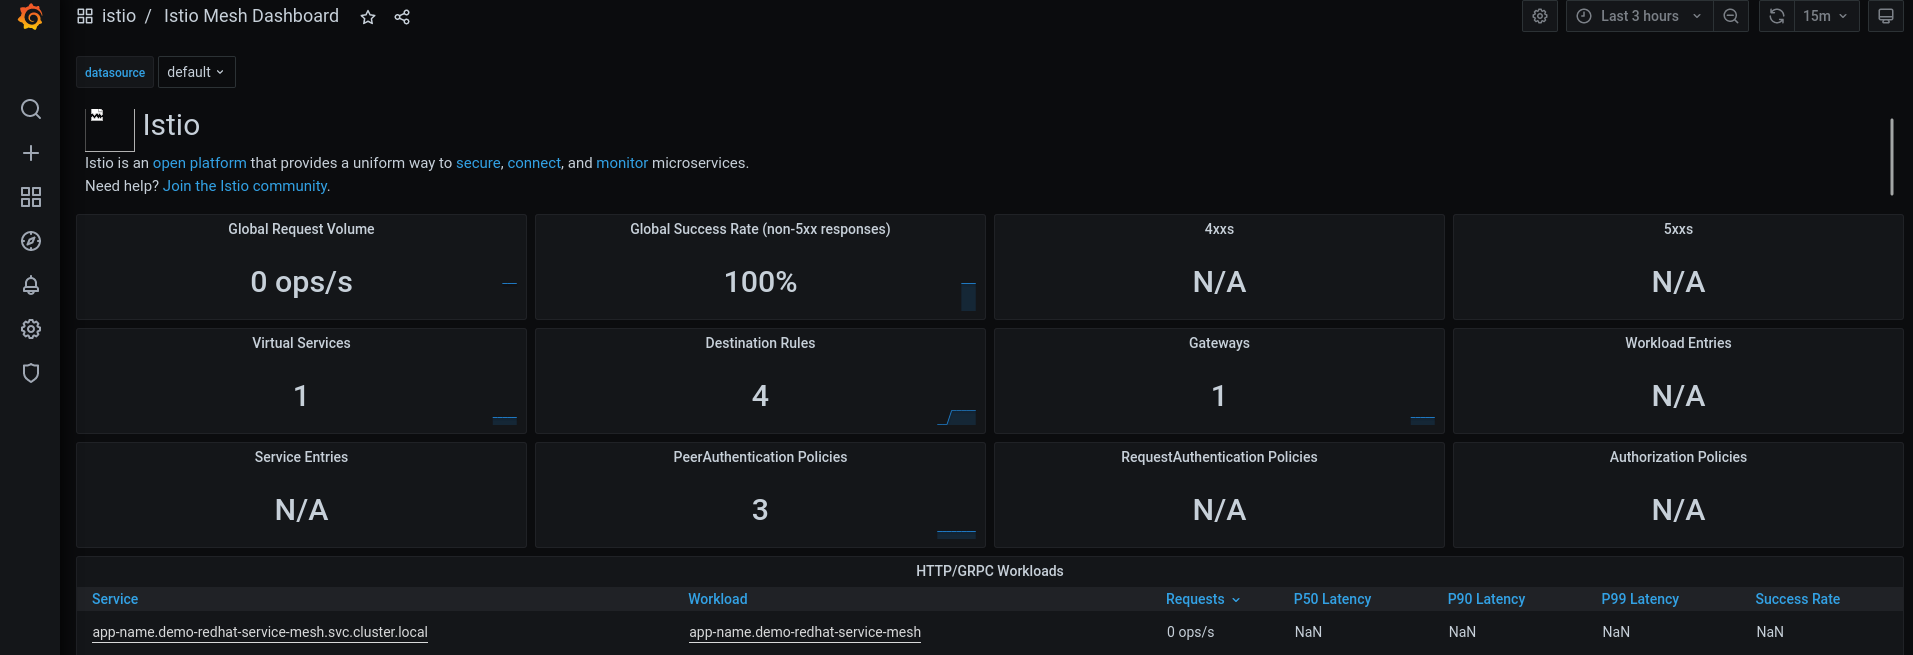
Figure 6 illustrates the basic metrics in Grafana.
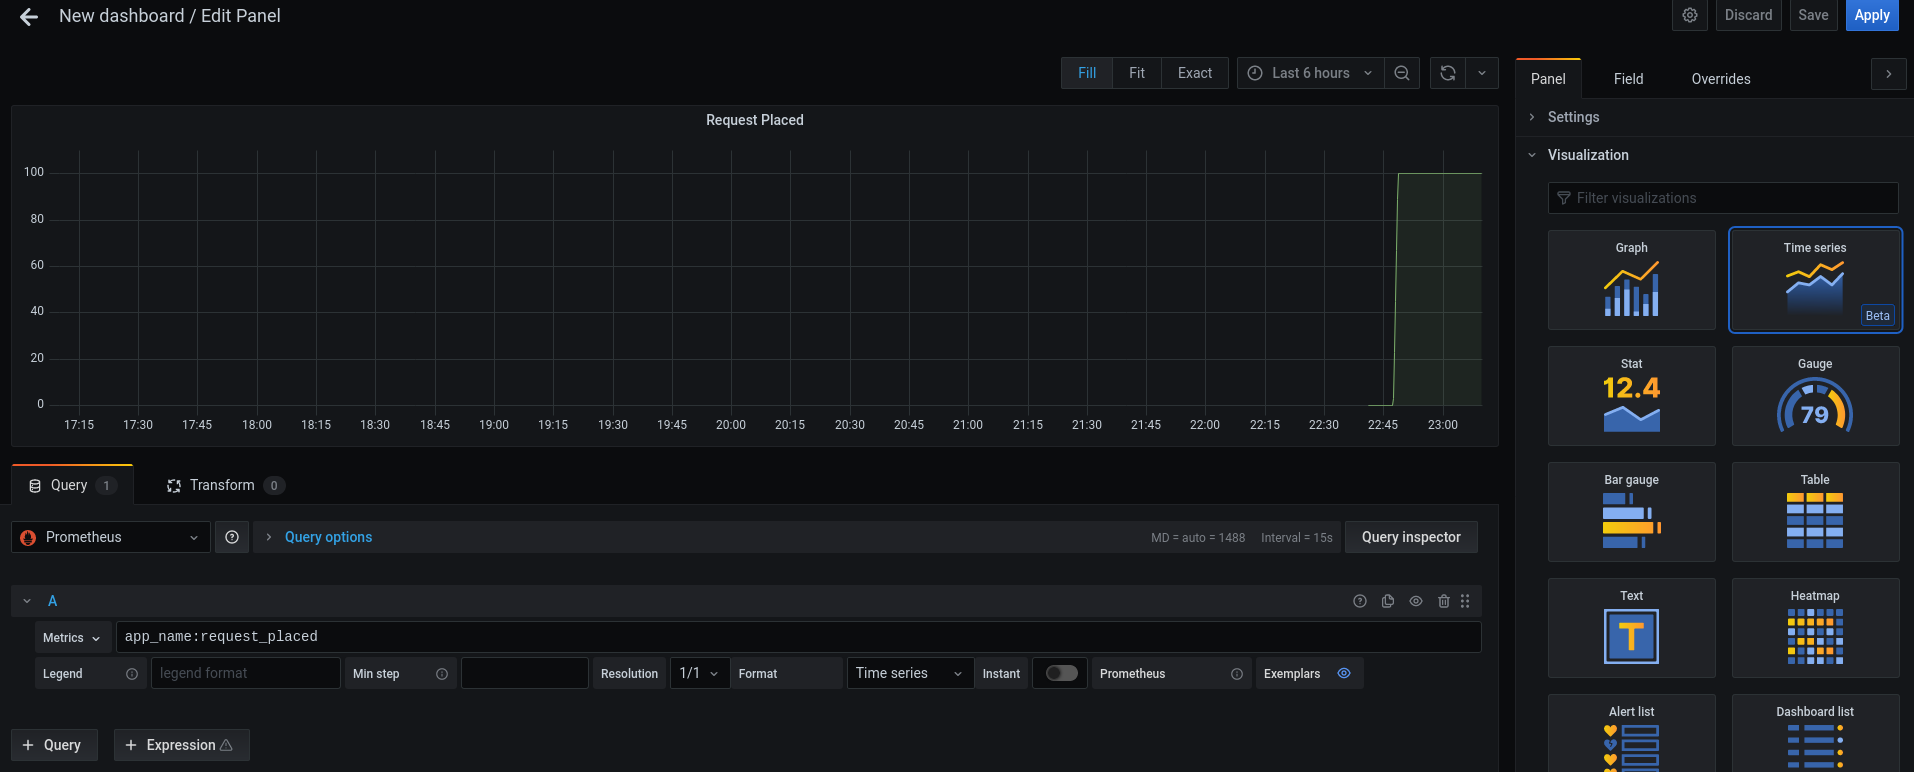
Create a new dashboard to add the newly created metric app_name:request_placed in Grafana (Figure 7).
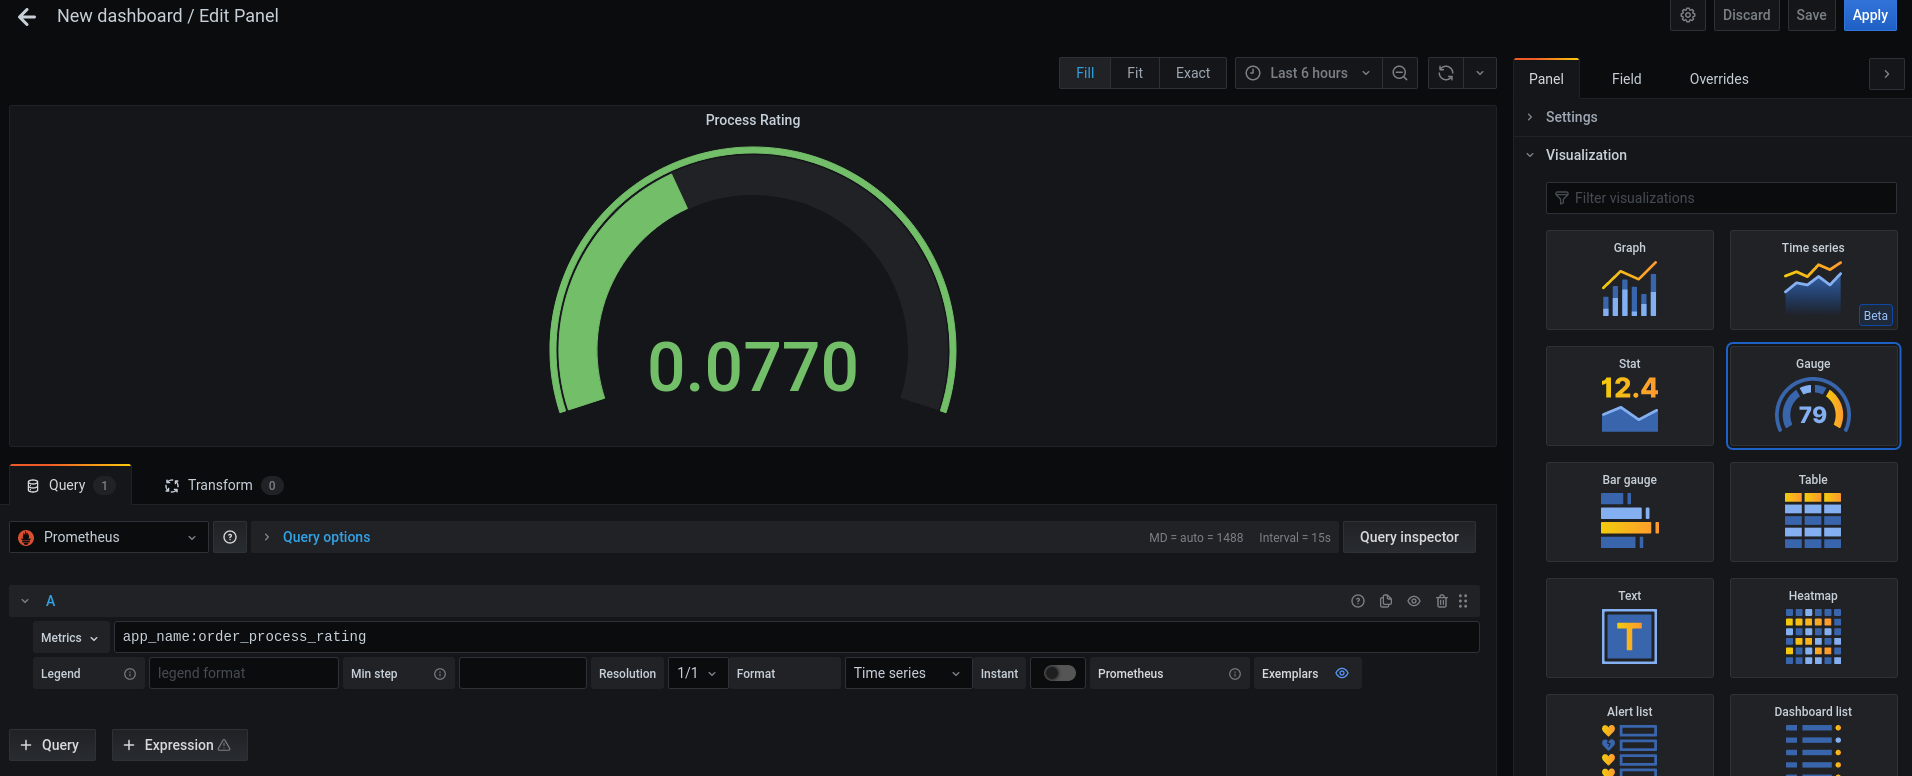
Create a new dashboard to add the newly created metric app_name:order_process_rating in Grafana (Figure 8).
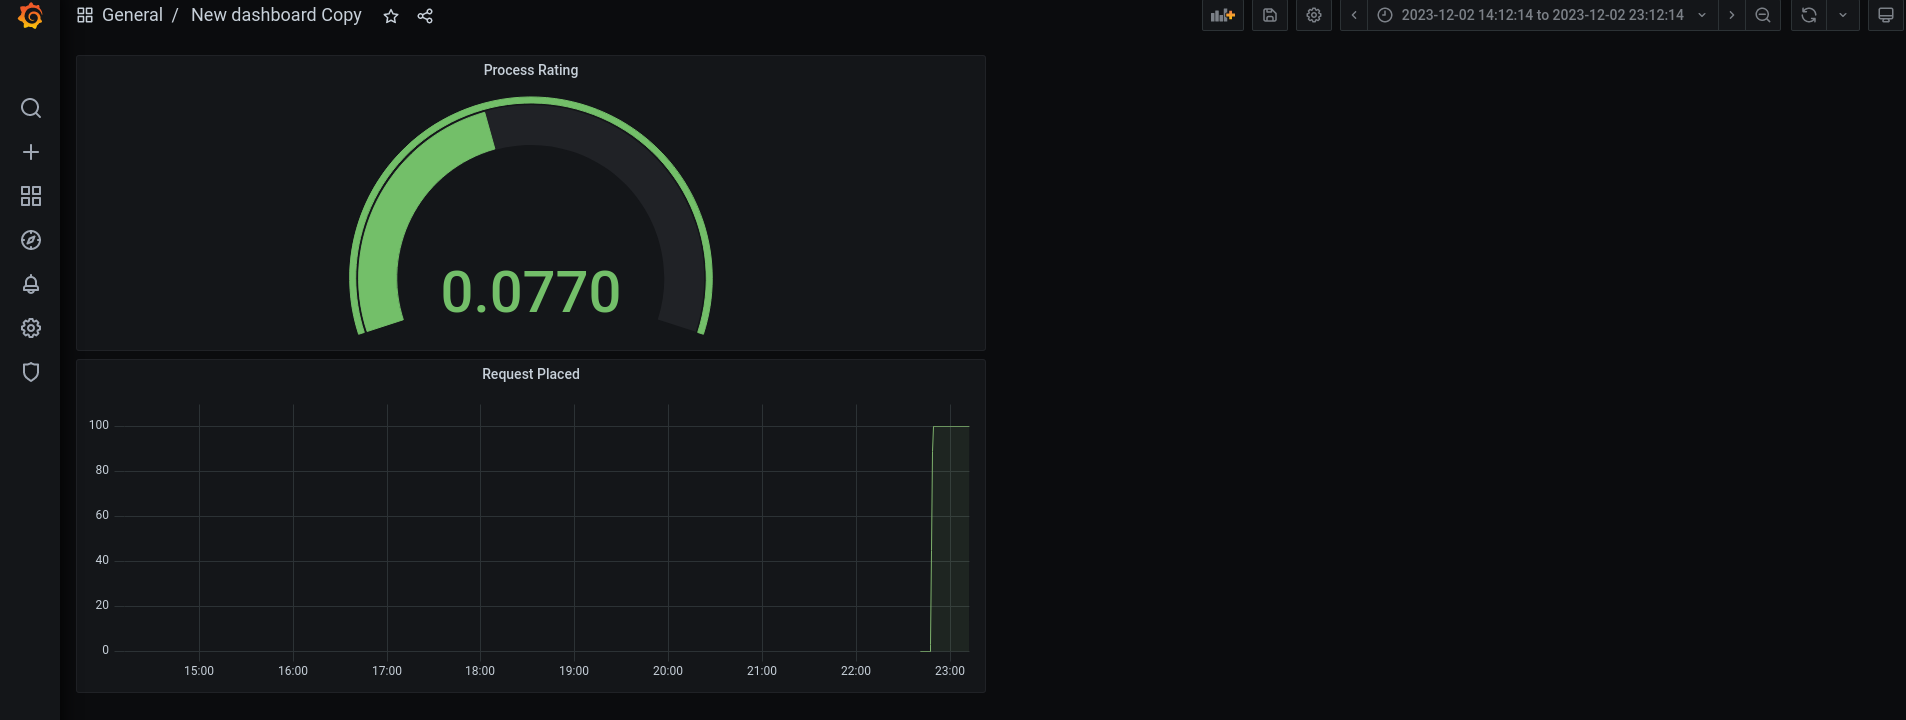
You can view the new dashboard created with the two metrics created (Figure 9).
Summary
Tracing helps you identify performance issues in microservices based applications. That's why you should add your applications Jaeger and OpenTracing libraries to enable tracing. Also, you can use Prometheus libraries to generate custom application metrics and Grafana to generate custom dashboards for your application metrics.