Observability is Key
One of the great things about Node.js is how well it performs in a container. Its fast start up time, and relatively small size make it a favorite for microservice applications on OpenShift. But with this shift to containerized deployments comes some complexity. As a result, monitoring Node.js applications can be difficult. At times it seems as though the performance and behavior of our applications become opaque to us. So what can we do to find and address issues in our services before they become a problem? We need to enhance observability by monitoring the state of our services.
Instrumentation
Instrumentation of our applications is one way to increase observability. Therefore, in this article, I will demonstrate the instrumentation of a Node.js application using Prometheus.
Prometheus is an installable service which gathers instrumentation metrics from your applications and stores them as time-series data. For online services, such as an Express.js application, the metrics we most care about are throughput, errors and latency. Your application is responsible for exposing these metrics to the Prometheus system. Therefore, using the prom-client NPM module, we will instrument a small Express.js application and expose those metrics for consumption by Prometheus.
A Simple Express.js App
Let's start by creating a simple Express.js application. In this application we have a service endpoint at /api/greeting which will accept either GET or POST requests, and returns a greeting as JSON. The following commands will get your project started.
$ mkdir myapp
$ cd myapp
$ npm init -y
$ npm install --save express body-parser prom-client
This should create a package.json file for you and install all of the application dependencies. Next, open the package.json file in a text editor and add the following to the scripts section: "start": "node myapp.js".
Default and Custom Instrumentation
The prom-client module exposes all of the default metrics recommended by Prometheus itself. Follow the link to read more about these. The defaults include metrics such as process_cpu_seconds_total and process_heap_bytes, for example. In addition to exposing these default metrics, prom-client also allows developers to define their own metrics, shown in the code below.
Application Source Code
The application code is a fairly simple Express application. Create a new file in your text editor called myapp.js and paste the following code in it.
'use strict';
const express = require('express');
const bodyParser = require('body-parser');

// Use the prom-client module to expose our metrics to Prometheus
const client = require('prom-client');

// enable prom-client to expose default application metrics
const collectDefaultMetrics = client.collectDefaultMetrics;

// define a custom prefix string for application metrics
collectDefaultMetrics({ prefix: 'my_application:' });

// a custom histogram metric which represents the latency
// of each call to our API /api/greeting.
const histogram = new client.Histogram({
  name: 'my_application:hello_duration',
  help: 'Duration of HTTP requests in ms',
  labelNames: ['method', 'status_code'],
  buckets: [0.1, 5, 15, 50, 100, 500]
});

// create the express application
const app = express();
const port = process.argv[2] || 8080;
app.use(bodyParser.json());
app.use(bodyParser.urlencoded({extended: false}));

// our API
app.use('/api/greeting', (request, response) => {
  // start the timer for our custom metric - this returns a function
  // called later to stop the timer
  const end = histogram.startTimer();
  const name = request.query.name ? request.query.name : 'World';
  response.send({content: `Hello, ${name}!`});
  // stop the timer
  end({ method: request.method, 'status_code': 200 });
});

// expose our metrics at the default URL for Prometheus
app.get('/metrics', (request, response) => {
  response.set('Content-Type', client.register.contentType);
  response.send(client.register.metrics());
});

app.listen(port, () => console.log(`Hello world app listening on port ${port}!`));
In the source file above, we create a custom histogram metric on line 16, which we use to calculate the latency of our application. Next, in the API route /api/greeting we start the metric's timer as the first action on line 33. Then, we stop the timer after completing the request on line 37.
Installing the Application
You can install this application in OpenShift by running the following command.
$ npx nodeshift --strictSSL=false --expose
This will create all of the necessary OpenShift objects required to build, run and expose an external route to your application. After the deployment completes, you can browse to your newly deployed application. You can view the Prometheus metrics at the /metrics path, or visit /api/greeting to see this exciting API in action! From the command line, you can get the URL for your newly deployed app with the following command.
$ oc get -o template route myapp --template="http://{{.spec.host}}/api/greeting"
If all is good, you'll see something like this in your browser: {"content":"Hello, World!"}. Now get the URL for the Prometheus metrics your application is exposing with this command.
$ oc get -o template route myapp --template="http://{{.spec.host}}/metrics"
Install Prometheus
OpenShift comes with a Prometheus instance already available. However, this instance has been optimized for instrumentation of the Kubernetes system itself. As a result, for our purposes, we will install a standalone Prometheus server in our OpenShift project and point it at our application.
Fortunately for us, the OpenShift developers have provided some templates to make Prometheus installation on OpenShift relatively pain free.
Prometheus Configuration Files
The OpenShift Prometheus templates depend on a couple of configuration files stored as Kubernetes secrets. Therefore, before installing Prometheus we need to be sure that our cluster contains the correct configuration files for the installation. These are prometheus.yml and alertmanager.yml. Ours look like this.
prometheus.yml
global:
  scrape_interval:     15s # Set the scrape interval to every 15 seconds. Default is every 1 minute.
  evaluation_interval: 15s # Evaluate rules every 15 seconds. The default is every 1 minute.
  # scrape_timeout is set to the global default (10s).

# Alertmanager configuration
alerting:
  alertmanagers:
  - static_configs:
    - targets:
      # - alertmanager:9093

# A scrape configuration containing exactly one endpoint to scrape:
# Here it's Prometheus itself.
scrape_configs:
  # The job name is added as a label `job=` to any timeseries scraped from this config.
  - job_name: 'prometheus'

    # metrics_path defaults to '/metrics'
    # scheme defaults to 'http'.

    static_configs:
    - targets: ['localhost:9090']

  # Scrape configuration for our hello world app
  - job_name: 'myapp'
    static_configs:
    - targets: ['myapp:8080']
alertmanager.yml
global:
# The root route on which each incoming alert enters.
route:
  # default route if none match
  receiver: alert-buffer-wh
receivers:
- name: alert-buffer-wh
  webhook_configs:
  - url: http://localhost:9099/topics/alerts
Most of this is just boilerplate, but if you look at the bottom of prometheus.yml, you can see the part that matters. This is where we inform Prometheus of our new application myapp. We are telling Prometheus that it can be discovered on port 8080 of the myapp service. Recall we are serving metrics at the /metrics endpoint. This is the default value which Prometheus expects.
Add Configuration Secrets and Deploy
We will use Kubernetes secrets to store these files, and the Prometheus instance created by the template will know where to find them. After you have created the configuration files on your local filesystem, be sure you are logged in to OpenShift. Then type the following to add the files themselves and the Prometheus system to your project.
# Create the prom secret
$ oc create secret generic prom --from-file=prometheus.yml

# Create the prom-alerts secret
$ oc create secret generic prom-alerts --from-file=alertmanager.yml

# Create the prometheus instance
$ oc process -f https://raw.githubusercontent.com/openshift/origin/master/examples/prometheus/prometheus-standalone.yaml | oc apply -f -
Once the Prometheus system has been fully deployed and started, you can browse to the Prometheus dashboard to see some metrics! The URL for the Prometheus dashboard in shown in the OpenShift Console. If everything has deployed correctly, you should see a screen similar to this.
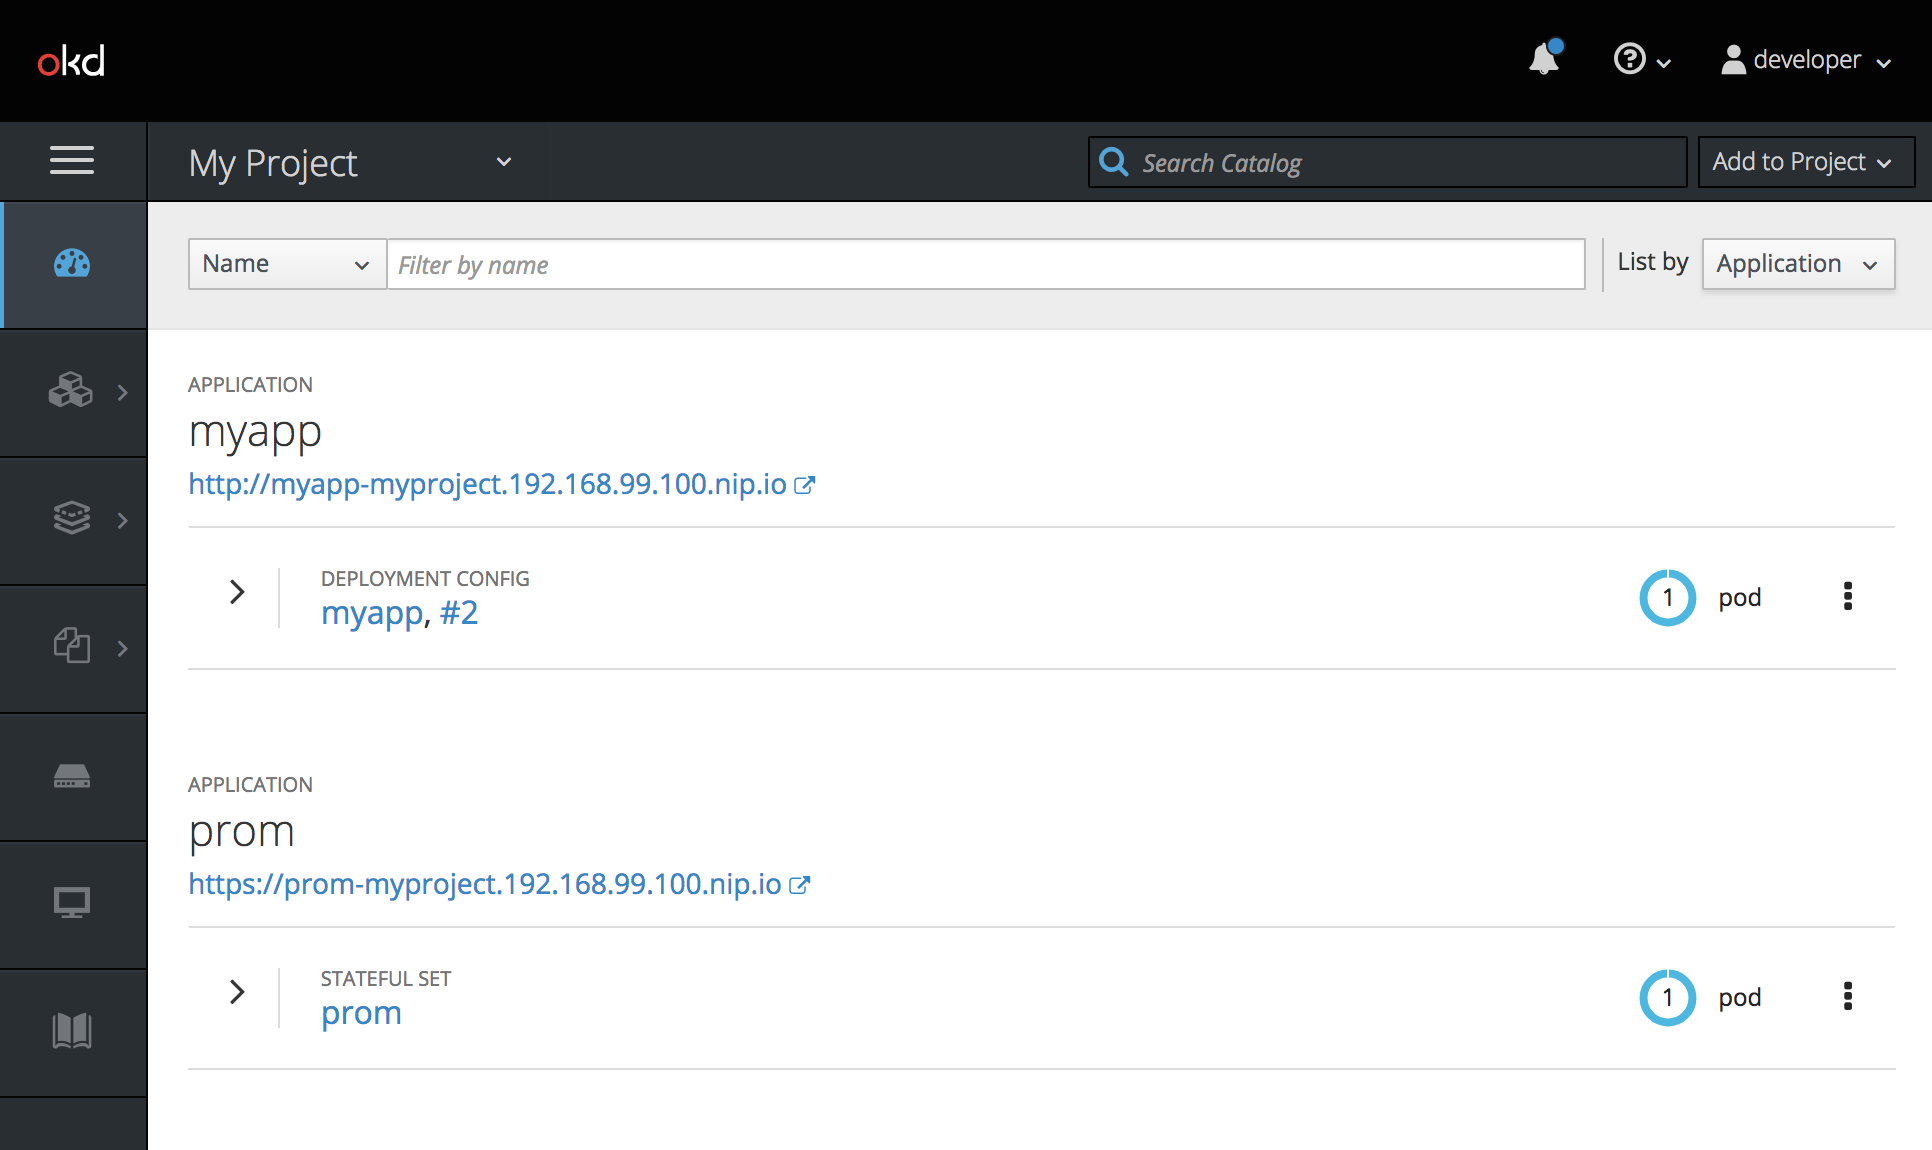
Browse the Prometheus Dashboard
If you prefer the command line, you can type oc get -o template route prom --template="http://{{.spec.host}}" to get a route to the Prometheus deployment. When first browsing the Prometheus application, you'll need to login. Simply use the OpenShift credentials that you used to login to the console. After that, click the Status menu item, and select Targets. This will show you what services your Prometheus instance is configured to scrape. If you have done everything correctly, you will see a screen like this.
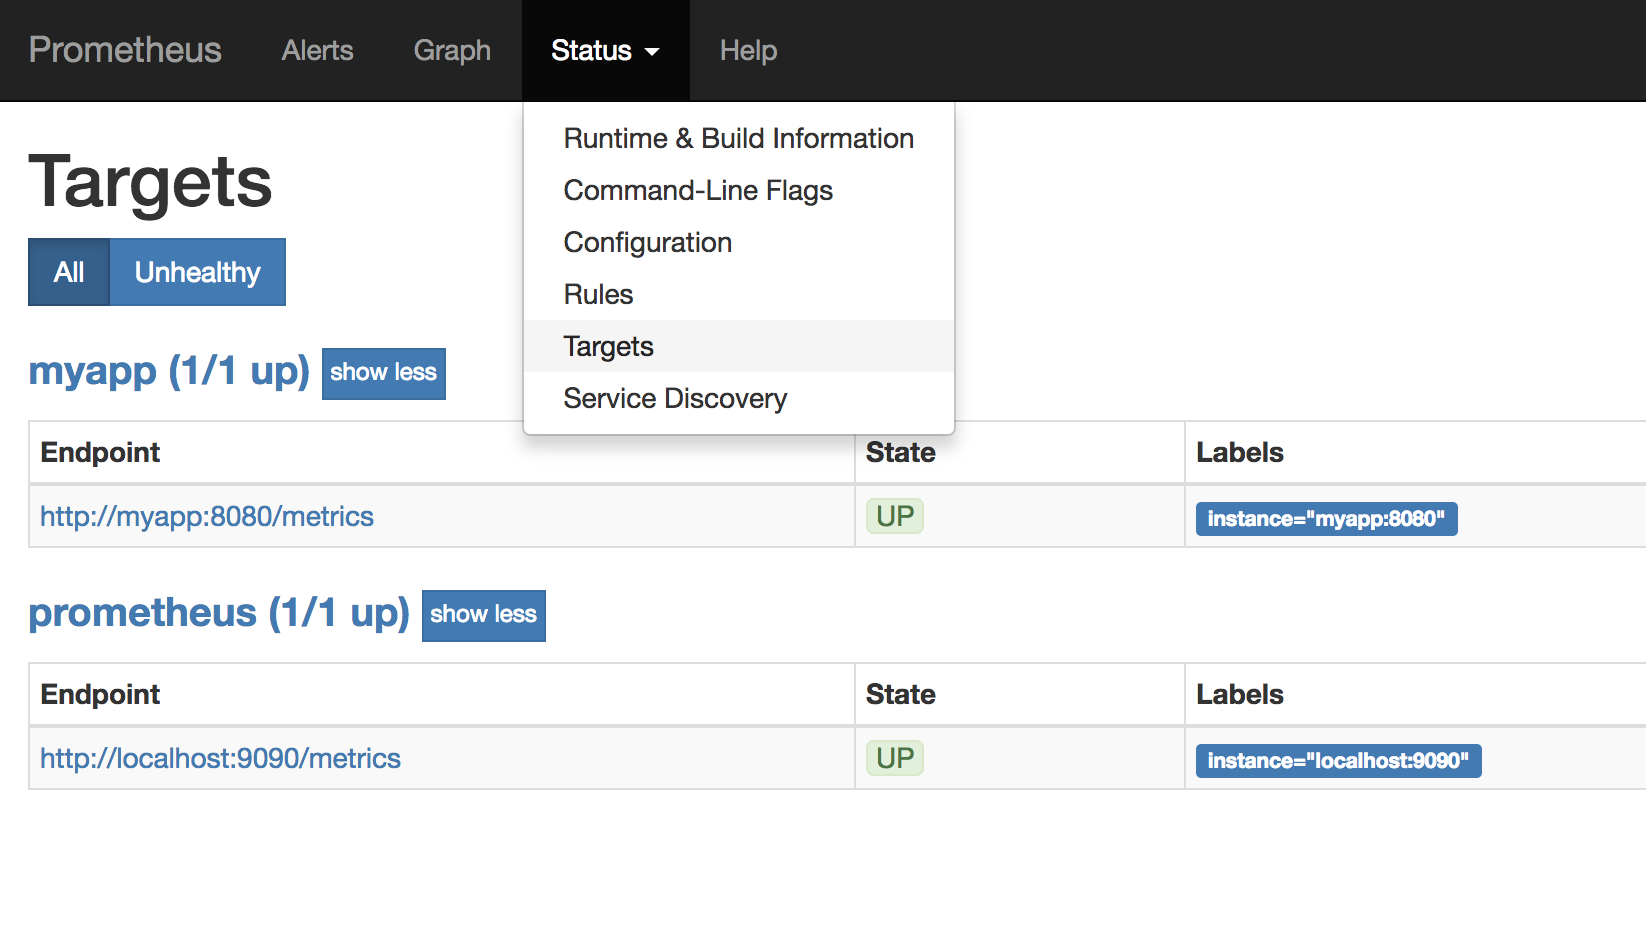
The first configuration is for Prometheus to scrape itself! The second configuration is our application myapp.
Test Your Deployment by Adding Load
Next, let's generate some load on our application using Apache ab in order to get some data into Prometheus. For example, here I am hitting the API 500,000 times with 100 concurrent requests at a time.
$ ab -n 500000 -c 100 http://myapp-myproject.192.168.99.100.nip.io/api/greeting
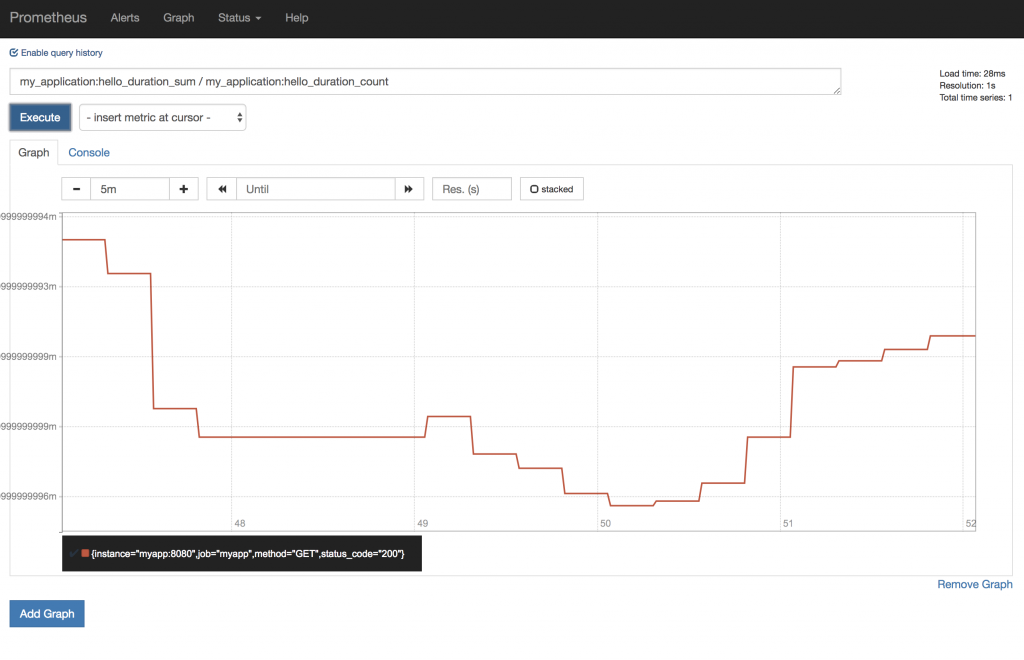
After generating load, we can go back to the main Prometheus dashboard screen and construct a simple query to see how our service performed during this test. We will use our custom hello_duration metric to measure latency. Type this query into the textbox.
my_application:hello_duration_sum / my_application:hello_duration_count
You can experiment with other metrics that Prometheus gathers to explore other measurements that might be meaningful for your application. For example, in the simple example above, Prometheus provides this graph.
Conclusion
As you can see, the actual code required to instrument your services is relatively simple and not too verbose. But when we begin to instrument our applications there is a bit of infrastructure set up required. In addition, some thought must go into what is the most relevant information for your services and circumstances. I encourage you to give this tutorial a try and let me know what queries you find useful!
Last updated: January 12, 2024