There is nothing developers and users hate more than waiting a long time for new software features to be deployed. Being stuck in an endless loop of long response times for QA and feedback is painful, especially when they have started a new project.
Red Hat OpenShift is highly regarded. It is the perfect platform for your organization to implement the DevOps approach, speeding up the time for ideas to go from development to deployment. Red Hat OpenShift will allow your organization's unified platform to build, test, review, and deploy your applications. Here, your organization will be able to utilize secure, reliable, cloud-native products while uniting the inner and outer loop of development.
Many developers have heard of the benefits DevOps provides, such as faster deployment, greater automation, higher quality applications, and promoted collaboration. This article describes how DevOps is implemented and the tools we use.
Let's start in the inner loop where developers write, debug, test, and push their code. The OpenShift web console provides a variety of tools to enable DevOps developers complete control over their experience.
Topology view
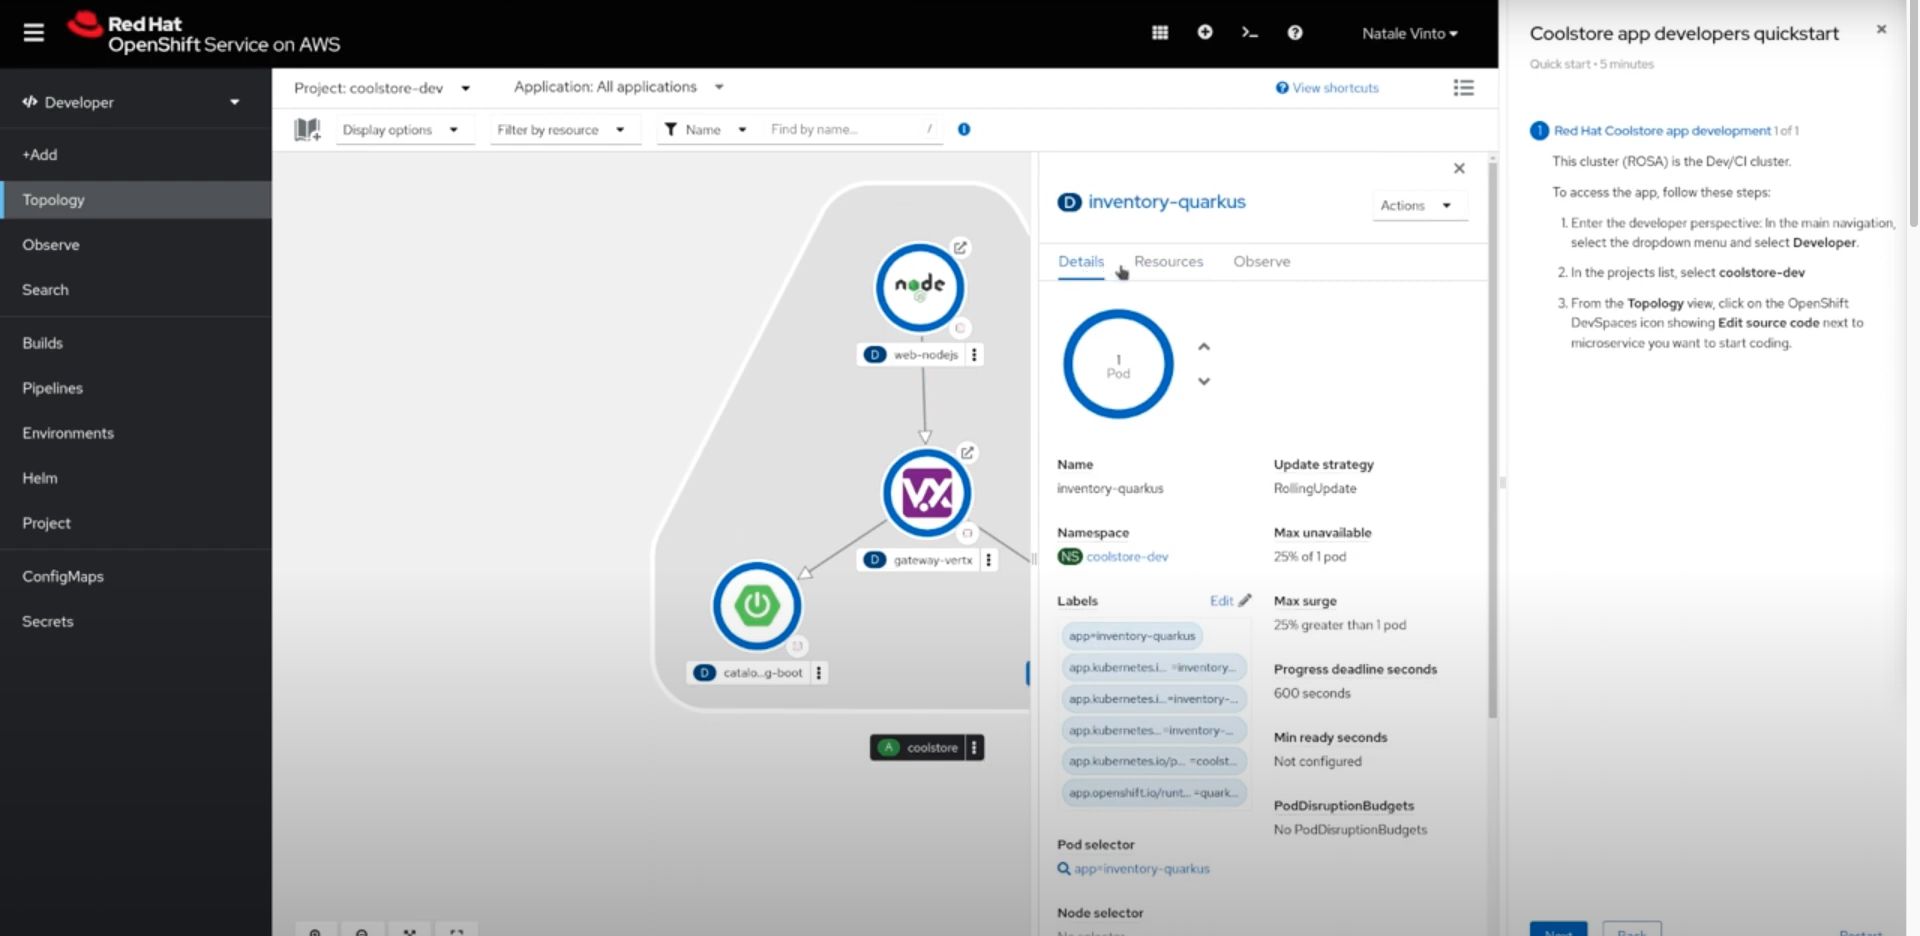
When a developer first logs into the OpenShift web console, the Topology view will provide a high level overview of your application and how microservices are connected. When a specific service is selected, you will see a list of details, such as the status and health of the application, as shown in Figure 1. The resource tab displays details about which applications are running and the external/internal networking of the service. Each microservice has a log containing information about events that have occurred.
Under the observe tab, developers can choose a custom time range to view their CPU, memory, and bandwidth resource consumption of an application. The OpenShift web console allows developers to customize which metrics are displayed, and create alerts for metrics deemed important.
Additionally, the OpenShift web console provides a developer catalog where you can self-serve from a variety of services. To access the developer catalog, navigate to the add page and click on Developer Catalog. This catalog will allow you to discover and scaffold various services, including templates, applications, and more. Many services can be used prebuilt or customized for your application.
OpenShift Dev Spaces
The best part of the OpenShift console for DevOps development is an integrated code editor for your service. Red Hat OpenShift Dev Spaces is an in-browser ID system that creates a development environment called a workspace.
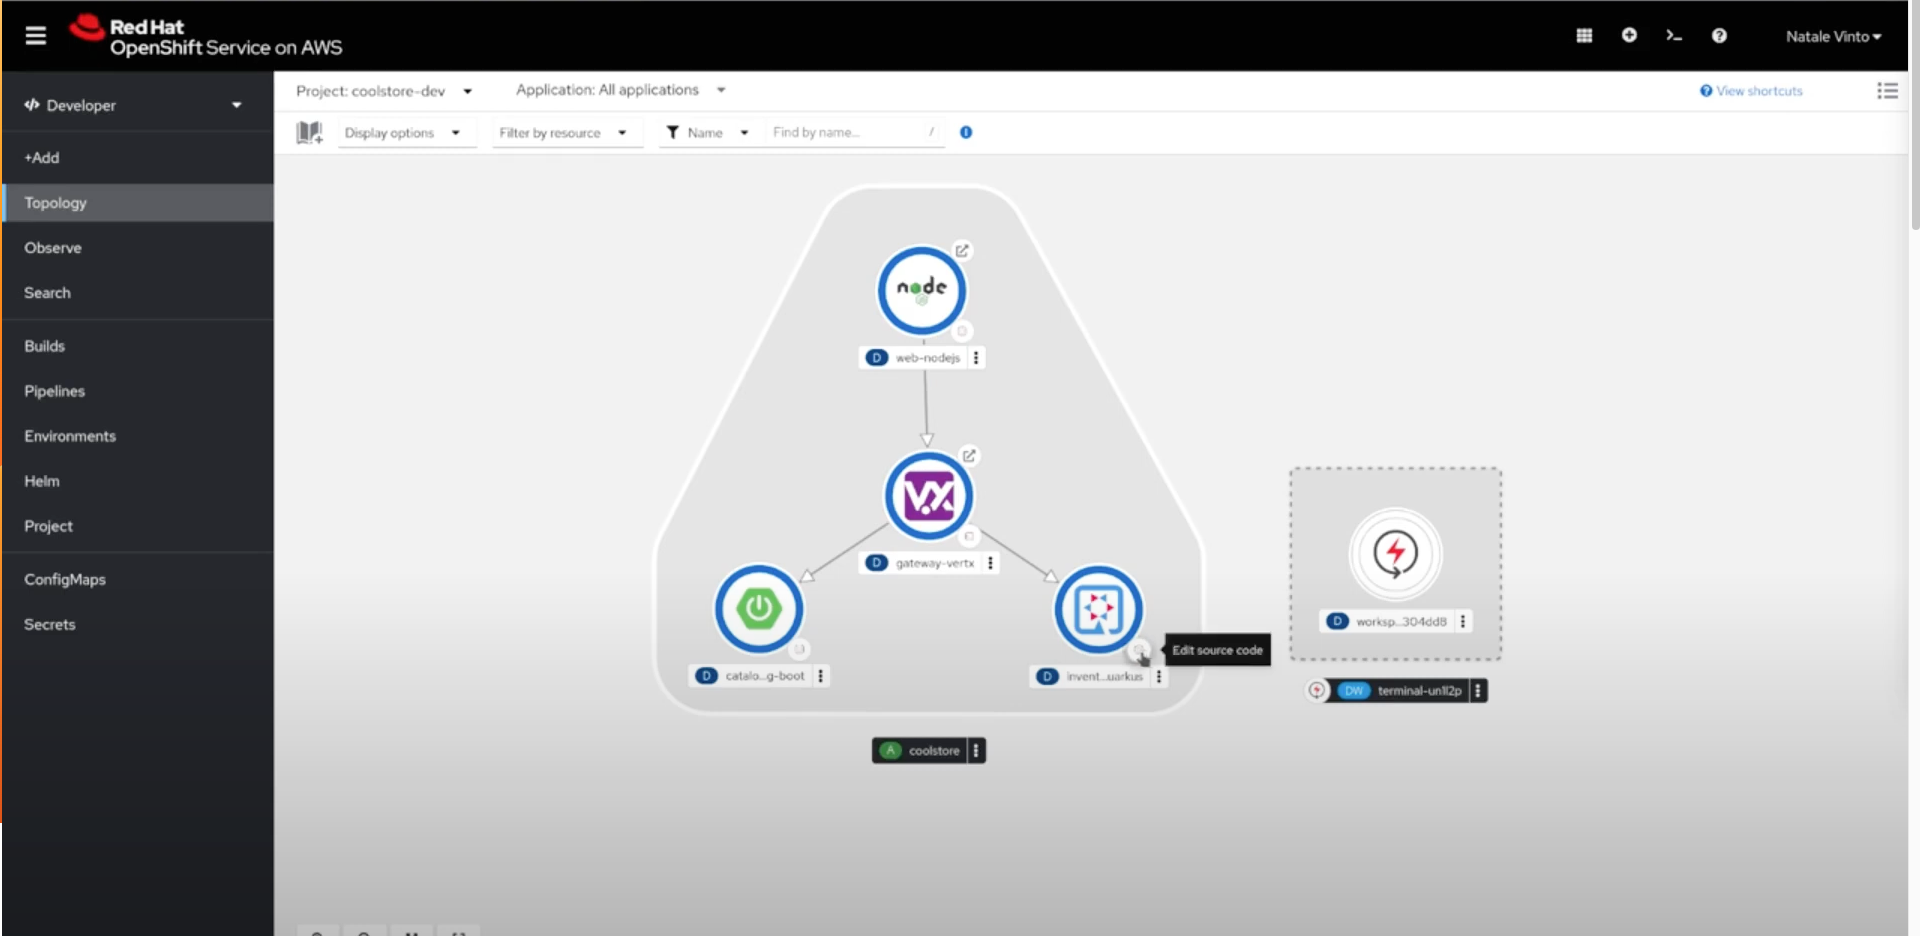
To create your workspace, head to the topology view. In the right hand corner of each service, click the icon, as shown in Figure 2. Now, OpenShift Dev Spaces will be launched! Additionally, you can access the workspace by going to the topology view and clicking on the grid in the top right corner. Then click Dev Spaces.
Developers can use the workspace prebuilt in the OpenShift platform or use a customized workspace. OpenShift Dev Spaces is a zero configuration environment allowing developers to change their code, test it, and commit it to a repository. The inner loop can work on more pressing work while the OpenShift platform handles the details of Kubernetes.
OpenShift Dev Spaces provides many tools that promote collaboration. Among one is a networking tool that exposes the microservice to the outside. Developers can share it with peers who can view what they are working on and offer feedback.
Dependency analytics
To further utilize OpenShift Dev Spaces and incorporate analytics and security into our DevOps cycle, let us download dependency analytics, a useful extension created by Red Hat in collaboration with Snyk.
On the left side of the code editor, click on the block icon (fifth from the top).
Go ahead and download the dependency analytics extension.
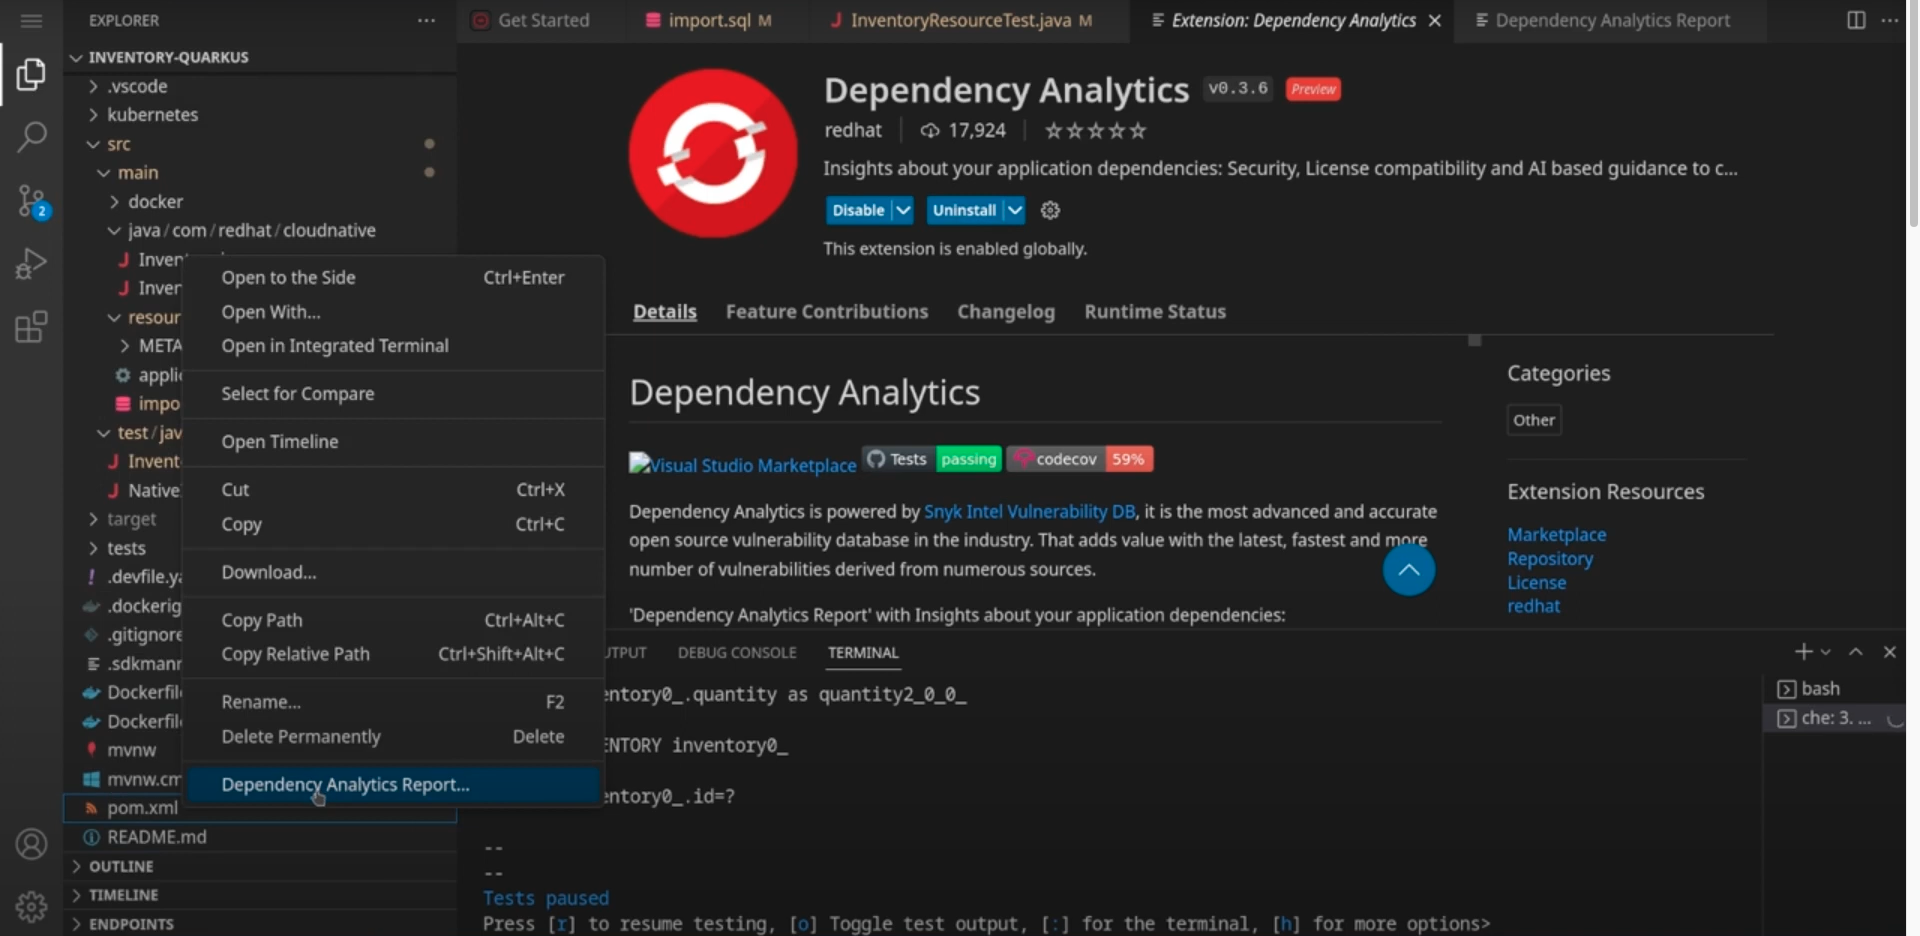
Once downloaded, head to your dependency file, and right-click on the file. You will be provided with an array of options, choose dependency analytics report, as shown in Figure 3.
Afterwards, a report will pop up giving details about the vulnerability and security issues of each dependency.
Looking ahead in the development cycle
OpenShift Pipelines (powered by Tekton) and OpenShift GitOps (powered by Argo CD) can work simultaneously to deploy your application to its target environment. Together, both products work to create scalable, reliable, CI/CD pipelines. These automated pipelines ensure that organizations can continue to work together at fast speeds to build, test, and integrate, and deploy software.
For example, in the coolstore demo, the inventory-update pipeline has many tasks. The pipeline first collects information about the environment, like any tokens that need to be used. Next, it clones the repository where the code is stored and builds the code. Once the code is built, SonarQube is used to perform a code analysis to detect any bugs or code smells.
A container image is built, using Buildah in this case. Now, two parallel streams are executed. One scans the image to check for vulnerabilities and provides a report. Organizations can customize their policy on vulnerabilities. For example, it can receive notifications if a vulnerability is critical and continue if not critical.
In the other stream, the code is updated with the new changes, and then pushed into the Git repository. After updating, it does an integration test, in this case using Newman. This 3-step process proceeds for each dev and stage environment. After a Slack message is set up, it notifies that the build is complete.
An admin can now come in and approve a request to merge with the prod environment.
Get the full benefit of OpenShift for DevOps
Now you know how to properly use Red Hat OpenShift to implement the DevOps lifecycle. The topology view keeps everyone in the development cycle synced with the status and usage of their applications. The OpenShift Dev Spaces tool allows for collaboration and updating while developing. Extensions in your workspace allows for increased security and higher quality applications. You can also have continuous integration and continuous deployment by using Red Hat OpenShift Pipelines and Red Hat OpenShift GitOps.
Many other features of DevOps include edge deployment, advanced cluster management, and automation via Red Hat Ansible Automation Platform. Explore all the features that you can implemented on Red Hat.
Last updated: October 31, 2023