In this article, we will walk through the process of creating a custom stack unwinder for the GNU Project Debugger (GDB) using GDB's Python API. We'll first explore when writing such an unwinder might be necessary, then create a small example application that demonstrates a need for a custom unwinder before finally writing a custom unwinder for our application inside the debugger.
By the end of this tutorial, you'll be able to use our custom stack unwinder to allow GDB to create a full backtrace for our application.
What is an unwinder?
An unwinder is how GDB figures out the call stack of an inferior, for example, GDB's backtrace command:
Breakpoint 1, woof () at stack.c:4 4 return 0;

(gdb) backtrace
#0 woof () at stack.c:4
#1 0x000000000040111f in bar () at stack.c:10
#2 0x000000000040112f in foo () at stack.c:16
#3 0x000000000040113f in main () at stack.c:22
(gdb)
Figuring out frame #0 is easy; the current program counter ($pc) value tells GDB which function the inferior is currently in. But to figure out the other frames, GDB needs to read information from the inferior's registers and memory. The unwinder is the component of GDB that performs this task.
Having an understanding of the inferior's frames isn't just used for displaying the backtrace, though; commands like next and finish also need an accurate understanding of the stack frames in order to function properly.
Any time GDB needs information about a frame beyond #0, an unwinder will have been used.
What is a custom unwinder?
GDB already has multiple built-in unwinders for all the major architectures GDB supports. By far, the most common unwinder will be the DWARF unwinder, which reads the DWARF debug information and uses it to unwind the stack for GDB.
But not all functions are compiled with debug information. When GDB finds a function without DWARF debug information, it falls back to a built-in prologue analysis unwinder.
The prologue analysis unwinder disassembles the instructions at the start of a function and uses this information, combined with an understanding of the architecture's ABI, to provide unwind information. For many functions, the prologue analysis unwinder will do a reasonable job. Still, there's a limit to how smart the prologue analysis unwinder can be, and GDB can never expect to handle every function this way.
And this is where the Python unwinder API comes in. Using this API, it is possible to write Python code that will be loaded into GDB. This code can then "claim" frames for which GDB is otherwise unable to unwind correctly, and the Python code can instead be used to provide the unwind information to GDB.
Building an example use case
In most well-written applications, very few functions will need the support of a custom unwinder. The sort of functions that GDB will struggle with are those that do unexpected things with the underlying machine state; for example, functions that manipulate the stack in unexpected ways are likely to confuse GDB.
The example application we're going to write does just that: it allocates a second stack and uses a small assembler function to switch to, and run a function on, the new stack.
GDB will have no problem unwinding the standard C frames, but the assembler function, which changes the stack, is going to confuse GDB, and initially, we will be unable to obtain a backtrace through this function.
Of course, writing in assembly language means this application will only work for one architecture, in this case, x86-64, and the unwinder we eventually write will also be tied to this one architecture. This is perfectly normal; unwinders are dealing with machine registers, so it is expected that an unwinder will only apply to a single architecture.
The demonstration application is split into two files, first, we have demo.c:
#include <stdio.h>
#include <sys/mman.h>
#include <unistd.h>
#include <stdlib.h>

/* This function is in our assembly file.  */
extern void run_on_new_stack (void *stack, void (*) (void));

/* Return pointer to the top of a new stack.  */
static void *
allocate_new_stack (void)
{
  int pagesz = getpagesize ();
  void *ptr = mmap (NULL, pagesz, PROT_READ | PROT_WRITE,
                	MAP_ANONYMOUS | MAP_PRIVATE, -1, 0);
  if (ptr == MAP_FAILED)
	abort ();
  return ptr + pagesz;
}

/* A function to run on the alternative stack.  */
static void
func (void)
{
  printf ("Hello world\n");
}

/* Allocate a new stack.  Run a function on the new stack.  */
int
main (void)
{
  void *new_stack = allocate_new_stack ();
  run_on_new_stack (new_stack, func);
  return 0;
}
Then we have runon.S:
    	.global run_on_new_stack
run_on_new_stack:
    	/* Incoming arguments:

       	%rdi    - top of new stack pointer,
       	%rsi - function to call.

       	Store previous %rbp and %rsp to the new stack.
       	Set %rbp and $rsp to point to the new stack.
       	Call the function in %rsi.  */
    	mov 	%rbp, -8(%rdi)
    	mov 	%rsp, -16(%rdi)

    	add 	$-16, %rdi

    	mov 	%rdi, %rbp
    	mov 	%rdi, %rsp

    	callq   *%rsi

    	movq 	0(%rbp), %rsp
    	movq 	8(%rbp), %rbp

    	ret

    	.size run_on_new_stack, . - run_on_new_stack
    	.type run_on_new_stack, @function
Finally, compile the application like this:
gcc -g3 -O0 -Wall -Werror -o demo demo.c runon.S
Now let's see how GDB handles stack unwinding without any additional support. For this, I'm using GDB 13.1:
$ gdb -q demo
Reading symbols from demo...
(gdb) break func
Breakpoint 1 at 0x4011b1: file demo.c, line 25.
(gdb) run
Starting program: /tmp/demo

Breakpoint 1, func () at demo.c:25
25      printf ("Hello world\n");
(gdb) backtrace
#0  func () at demo.c:25
#1  0x00000000004011fb in run_on_new_stack () at runon.S:19
#2  0x00007fffffffad68 in ?? ()
#3  0x00007fffffffad80 in ?? ()
#4  0x0000000000000000 in ?? ()
(gdb)
As you can see, GDB can unwind from func just fine; after all, that is a "normal" function compiled with debug information. But GDB is unable to figure out how to unwind from run_on_new_stack.
What our application is actually doing
Before we can write a custom unwinder in Python, we need to make sure we fully understand what the demonstration application is actually doing.
We have three frames: main, run_on_new_stack, and func.
In main, just before we call run_on_new_stack, the application’s stack looks like Figure 1.
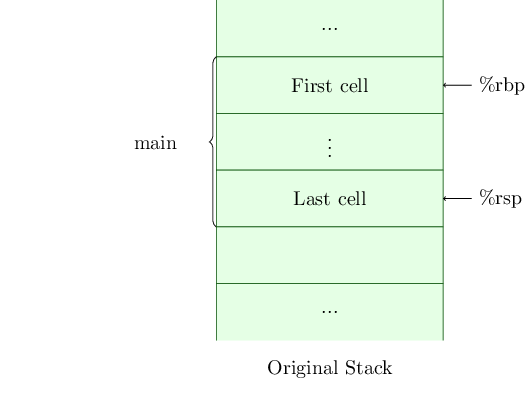
The register %rbp, sometimes known as the frame pointer, points to the top of the frame for main, while %rsp, otherwise known as the stack pointer, points to the last valid address of the frame for main.
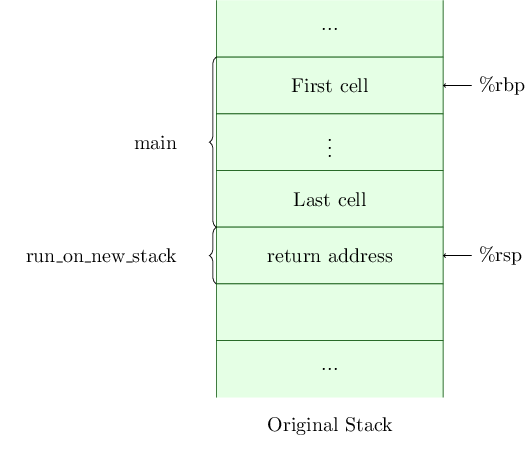
When we call from main to run_on_new_stack, the return address within main is pushed onto the stack and %rsp is updated. The stack now looks like Figure 2.
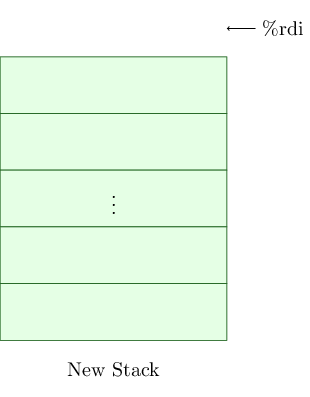
In main, we also allocated a new stack, and this was passed through as the first function argument to run_on_new_stack. As such, register %rdi points at an address just above the new stack, like this (Figure 3).
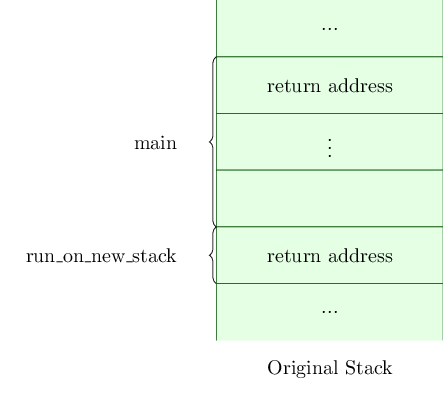
Within run_on_new_stack we switch over to the new stack. The return address within main is left on the original stack, and the pointers (%rbp and %rsp) to the original stack are backed up on the new stack, and then updated to point at the new stack. We then call func, which will push the return address within run_on_new_stack onto the new stack. Once we are in func, the state of the two stacks is now as shown in Figures 4 and 5.
 |
 |
When unwinding, GDB doesn't understand how to use the information on the new stack to find the original stack, and so the backtrace is incomplete. This is the problem that our custom unwinder will solve for us.
Starting our custom unwinder
The custom unwinder will be written as a Python script in the file runon-unwind.py, which we can then source in GDB to provide the extra functionality.
In GDB's Python API, an unwinder is an object that implements the __call__ method. GDB will call each unwinder object for every frame; the unwinder should return None if the unwinder doesn't handle the frame or return a gdb.UnwindInfo object if the unwinder wishes to take responsibility for the frame.
Let's start by writing an empty unwinder that doesn't claim any frames:
from gdb.unwinder import Unwinder


class runto_unwinder(Unwinder):
    def __init__(self):
        super().__init__("runto_unwinder")

    def __call__(self, pending_frame):
        return None


gdb.unwinder.register_unwinder(None, runto_unwinder(), replace=True)
The last line of this file is responsible for registering the new unwinder with GDB. The first argument None tells GDB to register this unwinder in the global scope, but it is also possible to register an unwinder for a specific object file or a specific program space. We'll not cover these cases in this tutorial, but the GDB documentation has more details.
The second argument to register_unwinder is our new unwinder object. We'll discuss this more below.
The final argument replace=True indicates that this new unwinder should replace any existing unwinder with the same name. This is useful when developing the unwinder as we can adjust our script and re-source it from GDB; the updated unwinder will then replace the existing one.
In our unwinder object runto_unwinder, the constructor just calls the parent constructor and passes in a name for our unwinder. The name can be used within GDB to disable and enable the unwinder using the disable unwinder and enable unwinder commands, respectively. There is also info unwinder which lists all the registered Python unwinders.
Our unwinder object also implements the required __call__ method. This method is passed a gdb.PendingFrame object in pending_frame. This pending frame describes the frame that is searching for an unwinder. We must examine this object and decide whether this unwinder applies to this pending frame. By returning None, our unwinder is currently telling GDB that we don't wish to claim pending_frame, our unwinder as it currently stands will not claim any frames, but we can start to address that next.
Identifying frames to claim
The first task our new unwinder needs to do is to decide which frame, or frames, should be claimed and which should not be claimed. Any frames not claimed by our unwinder will be offered to any other registered unwinders and will then be offered to GDB's built-in unwinders.
The easiest way to decide if we should claim a frame or not is to compare the program-counter address within the frame to the address range of the function we're claiming for—in this case, run_on_new_stack. We can easily find the program-counter address for the frame by reading the $pc register. This is done using the read_register method of the gdb.PendingFrame class.
Having read $pc, we need an address range to compare against. For that, we will make use of GDB's disassembler. We will disassemble run_on_new_stack and extract the address of each instruction. We can then use the first and last addresses as the lower and upper bounds that our unwinder should claim.
Update runon-unwinder.py like this:
from gdb.unwinder import Unwinder

_unwind_analysis = None


def analyze():
    global _unwind_analysis
    # Disassemble the run_on_new_stack function.
    disasm = gdb.execute("disassemble run_on_new_stack", False, True)
    # Discard the first and last lines, these don't contain
    # disassembled instructions, and are of no interest.
    disasm = disasm.splitlines()[1:-1]
    # Extract the address of each instruction, and store these
    # addresses into the global _unwind_analysis list.
    disasm = [int(l.lstrip().split()[0], 16) for l in disasm]
    _unwind_analysis = disasm


class runto_unwinder(Unwinder):
    def __init__(self):
        super().__init__("runto_unwinder")

    def __call__(self, pending_frame):

        # Analyze the function we're going to unwind.
        global _unwind_analysis
        if _unwind_analysis is None:
            analyze()

        # If this is not a frame we handle then return None.
        pc = pending_frame.read_register("pc")
        if pc < _unwind_analysis[0] or pc > _unwind_analysis[-1]:
            return None

        print(f"Found a frame we can handle at: {pc}")
        return None


gdb.unwinder.register_unwinder(None, runto_unwinder(), replace=True)
The new analyze function disassembles run_on_new_stack and stores the address of each instruction in the global _unwind_analysis list.
In runto_unwinder.__call__ we initialize _unwind_analysis by calling analyze once. We read $pc by calling pending_frame.read_register, and then we compare pc to the first and last addresses in _unwind_analysis. If the frame's program-counter is outside of the accepted range, then we return None; this indicates to GDB that we don't wish to claim this frame.
If the frame's program-counter is within the range of run_on_new_stack, then we print a message, and, for now, also return None—don't worry, though, we'll soon be doing more than returning None here, but right now, let's test our code.
Using the same demonstration application as before, here's an example GDB session:
$ gdb -q demo
Reading symbols from demo...
(gdb) break func
Breakpoint 1 at 0x4011b1: file demo.c, line 25.
(gdb) run
Starting program: /tmp/demo

Breakpoint 1, func () at demo.c:25
25      printf ("Hello world\n");
(gdb) source runto-unwind.py
(gdb) backtrace
Found a frame we can handle at: 0x4011fb <run_on_new_stack+20>
#0  func () at demo.c:25
#1  0x00000000004011fb in run_on_new_stack () at runon.S:19
#2  0x00007fffffffad38 in ?? ()
#3  0x00007fffffffad50 in ?? ()
#4  0x0000000000000000 in ?? ()
(gdb)
Notice the line: Found a frame we can handle at: 0x4011fb <run_on_new_stack+20>. Don't worry if the addresses you see are different; what's important is that the message is printed—and printed just once. This indicates that our unwinder has identified a single frame it wishes to claim. The address from that line, 0x4011fb, matches the address from frame #1, the run_on_new_stack frame; this shows that the correct frame was claimed.
A detour into frame-ids
The next step is to update the __call__ method to return a value that indicates the frame has been claimed by this unwinder. However, in order to claim the frame, we must provide a frame-id for the frame.
A frame-id is a unique identifier generated by the unwinder that must be unique for each stack frame but the same for every address within a particular invocation of a function.
Imagine the case where GDB is stepping through a function. After each step, GDB needs to recognize if it is still in the same frame or not. After each step, the unwinder will be used to identify the frame and generate the frame-id again. So long as the generated frame-id is always the same, GDB will understand it is still in the same frame.
Within GDB, frame-ids are a tuple of stack-pointer and code-pointer addresses. Often unwinders use the stack address at entry to the function (typically called the frame base address), and the program address for the function's first instruction.
Within GDB's Python API, a frame-id is represented by any object that has the sp and pc attributes. These attributes should contain gdb.Value objects representing their respective addresses.
Creating a frame-ID and UnwindInfo object
Now that we know about frame-ids, let's dive in and update our unwinder. We'll discuss these changes afterward. Update runto-unwind.py as follows:
from gdb.unwinder import Unwinder

_unwind_analysis = None


def analyze():
    global _unwind_analysis
    # Disassemble the run_on_new_stack function.
    disasm = gdb.execute("disassemble run_on_new_stack", False, True)
    # Discard the first and last lines, these don't contain
    # disassembled instructions, and are of no interest.
    disasm = disasm.splitlines()[1:-1]
    # Extract the address of each instruction, and store these
    # addresses into the global _unwind_analysis list.
    disasm = [int(l.lstrip().split()[0], 16) for l in disasm]
    _unwind_analysis = disasm


class FrameID:
    def __init__(self, sp, pc):
        self.sp = sp
        self.pc = pc


class runto_unwinder(Unwinder):
    def __init__(self):
        super().__init__("runto_unwinder")

    def __call__(self, pending_frame):

        # Analyze the function we're going to unwind.
        global _unwind_analysis
        if _unwind_analysis is None:
            analyze()

        # If this is not a frame we handle then return None.
        pc = pending_frame.read_register("pc")
        if pc < _unwind_analysis[0] or pc > _unwind_analysis[-1]:
            return None

        # Create a frame id that will remain consistent throughout
        # the frame, no matter what $pc we stop at.  We use the $sp
        # value for the previous frame (this was our $sp on frame
        # entry), and we use the $pc for the start of the function.
        #
        # For the first four and last two instructions, the previous
        # $sp value can be found in the %rsp register.
        #
        # For the fifth and sixth instructions we need to fetch the
        # previous $sp value from the original stack.
        rsp = pending_frame.read_register("rsp")
        if pc < _unwind_analysis[5] or pc > _unwind_analysis[6]:
            frame_sp = rsp
        else:
            frame_sp = gdb.parse_and_eval("*((unsigned long long *) 0x%x)" % rsp)
        func_start = gdb.Value(_unwind_analysis[0])
        frame_id = FrameID(frame_sp, func_start)

        # Create the unwind_info cache object which holds our unwound
        # registers.
        unwind_info = pending_frame.create_unwind_info(frame_id)

        print(f"Found a frame we can handle at: {pc}")
        return None


gdb.unwinder.register_unwinder(None, runto_unwinder(), replace=True)
Currently, GDB doesn't include any helper classes that can be used to represent a frame-id, so we need to define our own – FrameID. The only requirements are that this class has the sp and pc attributes.
Within the __call__ method we use the first address of run_on_new_stack as the program-counter value for the frame-id. This is done with this line:
func_start = gdb.Value(_unwind_analysis[0])
For the stack-pointer address of the frame-id, we need to be smarter. When we first enter run_on_new_stack, the previous stack-pointer value is still present in %rsp, but within run_on_new_stack, the %rsp register is stored to the new stack and a new value loaded into %rsp.
To handle these two cases, we use the following block of code:
        if pc < _unwind_analysis[5] or pc > _unwind_analysis[6]:
            frame_sp = rsp
        else:
            frame_sp = gdb.parse_and_eval("*((unsigned long long *) 0x%x)"
                                          % rsp)
We choose between the two possible paths based on the current location within the function. The addresses _unwind_analysis[5] and _unwind_analysis[6] were chosen by reviewing the instruction disassembly for run_on_new_stack. A good exercise would be to disassemble the function and convince yourself that the above choices are correct.
We can now create an instance of our FrameID class and use this instance to create a gdb.UnwindInfo object with these lines:
        frame_id = FrameID(frame_sp, func_start)

        # Create the unwind_info cache object which holds our unwound
        # registers.
        unwind_info = pending_frame.create_unwind_info(frame_id)
The gdb.UnwindInfo class is the last piece of the unwinder process. We will store unwound register values into our unwind_info object and return this to GDB in order to claim this frame. However, we're not there just yet—for now, we're still printing a debug message and returning None.
Adding unwound register values
Having decided to claim this frame, and having created a gdb.UnwindInfo object, we need to store some unwound register values in our new unwind_info object.
The unwound value of a register is the value a register had in the previous frame.
Locating the previous register values will involve understanding the assembler code for the function being unwound. You don't need to provide previous values for every register; in some cases, the previous value of a register will not be available at all, in which case nothing can be done.
To keep the complexity of this example down, we are only going to provide previous values for 3 registers, the program counter, %rsp, and %rbp. These registers are enough to allow GDB to build a complete backtrace on x86-64. Once you've seen how these registers are supported, extending the example to support other registers as needed should be easy enough.
As before, let's just update runon-unwind.py, and discuss the changes afterwards:
from gdb.unwinder import Unwinder

_unwind_analysis = None


def analyze():
    global _unwind_analysis
    # Disassemble the run_on_new_stack function.
    disasm = gdb.execute("disassemble run_on_new_stack", False, True)
    # Discard the first and last lines, these don't contain
    # disassembled instructions, and are of no interest.
    disasm = disasm.splitlines()[1:-1]
    # Extract the address of each instruction, and store these
    # addresses into the global _unwind_analysis list.
    disasm = [int(l.lstrip().split()[0], 16) for l in disasm]
    _unwind_analysis = disasm


class FrameID:
    def __init__(self, sp, pc):
        self.sp = sp
        self.pc = pc


class runto_unwinder(Unwinder):
    def __init__(self):
        super().__init__("runto_unwinder")

    def __call__(self, pending_frame):

        # Analyze the function we're going to unwind.
        global _unwind_analysis
        if _unwind_analysis is None:
            analyze()

        # If this is not a frame we handle then return None.
        pc = pending_frame.read_register("pc")
        if pc < _unwind_analysis[0] or pc > _unwind_analysis[-1]:
            return None

        # Create a frame id that will remain consistent throughout the
        # frame, no matter what $pc we stop at.  We use the $sp value
        # for the previous frame (this was our $sp on frame entry),
        # and we use the $pc for the start of the function.
        #
        # For the first four and last two instructions, the previous
        # $sp value can be found in the %rsp register.
        #
        # For the fifth and sixth instructions we need to fetch the
        # previous $sp value from the original stack.
        rsp = pending_frame.read_register("rsp")
        if pc < _unwind_analysis[5] or pc > _unwind_analysis[6]:
            frame_sp = rsp
        else:
            frame_sp = gdb.parse_and_eval("*((unsigned long long *) 0x%x)" % rsp)
        func_start = gdb.Value(_unwind_analysis[0])
        frame_id = FrameID(frame_sp, func_start)

        # Create the unwind_info cache object which holds our unwound
        # registers.
        unwind_info = pending_frame.create_unwind_info(frame_id)

        # Calculate the previous register values.  Select the correct
        # previous value for $rbp based on where we are in the
        # function.
        if pc < _unwind_analysis[4] or pc > _unwind_analysis[7]:
            prev_rbp = pending_frame.read_register("rbp")
        else:
            prev_rbp = gdb.parse_and_eval("*((unsigned long long *) 0x%x)" % (rsp + 8))

        # We use the previous $sp value in our frame-id, which is handy!
        prev_rsp = frame_sp

        # The previous $pc is always on the original (incoming) stack.
        prev_pc = gdb.parse_and_eval("*((unsigned long long *) 0x%x)" % (prev_rsp))

        # And store the previous values into our cache.
        unwind_info.add_saved_register("rsp", prev_rsp)
        unwind_info.add_saved_register("rbp", prev_rbp)
        unwind_info.add_saved_register("pc", prev_pc)

        # Return the cache for GDB to use.
        return unwind_info


gdb.unwinder.register_unwinder(None, runto_unwinder(), replace=True)
The most important part of this new version are the three calls to unwind_info.add_saved_register; this is how we record the unwound register values. The first argument to these calls is the name of the register we are recording, and the second argument is the value that register had in the previous frame.
The three registers we record are pc, rsp, and rbp. Figuring out the previous value for the first two registers is pretty easy. We already have the previous rsp value, remember, this is what we used for our frame-id so that we can reuse that value here.
Recall from our earlier stack diagrams; the return address in main was the last thing stored on the original stack, this is what the previous stack-pointer points at, so we can load the return address with this line:
        prev_pc = gdb.parse_and_eval("*((unsigned long long *) 0x%x)"
                                     % (prev_rsp))
And this just leaves the previous rbp value. Just like we found the previous rsp value earlier, the current instruction within run_on_new_stack will determine the location of the previous rbp value. Initially the previous value is in the rbp register, but we store this previous value to the new stack before calling func. And so, to find the correct previous value, we need to switch based on the program-counter value, which we do with these lines:
        if pc < _unwind_analysis[4] or pc > _unwind_analysis[7]:
            prev_rbp = pending_frame.read_register("rbp")
        else:
            prev_rbp = gdb.parse_and_eval("*((unsigned long long *) 0x%x)"
                                          % (rsp + 8))
The last update is to remove the debug message that we have been printing until now, and instead of returning None, return our gdb.UnwindInfo object unwind_info. This tells GDB that our unwinder has claimed this frame. GDB will use the previous register values stored within unwind_info when it needs to unwind through this frame.
So, for the last time, let's try our unwinder in GDB:
$ gdb -q demo
Reading symbols from demo...
(gdb) break func
Breakpoint 1 at 0x4011b1: file demo.c, line 25.
(gdb) run
Starting program: /tmp/demo

Breakpoint 1, func () at demo.c:25
25      printf ("Hello world\n");
(gdb) source runon-unwind.py
(gdb) backtrace
#0  func () at demo.c:25
#1  0x00000000004011fb in run_on_new_stack () at runon.S:19
#2  0x00000000004011e0 in main () at demo.c:33
(gdb)
And success! We can now unwind through run_on_new_stack back to main.
Summary and conclusions
Writing custom stack unwinders is not trivial; it requires a good understanding of the function being unwound and the architecture the unwinder is being written for. There is more to GDB's unwinder API than has been discussed in this brief introduction. The full details can all be found in the documentation.
Last updated: August 14, 2023